While the name Jupiter might evoke thoughts of planets and stars, the Jupiter we're discussing today is not a celestial body but rather the most advanced swap aggregation system currently available. Built on the Solana blockchain, Jupiter provides much-needed liquidity infrastructure for the Solana ecosystem.
Technical Analysis: Unraveling Price Trends and Potential Opportunities
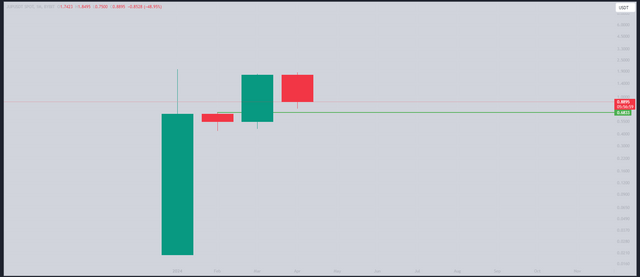
Monthly Chart: Limited Data but Promising Outlook

Due to its recent launch four months ago, Jupiter's monthly chart data is not yet readily available. However, despite its short existence, the project has generated significant hype. Nevertheless, the monthly chart indicates liquidity levels at 0.68.
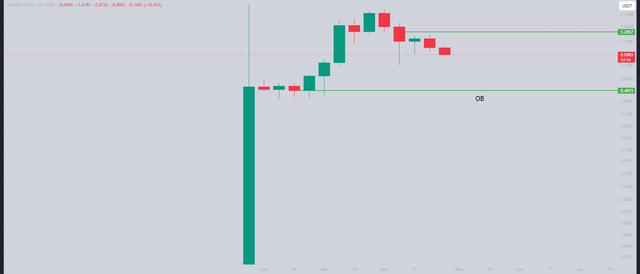
Weekly Chart: Support and Resistance Levels

Weekly chart data is also limited, but it reveals a strong order block at 0.4973 on the downside and an imbalance zone extending upwards to 1.2857. Long-term prospects appear promising, with potential returns similar to those of Uniswap.
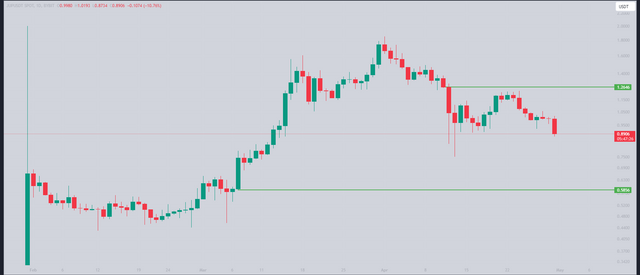
Daily Chart: Accumulation Zone and Potential Breakout

The daily chart presents a current accumulation zone, with prices ranging between 0.89 and 1.22. In the future, the price could potentially touch 0.58 and then rally towards the distribution zone above.
Disclaimer
It is crucial to emphasize that this analysis is solely intended for educational purposes and does not constitute financial advice. Any investment decisions based on this information are at your own discretion and risk.
!thumbup
Downvoting a post can decrease pending rewards and make it less visible. Common reasons:
Submit
Hello @ambisiousmind! You are Brilliant!
command: !thumbup is powered by witness @justyy and his contributions are: https://steemyy.com
More commands are coming!
Downvoting a post can decrease pending rewards and make it less visible. Common reasons:
Submit