LRC (Loopring) stands as the native token of Loopring, a Layer-2 scaling protocol built on Ethereum. It powers a decentralized exchange network that utilizes ZK Rollups cryptography to facilitate trades at significantly lower costs and with higher transaction speeds compared to Ethereum, processing over a thousand trades per second. Given its decentralized nature, we'll delve directly into chart analysis without further elaboration.
Technical Analysis: Unraveling Price Movements and Potential Opportunities
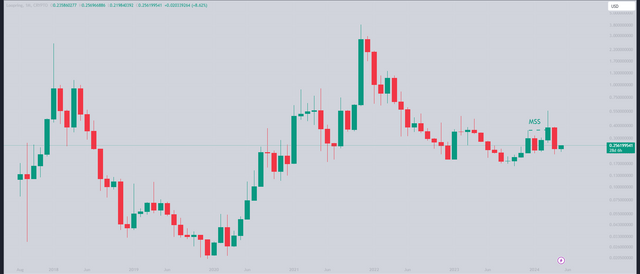
Monthly Chart: Range-Bound Trading and Potential Breakout

The monthly chart reveals that LRC has not exhibited any significant bullish momentum yet. It has been trading within a range, maintaining a steady accumulation phase. If a market structure shift occurs, the price could potentially surge directly towards $1.3.
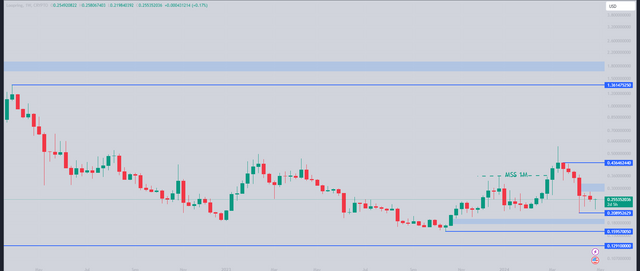
Weekly Chart: Downtrend and Potential Bottom Formation

The weekly chart indicates a downtrend, with no confirmed bottom yet. An imbalance zone exists at the $0.18 level, suggesting the possibility of further downward movement.
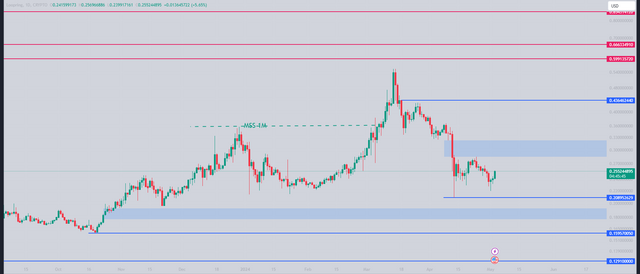
Daily Chart: Ranging Movement and Potential Breakouts

Currently, the daily timeframe presents a ranging movement. The price has attempted to break out of this range once but has not been successful. If it breaks out of the range to the upside, the next target could be the $0.35 level. Conversely, if it creates two more bottoms within the $0.22 to $0.20 range, the price might further decline to the $0.185 zone.
Disclaimer
It is crucial to emphasize that this analysis is solely intended for educational purposes and does not constitute financial advice. Any investment decisions based on this information are at your own discretion and risk.