ARPA Chain emerges as a Layer 2 network built atop the Ethereum blockchain, addressing data privacy concerns through a secure multi-party computation network. This innovative approach empowers users to effortlessly maintain the privacy of their inputs, with smart contracts safeguarding the integrity of transactions. Notably, ARPA Chain empowers developers, even those with limited cryptographic expertise, to create privacy-preserving DApps.
Historical Performance and Market Sentiment

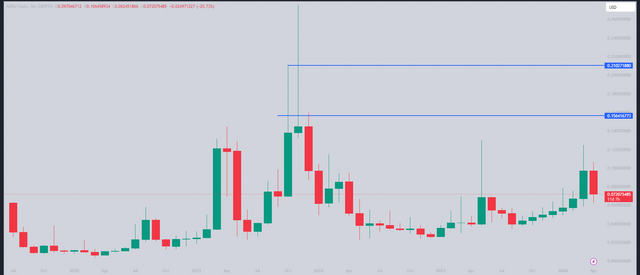
Launched in 2018, ARPA Chain reached its all-time high of approximately $0.275 during the previous bull market and has demonstrated resilience in recent bear market conditions. Since September, ARPA Chain has exhibited a strong bullish trend, poised for further potential growth.
Technical Analysis: Unveiling Price Patterns and Potential Targets
Weekly Timeframe: Bullish Momentum and Potential Breakout

The weekly timeframe reveals a clear deviation, indicating a shift towards an upward trajectory. The sole imbalance zone lies at the $0.03 level, unlikely to trigger rebalancing unless bearish sentiment grips the market. Currently, the price is undergoing a balancing phase, and upon completion, an upward surge is anticipated. In the longer timeframe, surpassing the previous all-time high remains a distinct possibility.
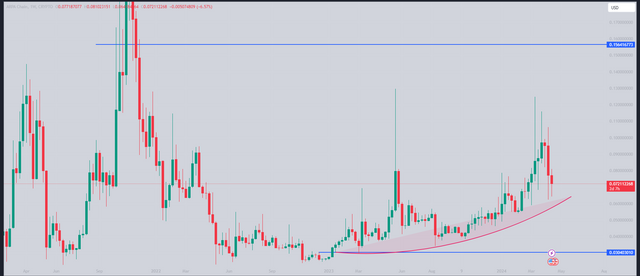
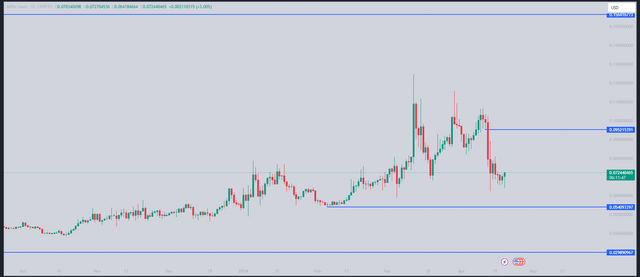
Daily Chart: Ranging Structure and Potential MSB

The daily chart presents a ranging structure with a range of $0.109 and a range low of $0.059. Currently, ARPA Chain trades at a discount, yet to generate an MSB (Multiple Support Break). Upon confirmation of an MSB, an 18% pump from $0.08 could propel the price to $0.094.
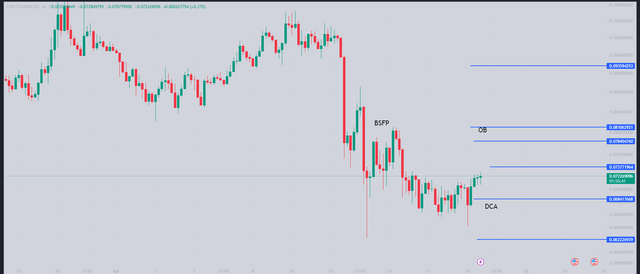
4-hour Chart: Potential Entry and Exit Points

The 4-hour chart depicts a bearish SFP (Standard Fibonacci Pattern) that extended down to $0.081, followed by the establishment of a counter-ranging zone. Currently, ARPA Chain is absorbing lower-level liquidity. Once this absorption is complete, a breakout is expected, with an entry point at $0.073, a DC zone at $0.068, and an SL (stop-loss) set below $0.0625. On the upside, a breaker block exists at $0.081. Consequently, TP1 (take profit 1) is set at $0.0783, TP2 at $0.081, and the exit point at $0.0935.
Disclaimer
It is crucial to emphasize that this analysis is solely intended for educational purposes and does not constitute financial advice. Any investment decisions based on this information are at your own discretion and risk.