Zilliqa stands out as a Layer-1 public blockchain-based permissionless cryptocurrency. In the realm of cryptocurrencies, scalability and throughput are crucial aspects, often lacking in prominent currencies like Bitcoin and Ethereum. Scalability in blockchain networks refers to the number of transactions processed per second and the associated costs. Throughput, on the other hand, reflects the ease with which users or developers can utilize a network and build DApps (decentralized applications) on it. Zilliqa has addressed these two critical factors by incorporating innovative features into its network.

Addressing Scalability Challenges with Sharding
Zilliqa tackles scalability issues by employing sharding, a technique that partitions network nodes into various clusters, enabling parallel processing. The project claims to have successfully enhanced transaction speed on its blockchain by a factor of thousands compared to the Ethereum network.
Benefits of Zilliqa for Developers and Users
Developers utilizing the Zilliqa blockchain can host DApps and execute smart contracts without encountering network congestion or high gas fees. These advantages position Zilliqa as a potential competitor to traditional payment methods like Visa and Mastercard.
Technical Analysis: Unraveling Price Movements and Potential Opportunities
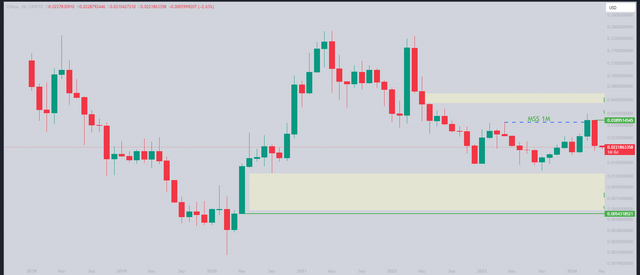
Monthly Chart: Market Structure Shift and Price Balancing

The monthly chart indicates a market structure shift for Zilliqa, but a breakout has yet to occur. After a shift at 0.037, the price is currently in a balancing phase. A potential support level lies at 0.0134.
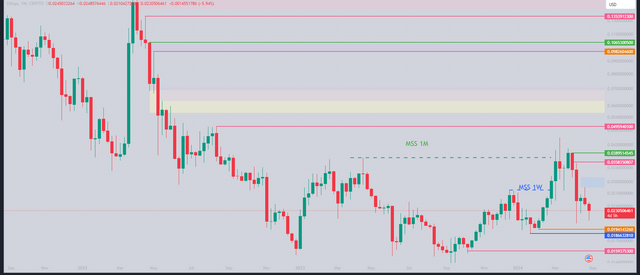
Weekly Chart: Bearish Movement and Potential Rebound

The weekly timeframe presents a bearish trend, with the price potentially dropping to 0.194 due to an order block at 0.0186. A subsequent rebound towards 0.0389 is possible. In the longer term, a price target of 0.25 could be achievable.
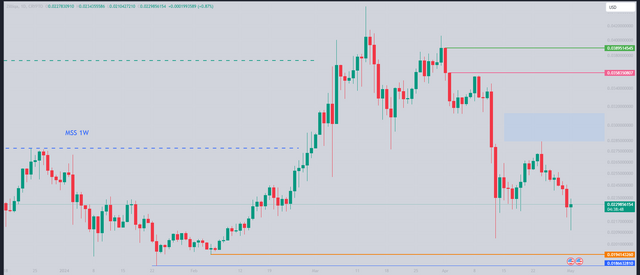
Daily Chart: Ranging Movement and Potential Breakout

The daily chart reveals a ranging movement, with a range high of 0.0268 and a range low of 0.0227. The price currently resides in an accumulation zone. A potential downward movement towards 0.0194 could occur, followed by a breakout and confirmation of the distribution zone at 0.03895.
Disclaimer
It is crucial to emphasize that this analysis is solely intended for educational purposes and does not constitute financial advice. Any investment decisions based on this information are at your own discretion and risk.