Entire Question
- Define in your own words what Harmonic Trading is?
- Define and explain what the pattern AB = CD is and how can we identify it?
- Clearly describe the entry and exit criteria, both for buying and selling using the AB = CD pattern?
- Make 2 entries (Up and Down) on any cryptocurrency pair using the AB = CD pattern confirming it with Fibonacci.

When I am hearing the word “HARMONICS”, it represents the meaning of REPEAT in my mind.
So, this Harmonic trading simply means a price-based analytical technique implies that a trading pattern or cycles repeat themselves. This technique uses pattern identification strategies to assess and forecast market patterns in the future.
Furthermore, In the financial markets, this type of trade uses precise alignments of Fibonacci-derived ratios to define distinctive price patterns.
Every expert trader will take more profits by using these harmonic patterns techniques because they can make their decisions easily to early opening or closing. Simply experts can put buy orders at the lowest prices and also, they can put the sell orders at the highest price. So that they can maximize their profits because of these HARMONIC PATTERNS.
There are several types of Harmonic Patterns. Below I will mention them to get and basic idea. If you need further information, please go to this link and read.

As we all know, there are two types of trends in the crypto market. The bullish trend we also called as an uptrend and the Bearish trend we also called a Downtrend.
In both trends most of the time, we can see lots of reversal patterns. As traders, we must have good analytical skills to predict future price variations. So that we can get the maximum profits.
AB=CD pattern is a 4-point technique to find the reversal point of a harmonic pattern. Here we will have 3 legs named AB, BD, and CD.
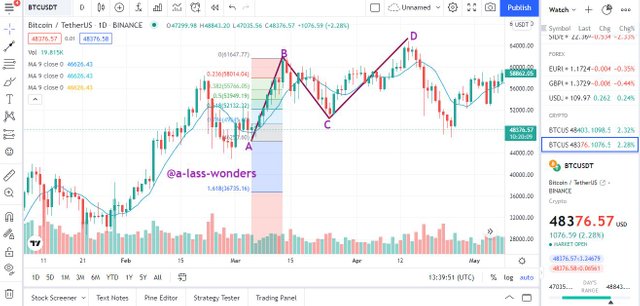
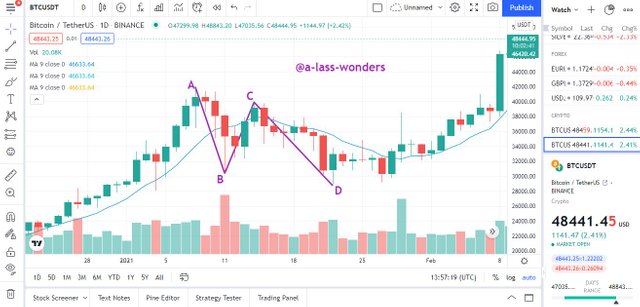
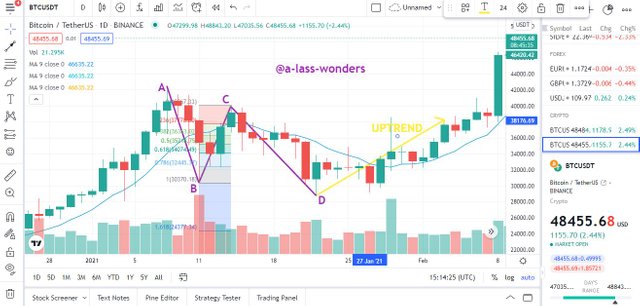
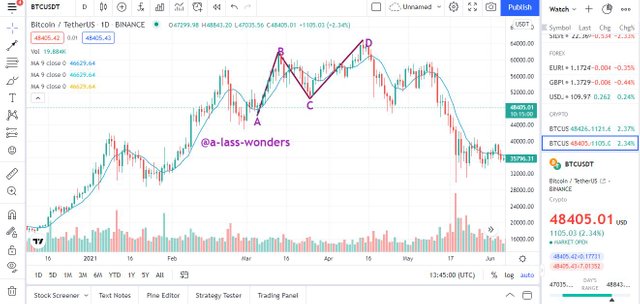
Please find below images for both bullish and bearish trends.
Above AB=CD trending patterns have below characteristics to identify.
Both AB and CD lines have approximately equal lengths while they are running approximately parallelly each other.
There are no secondary movements between points A and B. Simply every price movement shall not exceed the price levels of points A and B.
We can observe that point C is in between the 61.8% and 78.6% of the Fibonacci Retracement of A to B (AB leg).
We can observe that point D is in between the 127.2% and 161.8% of the Fibonacci Retracement of B to C (BC leg).

As a trader, we always trying to get maximum profits from every trade. To get maximum profit, we must place our entry order at the perfect time, and we must place our exit order at the same time as well.
Below I will explain about entry and exit criteria for both buying and selling using the AB = CD pattern.
ENTRY ORDER
First of all, we have to identify the 4-points (A, B, C, and D) in order to satisfy previously mentioned characteristics.
IF BEARISH TREND
After observing that point D is between 127.2% and 161.8% of the Fibonacci Retracements, the trader has to wait until a bull candle gets appeared. Once it gets appeared, the trader shall place a buy order.
IF BULLISH TREND
After observing that point D is between 127.2% and 161.8% of the Fibonacci Retracements, the trader has to wait until a bear candle gets appeared. Once it gets appeared, the trader shall place a sell order.
EXIT ORDER
As newcomers, we must keep in mind that we can’t predict future price movements based only on this kind of technical analysis.
We all know that the crypto market is highly volatile. Whales in the crypto market have the ability and the potential to change the market suddenly upside down. Also, some world trending upcoming news can also be influenced to this crypto market. As an example, I can mention here Elon Musk’s DOGE coin pump very recently.
So, most of the market professional’s opinion is, newcomers should not take the risk of expecting higher profits. They recommend configuring our “Stop Loss” with 2% above or below our point D for all the trades until the newcomer becomes a pro-level trader.

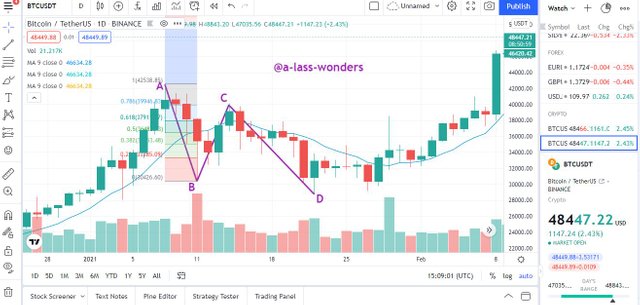
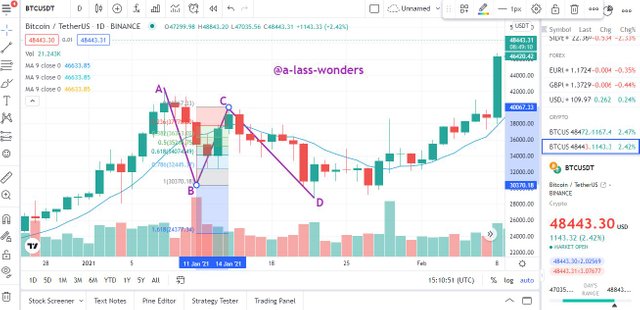
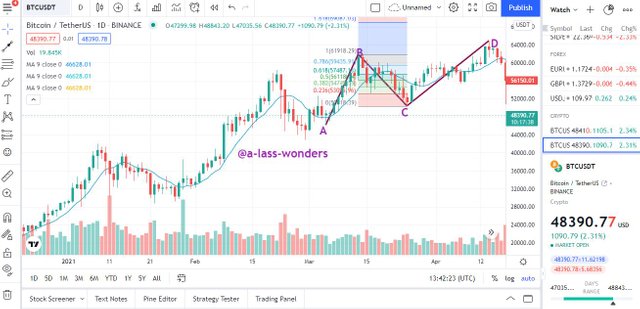
Firstly, I will elaborate on the situation of a reversal from a bearish trend to the bullish trend.
Please note that the below analysis was done for BTC/USDT in 1 Day chart.
First of all, we have to identify the 4-points as below.
Next, we have to draw the Fibonacci Retracements of A to B (AB leg). Then we can observe that point C is in between the 61.8% and 78.6% of this Fibonacci Retracement.
After that, we have to draw the Fibonacci Retracements of B to C (BC leg). Then we can observe that point D is in between the 127.2% and 161.8% of this Fibonacci Retracement.
As discussed in the previous task, we can observe that all the characteristics are satisfied now to confirm this as AB=CD pattern. This means we can expect an uptrend if the bull candle has appeared.
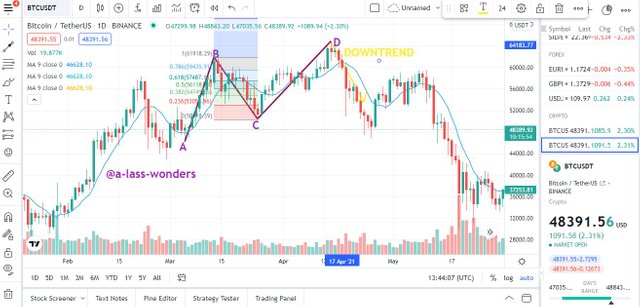
Now I will elaborate on the situation of a reversal from a bullish trend to a bearish trend.
First of all, we have to identify the 4-points as below.
Next, we have to draw the Fibonacci Retracements of A to B (AB leg). Then we can observe that point C is in between the 61.8% and 78.6% of this Fibonacci Retracement.
After that, we have to draw the Fibonacci Retracements of B to C (BC leg). Then we can observe that point D is in between the 127.2% and 161.8% of this Fibonacci Retracement.
As discussed in the previous task, we can observe that all the characteristics are satisfied now to confirm this as AB=CD pattern. This means we can expect a downtrend if the bear candle has appeared.
This is the end of my homework task and finally, I would like to give my gratitude to professor @lenonmc21 for giving us this valuable lecture. Frankly, I was able to gather perfect knowledge in this regard.

GOOD LUCK AND HAVE A NICE DAY!!
- My achievement 01 post: here.
- My achievement 02 post: here.
- My achievement 03 post: here.
- My achievement 04 post: here.

