Hi Crypto lovers!
Hope you all are doing well with the universe of cryptocurrency and today it's my pleasure to publish my homework task for professor @reminiscence01. Here I take this opportunity to give my sincere regards to professor @reminiscence01 for giving us about such an important core factor in cryptocurrency analysis; Technical Indicators, in the cryptocurrency world.
1) a) In your own words, explain Technical indicators and why it is a good technical analysis tool
Technical indicators are graphically offered math calculations regarding pre-price movements in the crypto market. It helps to predict future market trends and prices. Simply, it offers a clear interpretation of the future price changes in the crypto market.
Technical indicators are significant technical analysis tools coz it aids investors and traders to notice the current condition of the crypto market. It brings up conceivable and accessible trading opportunities via sending signals to traders about buying and selling.
Technical indicators grant to know about the past nature and behavior of the prices of a particular asset and about different market trends. Considering the above two facts gives a prediction into the future to take applicable trading decisions prior to the trade.
b) Are technical indicators good for cryptocurrency analysis? Explain your answer
Of course yes!
Technical indicators are a good tool that is used for cryptocurrency analysis if uses appropriately. I think technical indicators are the core factors in cryptocurrency analysis.
With the use of technical indicators, traders can obtain a clear glimpse about the behavior of the price movements of cryptocurrencies. The important thing is it figure out the price of a certain currency is trending or not and if trending, it depicts that trend is upward or downward. When a price of a certain currency is ranging, traders can know about it with the proper use of technical indicators.
Thus, considering those facts traders can make the best trading decisions at the correct time during their trades.
Also, technical indicators provide traders about the price history of a certain currency, which will help to predict the future price of that currency. Furthermore, it announces the future volume of a certain currency with the help of trading volumes and price momentum. Moreover, it aids the trader to avoid loss during a trade with the help of its entry and exit signals.
c)Illustrate how to add indicators on the chart and also how to configure them. (Screenshot needed)
- Go to the website of https://www.tradingview.com/chart/bS4wZVlE/ and select the chart section, in the upper bar.
2)Then select "Indicators" in the upper bar.
3)Next a window will open with a search bar to find out which indicator we are looking for. Here, I searched Parabolic SAR and so it appears like this.
4)After selecting the desired indicator it appears on the chart automatically.
5)To configure it, we can select the configuration icon at the top corner of the right-hand side.
- Then a window opens requesting to do modifications to it. According to the favor of the user, either it can be modified or keep as default.
7)Here, I add a new color to the line and increase its thickness in order to get a clear glimpse about its variation.
8)Lastly, the Parabolic SAR indicator has been added to the chart.
2) a) Explain the different categories of Technical indicators and give an example of each category. Also, show the indicators used as an example on your chart. (Screenshot needed)
Trend indicators / Trend following indicators
This indicator helps to recognize ongoing trends in the crypto market.
The idea behind this indicator is to give a guide to identifying the strengths and weaknesses of a particular trend and thereby it contributes to taking better trading decisions for investors and traders.
At the same time, it gives the opportunity to the trader to enter in the correct time at the initiation of the latest trend.
Examples for Trend Indicators
Moving average (MA) indicator
Average Direction Index (ADX) Indicator
Ichimoku Indicator
Parabolic SAR Indicator
MACD
Exponential moving average
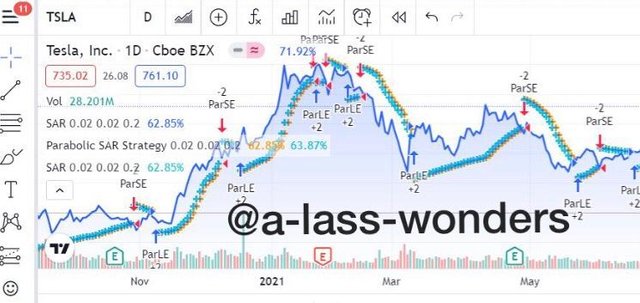
Here I used Parabolic Sar to denote trend indicators. Here this indicator points out an uptrend by placing itself below the price and downtrend placing itself above the price.
Volatility Indicators
These indicators aid to recognize ongoing market swings; upswings and downswings. This indicator depicts how volatile a currency can be coz it shows up and down of a currency to traders. These indicators have the ability to figure out price fluctuations of an asset very quickly.
In a nutshell, traders can get an idea about the volatility of a certain currency before initiating a trade.
Average True Range (ATR) Indicator
ADX indicator
Bollinger Bands
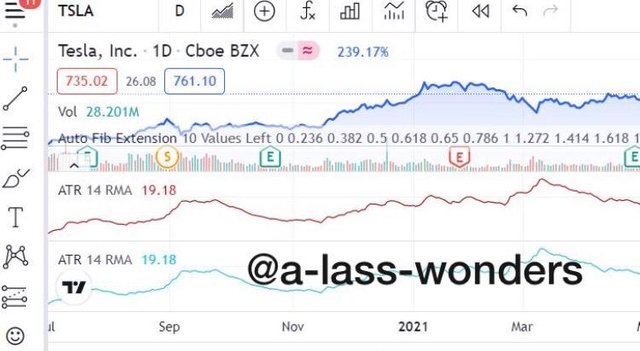
Here, I used the ATR indicator and it shows an exponential moving average. A higher ATR value denotes higher volatility and a lower ATR value depicts lower volatility.
Oscillator Indicator/ Momentum Indicator
This indicator demonstrates the price of a particular asset is oversold or overbought. When the price of an asset rises up and falls down this indicator oscillates to point out that.
Relative Strength Index (RSI) Indicator
Commodity Channel Index (CCI) Indicator
Stochastic
Moving Average Convergence Divergence (MACD) Indicator
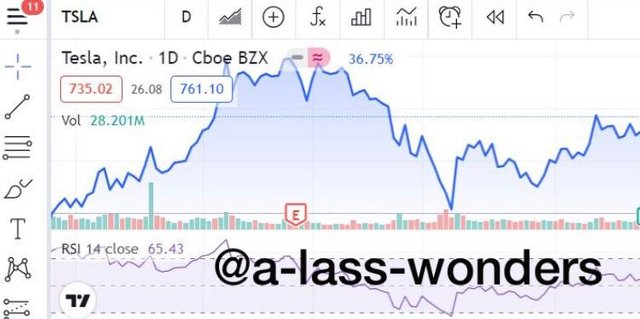
This is the most famous oscillator indicator among traders. Oversold assets are denoted below 30 in a 0-100, meanwhile overbought is above 70.
b) Briefly explain the reason why indicators are not advisable to be used as a standalone tool for technical analysis
Usually, each and every technical indicator give its projections by analyzing data from past incidents. Every indicator illustrates a certain situation of the market, hence if we use one of it and conclude trading decisions, our trading would have been in vain.
Simply, we have come to a trading decision regarding only one fact but it might be also not the correct prediction as it is an analysis from historical data. Ergo, as a trader and investor in the crypto market, we must be aware that, there is no perfect indictor exists and the use of several indicators must be accompanied by other technical analysis tools in order to obtain an accurate trading decision.
As an example, use Relative Strength Index (RSI) Indicator complemented with another indicator, hence it may give more accurate trading decision.
Also, traders must be keen to select a proper combination of indicators to reduce the loss of a trading coz, the wrong combination of indicators may lead to obtaining wrong interpretation.
c) Explain how an investor can increase the success rate of a technical indicator signal
The success rate of technical indicators varies from trader to trader and also depends upon several elements.
1) Timing
After making a trading signal using some technical indicator, the investor needs to wait until the signal will appear to execute the trade. Hence investors can increase the success rate of that technical indicator signal.
2) Correct application of indicators
When applying technical indicators to make trading decisions trader needs to be keen about different indicators are having its own unique parameters which contribute to function it properly.
Also, traders must be aware to select the correct combination of indicators together to function.
Thereby traders can increase the success rate of used technical indicators.
For example, Parabolic Sar can be combined with a Stochastic Oscillator to recognize the uptrend and downtrend of a certain asset.
3)Experience of the user
If the trader or the investor is quite having many more experiences regarding handling those will obviously lead to increasing the success rate of a technical indicator, rather than a newcomer who learns to trade with the help of technical indicators.
4)Crypto market condition
When if a trader executes a trade at the correct time in the crypto market, definitely he/she can obtain good results from that trade.
Ergo, if a trader can use technical indicators to make an easy and comfy trade in a positive market atmosphere, obviously can gain more profit from that trade and thereby can increase the success rate of that technical indicator.
Conclusion
Technical indicators are forceful tools in the crypto market that helps to predict the price movement of an asset.
Anyhow, a trader must be responsible to select the right combination of technical indicators to make a trading decision coz a single technical indicator is not accurate totally on their own.
Thereby success rate of an operation can be maximized.
The use of technical indicators helps to gain more profits and to reduce risks in trading.

GOOD LUCK AND HAVE A NICE DAY!!
- My achievement 01 post: here.
- My achievement 02 post: here.
- My achievement 03 post: here.
- My achievement 04 post: here.

.jpeg)
.jpeg)
.jpeg)

.jpeg)
.jpeg)
.jpeg)


Hello @a-lass-wonders, I’m glad you participated in the 2nd week Season 4 of the Beginner’s class at the Steemit Crypto Academy. Your grades in this task are as follows:
Observations:
The Configuration done on your post was on the chart not on the indicator.
Recommendation/Feedbacks:
Thank you for completing your homework task.
Downvoting a post can decrease pending rewards and make it less visible. Common reasons:
Submit
Thank you so much professor for evaluating my homework task and obviously try to do my best next time.
Downvoting a post can decrease pending rewards and make it less visible. Common reasons:
Submit