Hello everyone how are you all doing? I hope fine. I warmly welcome you to the second week of the 5th season. This is my first Intermediate course of this season.
Thank you, professor @pelon53 , for this insightful explanation of Metric Indicators My homework is listed below.
In this lecture by Professor @pelon53 , we learned the basics of Indicators, including PUELL MULTIPLE INDICATOR, HASH RATE INDICATOR, STOCK TO FLOW INDICATOR.

This picture is edited by my mobile's default app

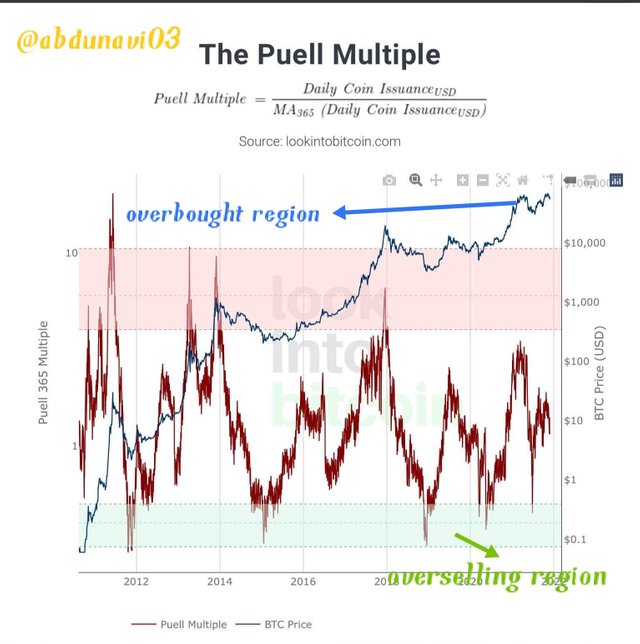
Puell multiple indicators is used as an indicator for the miners. Miners use it to identify the right spot to cash their earned bitcoins or any other cryptocurrency. So how does it work? It works by analyzing the supply of the cryptocurrency economy. Its calculation is obtained by dividing the value of the daily issued currency in USD by the average the yearly period
That is Puells multiple=daily currency issue/yearly MA
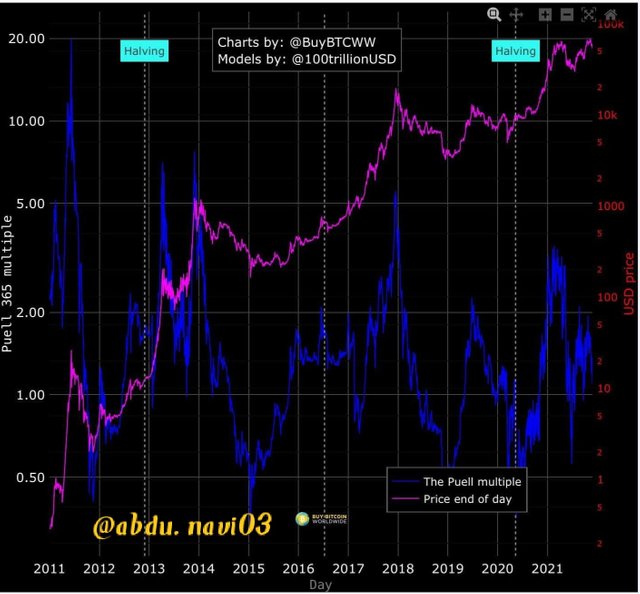
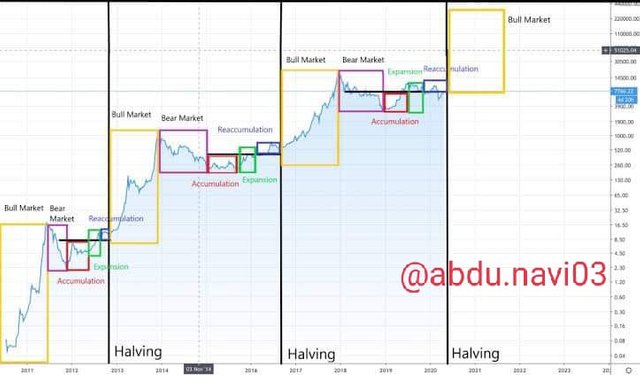
It associates with the process of halving
HALVING is the process in which the reward of miners halved after the total supply of a cryptocurrency halved. That means if 10 million of a supply is present with 100 coins reward, the reward on that currency will become 50 when 5 million of supply remains
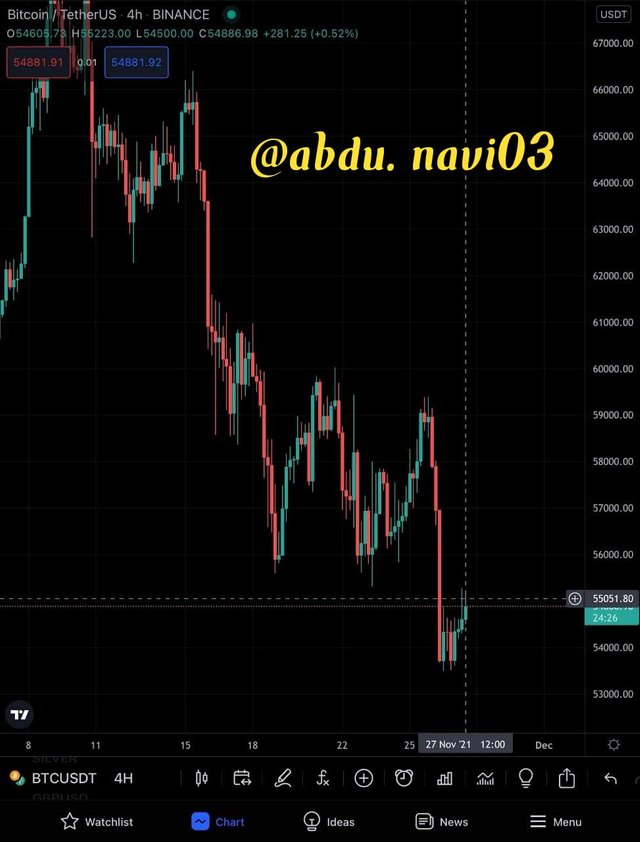
The current value of Puells multiple of Bitcoin is near 1. Which is asking miners to hold their bitcoins and do not sell. Meanwhile, for traders it is buying zone because of the recent dip in the market
The last halving occurred in 2020 and the next will occur in around 2024 according to chart
We can predict the overbought and oversold zone easily by Puells multiple indicators. These zones to know is important whether as a trader or as a miner
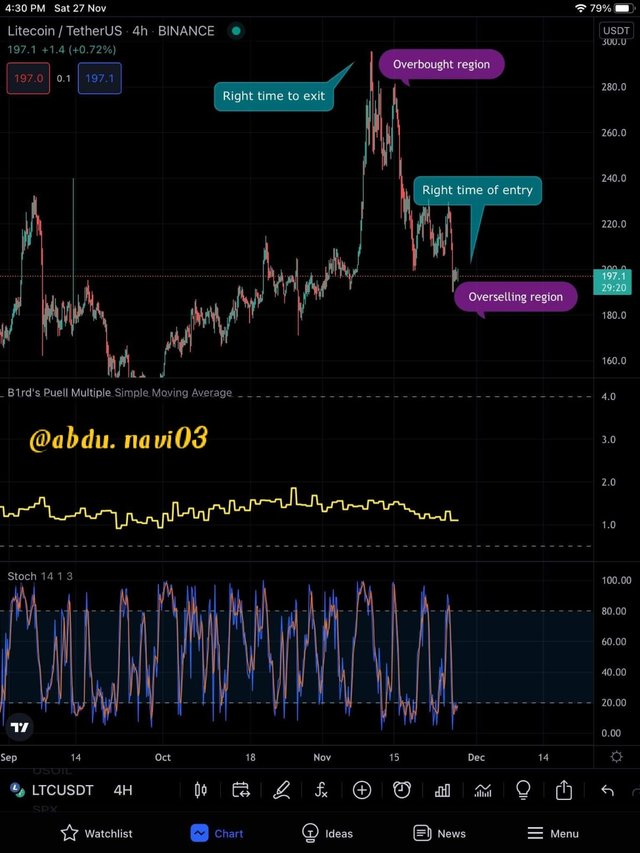
Let's] see a chart of Litecoin and predict its a chart
Here in this screenshot, I'm using two indicators as we shouldn't depend on one indicator. By these two indicators, we can clearly see that it is in the oversold zone as its stochastic oscillator is less than 20 and Puells multiple indicators are near one. It is going to make a big correction in the near future so it's clearly the best zone for a trader but a miner must hold them

Halving is a process in which the reward of miners is halved after the total supply of a cryptocurrency is halved. That means if 10 million of supply is being mined with the reward of 100 coins per block, the reward on that currency will become 50 when 5 million of supply remains
Miners mine blocks and get coins as a reward by Puells multiple indicators they can use their currency at the right time
Recently in 2020 bitcoin halved and reward became 6.25 from 12.5, the available supply of bitcoin is 18.9 million right now. The next halving will be in 2024 approximately when the reward will become 3.125 Bitcoin

Hash rate indicator identifies the computational operations that can be run by a miner or in other words, it identifies the capacity of a miner's devices to compute puzzles. The computational power is consumed to solve cryptographic puzzles. In the case of big coins like bitcoin and Ethereum large amount of computational power is required,the more computational power the more a miner can mine.
High computational power also provides security to the network. The more secure network is when more amount of computational power is needed to solve a cryptographic puzzle
But it's very hard to get equipment or computer to produce this much amount of computational power
In the early days, bitcoin can be mined by a simple computer but it's impossible to mine by it Because more miners enter the market after seeing such an incredible bull of bitcoin in recent years. This makes the puzzles hard and to mine a block at the same time one needs a computer with more computational power
However, the exact accurate number of hash rate is impossible to know with certainty but we can know the correct number of hash rate
We can see the current hash rate value of the Ethereum network is 810.8, which indicates that right now it's not possible to mine Ethereum with a simple computer, and one needs high performing computer. Secondly, it's also indicating that in the future it would be much harder to mine Ethereum by present computers. This shows the security and miners' interests in the Ethereum blockchain network. And it's the future also like bitcoin

The stock to flow model is used to determine that whether natural recourse or any recourse that is finite are abundant or scarce
The stock to flow or stock overflow is used to determine how many new coins will enter the market of a certain cryptocurrency
Today's computational power that's needed to mine bitcoin shows that not only it's expensive to mine bitcoin but it's also a scarce product therefore by its scarcity if you want to mine remaining Bitcoin you need high computational power
Stock = Reserved quantity
Flow = Annual production
As of today 27th of November 2021 stock of Bitcoin is 18,884,662
However
Flow = BTC rewarded per block/ block mined annually
Today BTC rewarded per block is 6.25BTC
That means 52,560 BTC per anum
Flow= 6.25/52560
Flow = 328,500
SF = Stock/ Flow
SF = 18,884,662/328,500
SF = 57.48
Now the current value of Stock to flow, model, is
Stock to flow model =0.4 * SF ^3
Stock to flow model = 0.4 * 57.48 ^3
Stock to flow = 75,964
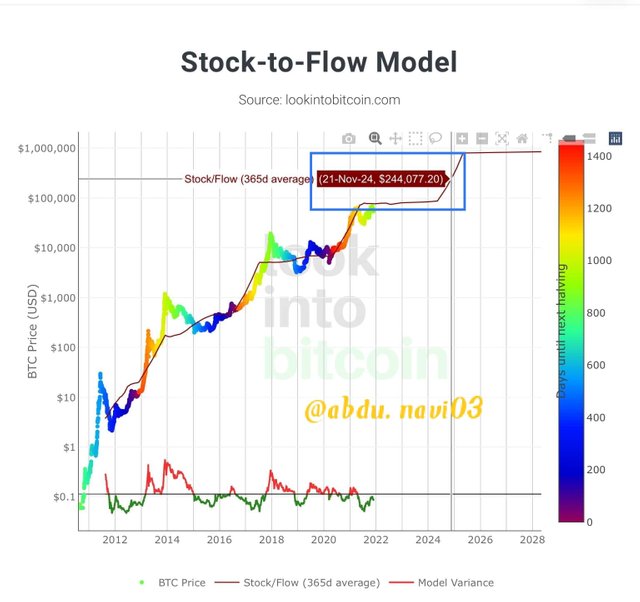
As we can see today's price of Bitcoin is lower than the Stock flow model value
As stock to flow, model is in inverse proportion with the /flow, therefore, we will have less number in the flow of Bitcoin in next halving when the reward will become 3.125BTC
As
Stock flow=1/flow
STOCK TO FLOW MODEL FOR 2024
In the next halving stock of BTC must be 19,537,325BTCs
So now
SF = 19,537,325/3.125 * 52,560
SF = 118.95
Stock flow or SF by 2024 must be at 118.95 at next halving
Then the stock to flow model will be
Stock to flow model = 0.4 * 118.96^3
Stock to flow model = 673,214BTC price

The Puell Multiple indicators have proven to be very useful in the crypto market, as they can assist traders in determining the best way in which to execute a trade and the Hash rate indicator can also tell us the number of people making their way in crypto coin mining, which we can use to take a position with, in a scenario where we can make a move whenever we see the Hash signal forming up and avoid making a move when the hash signal is not forming up.
As the SF ratio is the proportion of availability to the current flow of the market, the Bitcoin Stock Flow also tells us what position bitcoin will take next.
In the end, I would like to thank, professor @pelon53 because of whom we came to know about the different types of indicators. I hope I was able to meet all the objectives of this task as I put in all my efforts. So this is the end of my assignment. I hope you were able to grasp the basics of my lecture.
THANK YOU.
ps: All screenshots are taken from www.tradingview.com all the pictures have been sourced accordingly. The grammar was checked from grammarly.com while the markdowns have been done according to the Markdown Styling Guide.
Cc;
professor @pelon53
regards,
@abdu.navi03

