Greetings everyone. It is another great week of the steemit crypto academy season 3 and I'm here to present my homework task on the great lecture "Market Structure Break Strategy To Trade Reversals" thought by professor @cryptokraze.

Question 1
Market structure is simply the graphical representation of price development of crypto assets in a manner, may it be uptrend, downtrend or sideways organized to communicate meaning as to supply openings for investors to capitalize on.
Cost of an asset can either go up or go down or stay in a specific range for a few period of time. The cost movement in any of these bearings isn't settled. It keeps on changing which suggests an asset which experiences bullish slant will not proceed to stay bullish.
Additionally an asset which experiences bearish drift may not proceed to stay bearish. Whether the cost of an asset rise or fall, it does not happen straightly but it happens in particular manner.
Again, with the dynamic movement of crypto assets forms price-points with regards to the relation between investors which also leads to the creation of support and resistance levels.
The price of crypto assets normally follows any of the three ways;
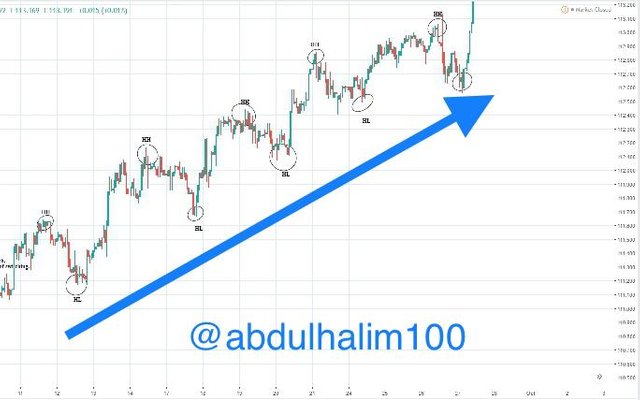
Uptrend Market Structure: This form of market structure is basically a representation of price movement of crypto assets upwards (bullish). With the waveform movement of the market it creates highs and lows the current high moving higher than the initial high. This creates the uptrend movement of price of crypto assets.
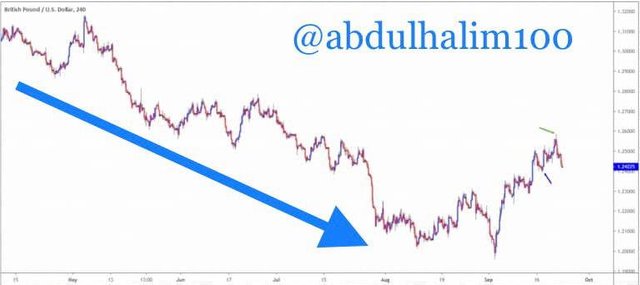
Downtrend Market Structure: The downtrend market structure is also a representation of price movement of cryoto assets downwards (Bearish). It creates consistent lows and highs with the current low moving lower than the initial low, this creates downtrend movement of the price of crypto assets.
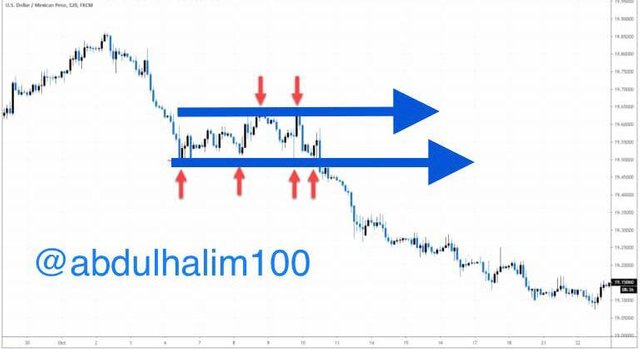
Sideway Market Structure: It is the representation of price movement of cryoto assets within a characterized range of price. Price creates resistance and support range and trades within the range until sometime.

Question 2
The price movement of crypto assets in a wave-like form creates a significant points which brings about the market structure and the fundamentals of support and resistance levels. It again gives a clear picture on the trend of the market for investors to utilize on.
The higher high and higher low is always associated with an uptrend ( Bullish Trend) and a lower high and lower low is associated with a downtrend ( Bearish Trend). Below are what these terms are;
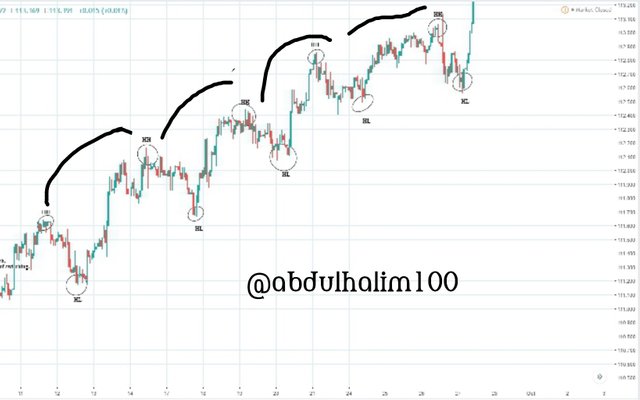
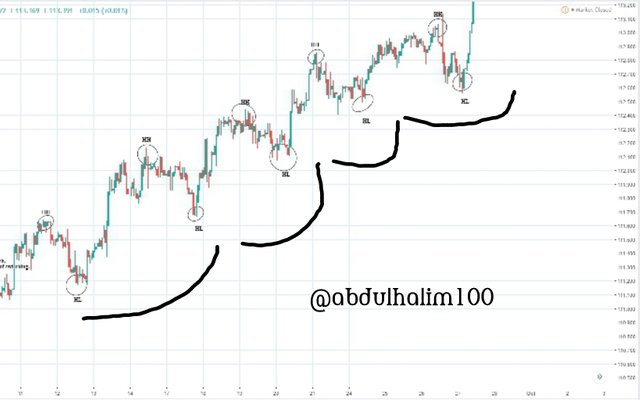
Higher High: A higher-high is an uptrend sort of advertise structure shaped from the swing movement of price making a high that's higher than the past high made. This approves the upward movement of price, hence making an uptrend.
As an investor, you have to have in mind that the new high formed should always be higher than the previous high to prevent fakeout and false price action signs. It doesn't form a higher high point if the current high isn't higher than the previous high. Below is a chart showing a higher high market trend.
Higher Low: With the higher low uptrend type it is formed at the low points of an uptrend. Since the market movement is a wave-like form, it creates low points. The higher low is defined by the current higher low being higher than the previous low. Higher lows also indicates the start of an uptrend, forming at the bottom of a downtrend.
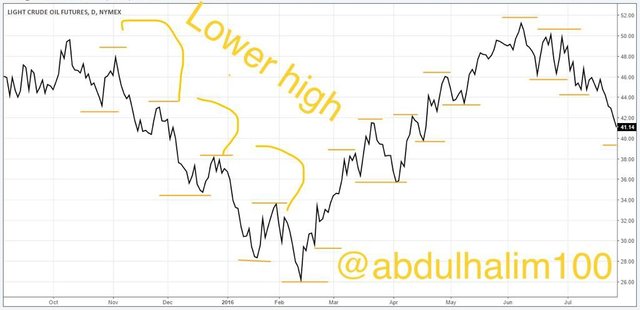
Lower High: Lower high is a downtrend type formed from the dynamic movement of price creating a high that is lower than the previous high formed. Lower high when formed at the top of an uptrend hints the start of a downtrend causing a shift in market sentiment.
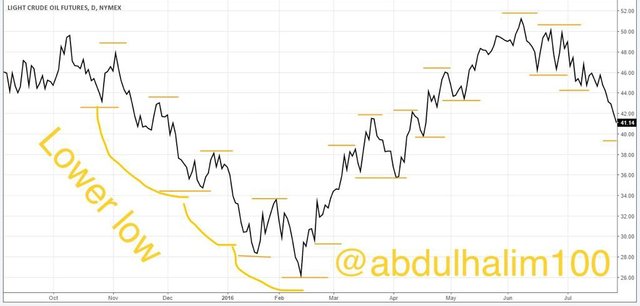
Lower Low: Lower Low is a type of downtrend formed from the dynamic movement of price creating a low that is lower than the previous. This validates a downward movement of price thus, creating a downtrend. For it to be considered as a lower low and to prevent fakeout and false price action signs, the new low should be lower than the previous low always.

Question 3
To begin with, I will clarify what is trend reversal at that point to be able to easily recognize that trend reversal is the alter within the price movement from upward to downward or the other way round.
It implies when an investor alter his intellect to buying goods and offering goods, so at that point the market will be in descending to upward patterns or vice versa, so this procedure is known as Trend Reversal.
If we have the fundamental information approximately higher low and lower high market structure strategies at that point we are going effortlessly discover the slant inversion utilizing showcase breakdown structure.
Identifying Uptrend Reversal Early: In this circumstance, the market goes to an upward trend but abruptly makes a reversal trend, and after that and the market begins to move in a descending trend.
To identify Uptrend Inversion we have to discover the back or neck area additionally we got to see the arrangement of a lower high and a lower low at the best of an upward trend. When the neck area break at that point it'll go within the upward reversal trend. So to recognize this trend we ought to spot the breakage of the neck area.
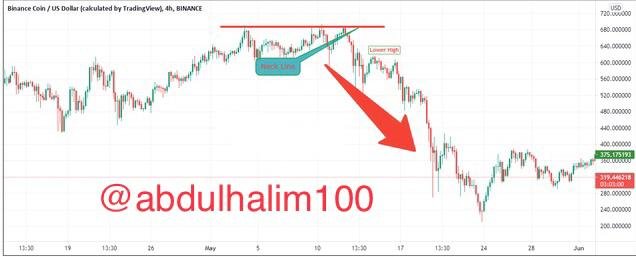
If we see that indication in a candlestick pattern then we can consider it as market taking correction and then go for Downtrend.
Identifying Downtrend Reversal: Early trend reversal in a downtrend is identified with the formation of a higher low and higher at the bottom of a downtrend. The break of the previous lower high point confirms the transition of the market structure from a downtrend to an uptrend.
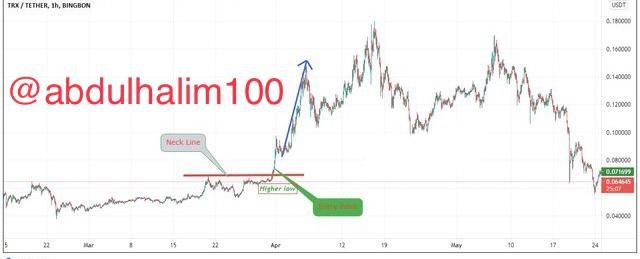
In this situation, we get string identification about market breakout in an upward direction. This means the Market go in an upward direction.

Question 4
There are 4 entry and exit criteria in the market structure. All these is characterized on higher highs, lower lows, higher low and lower high. Below are the 4 entry and exit criteria in the market structure;
Buy Entry point: The needed criteria for a buy condition using the market structure break strategy include:
1. The market should be in a clear downtrend, creating lower Highs and lower lows.
2. Now check the price movement, it should make a Higher Low after a series of Lower Lows.
3. A clear bullish candle breaking and close above the previous Lower high point, thus breaking resistance.
4. Now, you can take the Buy Trade where your entry price is just above the market structure break point.
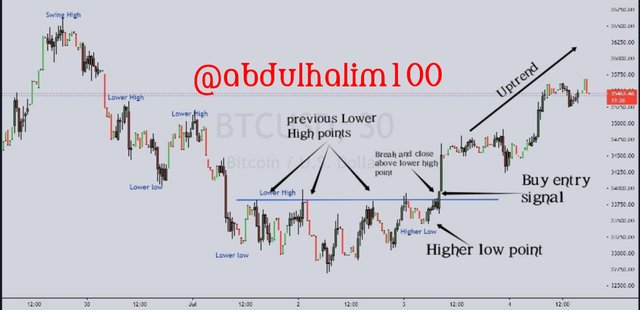
Sell Entry point: The required criteria for a sell condition using the market structure break strategy include;
1. Market price movement should be in uptrend possibly for short term. I will prefer 1 hour time frame as it is easy to understand candlesticks and the market should be in a clear uptrend as well.
2. A clear Lower high should be formed. In a sense that, after series of higher high price should make lower high which means price is high but lower then previous high.
3. A bearish candle should break and close below the previous higher low point, thus breaking support.
4. Now after breakout take sell entry trade just below the market structure break situation.
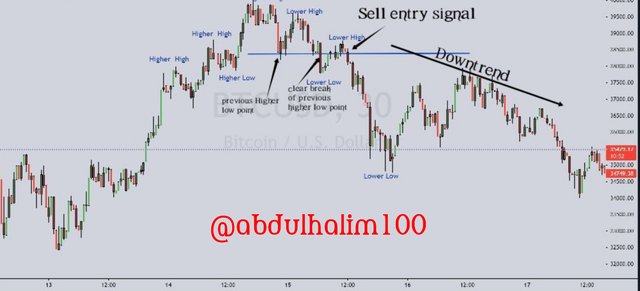
Exit point during Loss: We got to utilize stop loss to form our exchange more secure. As there may be chances of cost flactuation which may make a gigantic misfortune for a dealer like us. So its way better to supply a culminate stop loss to secure our exchange from misfortune. In market structure methodology we are going put two diverse halt misfortunes at two distinctive circumstances.
Stoploss Hit: This is a predetermined price that is set to protect the traders' capital when the trade idea goes in the opposite direction.
Exit point during profit.
Principles
1. The trade should have a Stoploss.
2. The stoploss should be placed slightly below the lower low point in a buy trade scenario.
3. The Stoploss show be placed slightly above the lower high point in a sell scenario.
Profit Hit: The take-profit price is a predetermined price that is set in the direction of the trade to make a profit.
Principles
1. A trade should have a take-profit price.
2. The take profit should be a minimum of 1:1 Risk to reward ratio.
3. Take profit should be put market
In some circumstance if the price cross take benefit it is essentially make our exchange productive and able to take out exit and hold up for following same set up for exchanging. Its completely depend on an investor that on what proportion an investor need to apply benefit and stop misfortune. That proportion is known as R:R that's Risk: Reward.

Question 5
With this question I will be showing how a crypto asset, where I will tell you where to place the buy order and where to place sell orders to take maximum profits and avoid losses
1. I used the 1 hour chart of ADA/USDT for this demonstration.
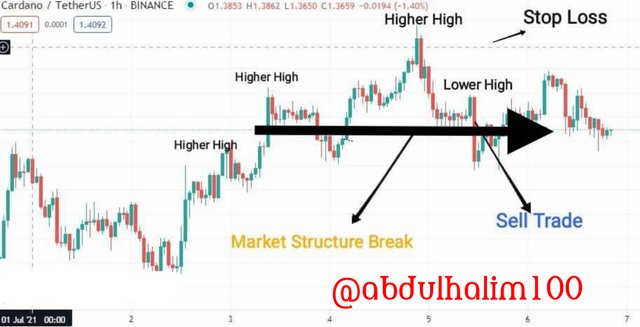
With the second demonstration.
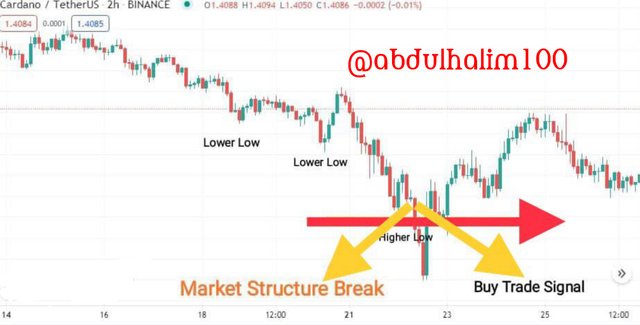
Within the above screenshots you'll be able see that when putting the purchase order you take the neckline into consideration and put the exchange fair over the neckline after a higher low.
Whereas when putting a sell order you ought to wait for the bull market to have a trend inversion which you'll be able watch after you make a neckline whereas watching a lower high. When the price breaks the neckline and begins moving in a descending heading it could be a great time to put a offer order.

In conclusion, a legitimate understanding of market structure progresses the chart involvement of an investor, it is the dialect of the chart and ought to be legitimately caught on by investors. A break of market structure hints at possible trend reversal for traders to capitalize on.
Moreover, without using any indicator we can do profitable trades using Market Structure Breakout Strategy. This makes it very necessary for all investors to get the understanding of what a market structure breakout is.
Thank you for going through my post.