


You are welcome my dear steemians. This is a homework task about the zig zag indicator and how to utilize this trading tool in carrying out your day to day trading activities as a cryptocurrency trader. Without much waste of time, I have compiled this task into headings situated as questions given by my professor @kouba01. Let’s ride on.


In order to identify the current trend of an asset in the financial markets traders will pay attention to the price action of that asset and most of the time they use indicator tools to identify such moves. Be it a bull run, bear run or a consolidation market, the indicator tools give vital information about the price action of the market of an asset. In this case the zig zag indicator can also be utilize for price action analysis.
The zig zag indicator is a basic fundamental indicator used to know or detect when the price action of an asset gives a reversal signal. This indicator ease the process of identifying support and resistance levels such that the trader has no stress upon detecting this criteria on a price chart when the zig zag indicator is added to the chart. The support and resistance areas stands as a fundamental step to a successful trade analysis. Any breakout from the support and resistance levels is identified and gives the trader an advantage over the market.
Using the zig zag indicator requires the setting of a required price percentage movement. Mostly the default percentage value already set is 5% which when used means that only price fluctuations of 5% and above will show on the price chart. This filters the noise and eliminates swings allowing the trader to see clearer. When using the candlestick chart, the closing prices are used together with imaginary points which connects together and form the point connected as straight lines on the price chart showcasing information about the zig zag indicator’s support and resistance lines.
The zig zag indicator like some indicators produce data based on past the price history of the asset. Therefore this is a productive indicator when it comes to analysis of the price action history of an asset. Despite the unpredictive nature of the zigzag indicator, it’s still widely used together with tools like the Elliott wave counts. Fibonacci retracement lines can be drawn using the historical data product from the zig zag indicator.
This indicator prevents the complexity given by random price fluctuations as it provides a unique and ideal trend peaks and troughs. It is used to identify changes on the price charts as well as determine trend directions. How it lowers the noise level gives it an added advantage in carrying out analysis for trend determination. This indicator is seen to work better in a strong market trend.
The calculation of the zig zag indicator is done based on the type of chart it’s placed on. This calculation can be done in a series of steps.
Assign a starting point (a swing low or swing high)
Assign the percentage movement
Note the next swing low or swing high which is different from the starting point.
Draw a trend line from the start to the end
Identify the next swing low or swing high different from the new point.
Draw trendline
Repeat to recent swing high and swing low
On different charts this indicator is interpreted the same but with a unique response. For example, working on a line chart will only give the preference to the closing price since this chart is represented by a line describing the open and close. For other charts such as candlestick charts the zig zag calculation is the record of minimum/maximum.
Since the zig zag indicator is built to focus on past price movement, the last or current price point is in constant change. As this point is in constant change, the movement could change at any point in time. Therefore we do not take into consideration the last point on our zig zag indicator when taking vital information for analysis because this point is in constant change and represents the moving price.


The zig zag indicator can be customized during the process of adding the indicator on your price chart for analysis. When you click the indicator button in tradingview.com and type on the indicatorsearch box “zig zag”, you will add the zig zag indicator to your chart by just clicking once. When this has been done, you can now customize the following elements of the indicator to suit your desired measures. Before describing these parameters I will like to show in a few steps with the aid of screenshots, how you can practically add this indicator to your chart.
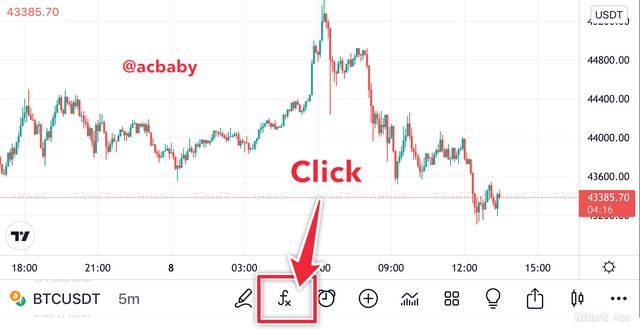
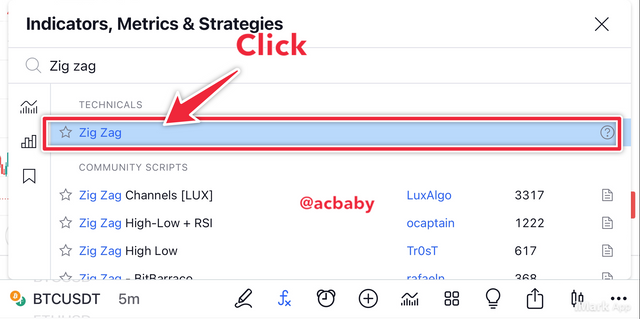
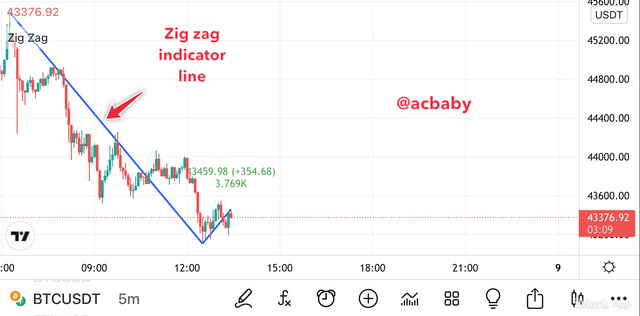
This is the measure of the minimum price change having a maximum/minimum from the former minimum/maximum in order to identify new peaks on the zig zag indicator. This is mostly at a default of 5% but can be edited by the trader.
The depth represents the smallest distance through which the indicator can not represent a new maximum/minimum different from the former one. This is usually set at 10 which is a value equal to the deviation.
To configure the zig zag indicator will depend on the trader’s idea about this indicator. Some traders may consider changing all the default setting while others prefer to change only the depth parameter of the default setting. To avoid having complex zig zag trends you have to customize the depth such that it’s not too low. This is to avoid so much breaks on the price chart aloft the zig zag line. By doing this you will avoid the noise that can be generated by the numerous unreliable reversals indicated from the zig zag line.
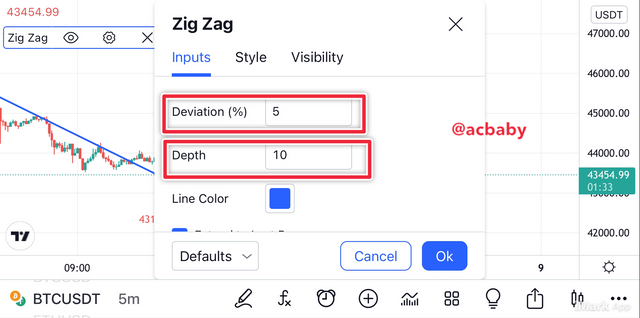
When we avoid the use of very low depths we should also avoid using too high depths as they may cause the zig zag indicator to become insensitive to satisfy our desire in using the tool in the first place. A bit of using such high depths will cause the indicator to stay silent on very important data even though it prevents noise, it will end up not giving the right information at the right time.
Setting up your zig zag indicator parameter is a delicate task and so will require that the trader takes a good look at the market and determines market behavior and structure.
It is good to change the default setting in order to make the indicator work on your paste. This also let you reduce the noise level and increase sensitivity when you configure it as recommended above.


The zig zag indicator is used most of the time to identify trends and changes expressed on the price charts of assets. The said zig zag lines will appear whenever there’s moving of prices between the swing highs and lows that can be indicated from the configuration percentages. Therefore traders will mostly use this indicator to identify trends (bullish and bearish trends) in the market or where the asset trades in a consolidation. Generally, when prices trades with higher highs and higher lows it’s said to be in a bullish price harmony while when prices trades with lower highs and lower lows we know of a bearish price harmony. The same goes for the zig zag indicator.
Whenever the zig zag line makes continuous higher peaks and higher troughs, we know that we have a bullish trend. When the price trades and the zig zag indicator line shows lower peaks and lower troughs we know that we have a bearish trend in progress unless otherwise it is broken.
To take any position upon trend identification the trader has to wait until price harmony is broken. That’s if the higher highs and higher lows stop and interchange course then you can place a sell trade in such situations. I will put this in two points below.
Take a long position whenever the new low is seen higher than the previous low. This simply indicates a possible reversal in the case of a previous down trend.
Take a short position whenever a new high becomes lower than the previous high. This indicates that the bulls no longer have power over the market and so there will be a possible bear take over and a sell trade will give you profits.
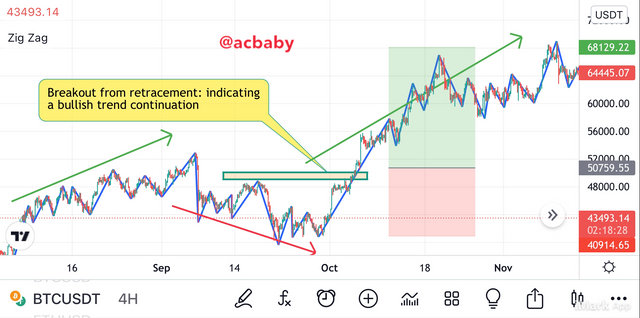
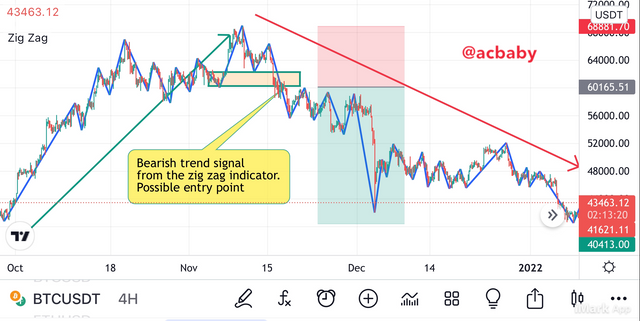


Even though traders know that the zig zag indicator only states price history, they also use it to identify resistance and support levels on the chart which is plotted between the swing highs and lows. This can be used to detect reversals and breakouts from the support or resistance levels and provide predictive information to the trader. When a set of highs on the zig zag indicator are on a particular price , they form a resistance level and when there’s an assemblage of lows at a particular price, they form a support level. These prices act as a floor or roof where the people's rice bounces back to the other side on the chart.
Once a trader plots the support and resistance levels of the chart using the zig zag indicator it is easier to trade a ranging market or on a particular trend. Upon breakouts a better position can be taken with a good size. Just like other trading strategies it is good to wait for the support or resistance levels to be met in order to work well and make good profits. The screenshots below describe support and resistance identification using the zig zag indicator.
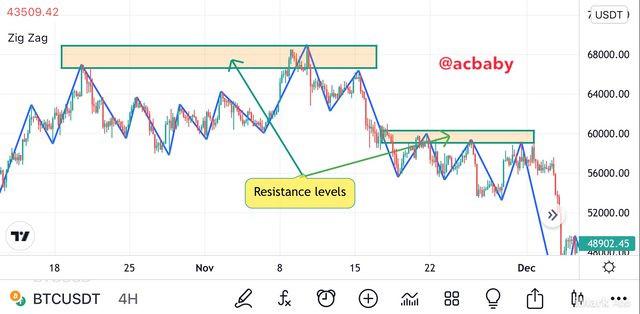
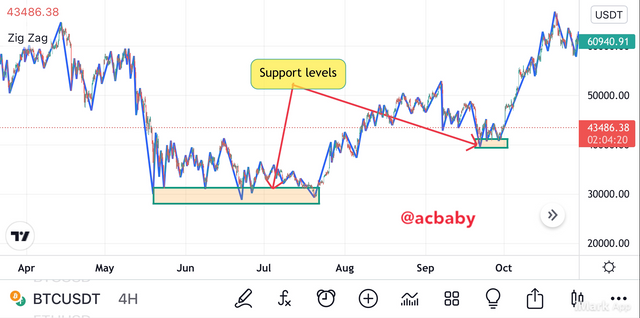


The CCI indicator was created to utilize spot long term trend changes but today most traders have harnessed it into the intraday trading models such that the indicator has been used for all time frames. This indicator is there to compare the average price in a specific time period such that it gives buy/sell signals just like indicators like RSI will give. The CCI indicator has a zero level and it fluctuates above and below this level to identify buying and selling opportunities.
The zig zag indicator together with the CCI indicator will provide good results to a trader such that trading will be made profitable.
Now signals will be gotten when the zig zag indicator provides the same prediction as the CCI indicator. This means that while the zig zag indicator tells us about a bullish breakout, the CCI indicator should be giving us a buy long signal.
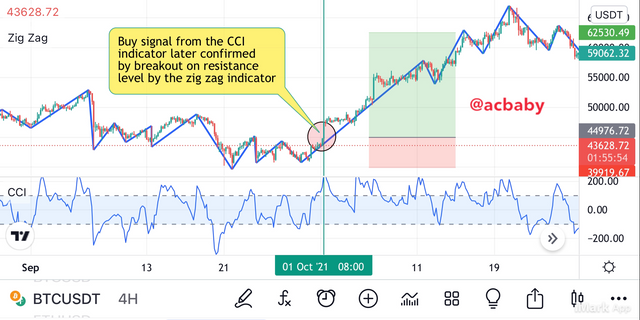
For a buy signal, this is gotten when the new zig zag point breaks the previous maximum and the CCI indicator exceeds the 100 level.
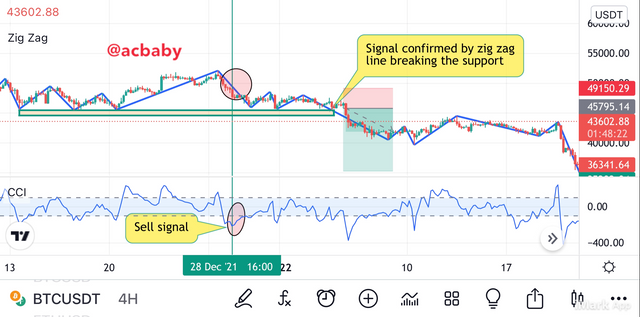
For a sell signal, we receive this when there’s a breakout seen from the new point lower than the previous minimum on the zig zag indicator and the CCI indicator is below the negative 100 level.
In the above situations we place a buy/sell trade respecting the criteria in order not to miss the trading opportunity the markets bring while we utilise these indicators.


The zig zag indicator like the rest, has the possibility of giving false signals which are seen in situations where the can be a breakout which may later fall in line with the previous trend and hence placing a trading solely depending on the breakout will cause the trader to loss funds. To solve such problems one has to pair the zig zag indicator with different indicators in order to filter the noise and use only true breakouts as confirmed by the second indicator(s). We have seen how the CCi indicator can be used with the zig zag indicator on the previous section but here I will describe how to use the zig zag indicator with other indicators to filter noise from the market.
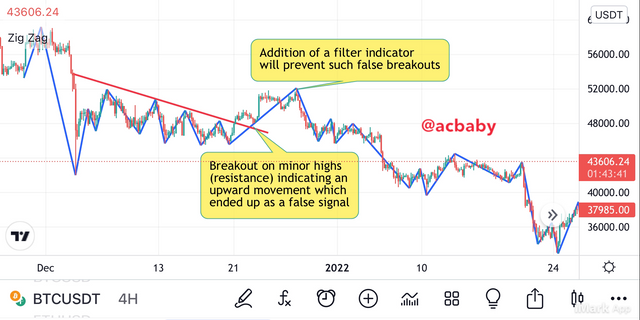
A good combination can be seen from the combination of the zig zag indicator with the EMA tool. Both tools used in confluence will provide a great deal for analysis on an asset.
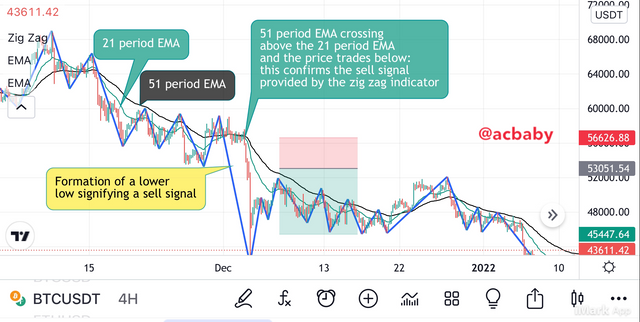
This combination is done by adding two EMA line of different periods to the zig zag indicator.
Upon any impulsive fluctuation change, it will be seen from the EMA lines such that following the rules of trading with EMAs will enable a trader to understand when to confirm a trend from the zig zag indicator.
I will use the 51 period EMA and the 21 period EMA added to a chart of BTCUSDT to analyze and filter false signals that can be gotten from the zig zag indicator. The screenshot below best describes this combination.
The above screenshot shows the combination of the Fibonacci retracement and the zig zag indicator on a price chart.
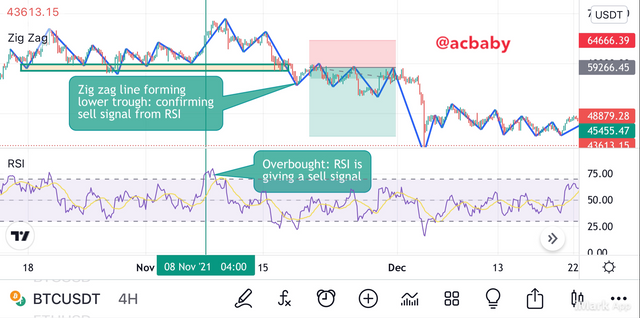
Another indicator that can be of good combination with the zig zag indicator is the Relative Strength Index indicator. This may also operate like the CCI indicator I explained above because they both have a zero level and highs and lows levels.
Once the RSI is added to the chart containing the zig zag indicator, you just apply the norms for the RSI indicator signals which says that the overbought region (80 levels) signals selling opportunities and the oversold region (20) signals buying opportunities. An entry will be made only when the RSI confirms the breakout signal from the zig zag indicator showing that all false signals have been filtered out and the one in mutual agreement from both indicators is the true breakout.


The zig zag indicator has a variety of advantages as it can be used for trend identification and also can be combined with other indicators to produce true signals. The same indicator can work well with the Fibonacci retracement and the Elliot waves trading criteria. Below is a tabular form through which I have highlighted some advantages of this indicator as well as it’s disadvantages.
| Advantages | Disadvantages |
|---|---|
| This indicator lowers the impact of price fluctuation and gives clear results | signals are based on past history which keeps the trader in a delicate position |
| Can be used on different timeframes | the trend majority may have already occurred |
| Plays a deluge t rule when used with Fibonacci retracement and Elliot waves | the zig zag line may not be permanent hence may produce false signals |
| Can be used in confluence with other indicators | signals are based on the indicator settings meaning all signals out of the range are hidden |
| Highlights significant trends on the chart | mostly limited to confirming trend directions |
| Best for strong trending markets | different traders may interpret the same information differently. |


Zig zag indicators like other trend-following indicators can be used to identify past market action activity which may aid in understanding the market future. This indicator can be used to detect the change in trend whenever there’s to be a reversal and also it can be used to easily locate the support and resistance levels in the market for a particular asset. With the ability to filter noise upon configuration, the zigzag indicator can easily give the most significant signal from the price movement.
It can be used to cite a possible Elliot wave in formation and also can be used alongside the Fibonacci retracement levels for the detection of drastic changes in the price movement. The zig zag indicator alongside indicators such as the RSI and CCI can produce a far better signal for trading upon Confluence trading analysis.
A big thank you to my professor for such a wonderful lesson of the week.
All screenshots are taken from tradingview