


Hello friends and colleagues of the steemians Crypto academy. You are welcome to my homework post for professor @shemul21 for week 2 of this season. This lesson was about how to trade with moving averages. This task therefore stands to explain how one can use moving averages for trading analysis.


Moving Averages are a common group of tools working in almost the same manner but with different calculations to man up their subcategories. This class indicators are widely used in the technical analysis world of the financial markets. When cryptocurrency pairs trades, they will continue to move in particular trends until an aspect hits the investors such that they change course. These indicators are capable of giving the trader the upper hand of sensing the market move before it happens. These indicators plays a vital role in identifying price trends and therefore can determine the area on the chart that’s good for an entry in any market structure.
The moving average as the name says it is an average of the price at a particular distance on the price chart. This makes the moving average indicators to be a direct representation of the price at any point in time. In this light we can use the moving average indicators to identify trend, trend reversals, and good entry points on the price chart. With such indicators we can know the trend of the market without the market already passing sweet entry points.
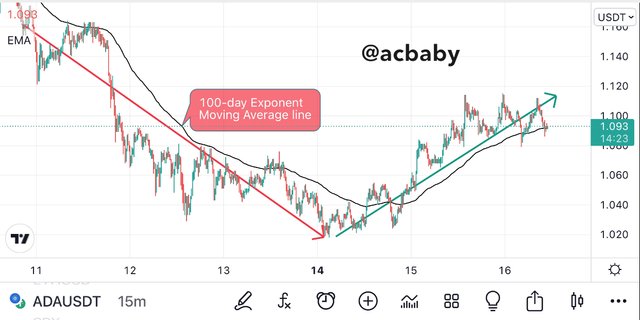
This group of indicators are configured indifferent periods such that within one moving average indicator you can set different periods. When we use high periods such as the 51-day moving average of anatomy of the subcategories, we keenly observe the price chart. If the price is above this moving average line we know that we have a bullish market and the buying pressure is higher. If we still have our price trading below this moving average line therefore we are in a bearish market with a strong selling pressure with respect to this period scale. So when we configure our moving average period it forms a line that moves on the chart such that it may oscillate with the price crossing it at different intervals. These moving averages can be applied to more than one on a chart provided the trader knows what they are looking for on the chart. But the common idea is that when the higher period moving average is above the price chart then the bearish momentum is stronger and the opposite of this situation is true for a bullish momentum.


The moving averages like I said are a group of indicators with almost the same form of operation but with different calculations. All these indicators calculate the average price movement of candlesticks depending on the number of candlesticks the trader prefers to set the period on. This calculation can be done such that we have exponential evaluation, simple evaluation, and weighted evaluation which all will form the different subcategories of the moving average indicator.
Moving averages have been subcategorized into the Exponential Moving Average (EMA), the Simple Moving Average (SMA), and the Weighted Moving Average (WMA). I will describe these categories individually so we can grasp the idea behind each.
The simple moving average (SMA) is the moving average category that is based on the calculations of average price of the cryptocurrency pair measured between a number of candlesticks. This moving average displays the average price of a trading pair in the form of a dynamic line across the chart from left to right. This can also be known as the true average of the price line of the asset without any extra mathematical manipulations to derive results. Therefore every single candlestick on the chart has influence in this indicator and so the formation of a candlestick will shift this average line to one direction at a time. Being the true average of the asset, it takes into consideration all the fluctuation of prices on the price chart and equally identifies all opposite movements.

Parameter description:
A = price/data in a given time period
n = time period (length)
**
The Exponential Moving Average is another category of the moving average indicators. This is quite almost the same as the SMA in that they all track the direction of price movement. So the EMA applies more complicated mathematical calculations to give it more credit to be able to detect the price change act. With this aspect of the EMA, it’s known to give a more precise information about price change as it is also represented by a dynamic line on the price chart. Therefore using the EMA will best provide signals on price fluctuations and possible price reversal on the chart. For an intraday trading analysis it’s beta to use the EMA since it provides great accuracy upon detecting price change. It can also be used to study for the long and short term change in the price movement. The calculative model is quite complex compared to the SMA and it can be seen below.
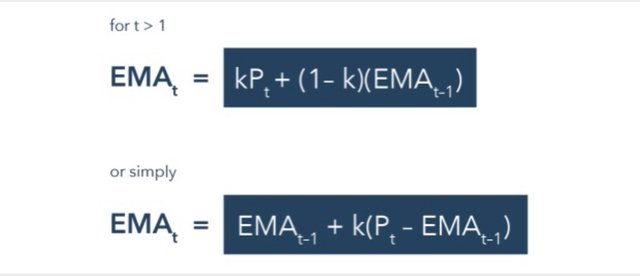
Parameter description:
k = smoothing parameter
The Weighted Moving Average is the name goes is the measure of the greater weight to recent price fluctuations. That is, the WMA provides information on the statistical measure of the greater weight to the recent price data and the less weight to the previous. It’s just like a ratio of the biggest to the smallest. This moving average indicator multiplies the price of each price bar to a common weighting factor on the current data. Mathematically, the sum of the weights will equal a hundred percent or if measured in ratio will equal one. The WMA is more descriptive compared to the way the SMA functions on the frequency of cryptocurrency pairs on the price chart. This is because the SMA takes all prices into consideration and is equal such that a single supper insignificant price will affect the average line movement while such will be silenced when dealing with WMA. The WMA can be calculated by the formula below.
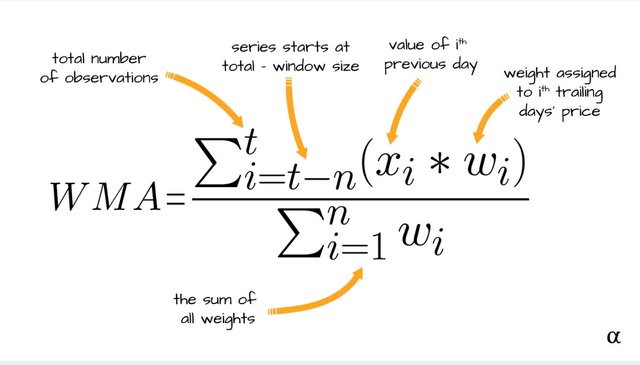
The different moving averages travel as lines on the price charts and all represent a certain average movement of the price depending on a number of highs and lows. Even though these indicators have a common activity, they have certain differences which I will describe on the table below.
| WMA | SMA | EMA |
|---|---|---|
| Very good when the recent data is the vital option | Good for long-term trading analysis | Easily identifies trend reversals with accuracy in the short term analysis table |
| WMAs are good in both higher and lower values (periods) | Mostly higher value SMA are considered valuable hence their nature to study long-term | Lower values EMAs are considered best hence their ability to study short-term |
| Only the most recent price is important for the WMA | The number of periods and the average number of periods are used in SMA determination | EMA calculations use today's values and the smoothing of these values. |
| The WMA subject itself to the importance of refusing data to the recent | SMA subjects the total average value over a certain length or period on the price chart | With the EMA only the recent data is given value to |


The moving averages sometimes act as support and or resistance levels on the price chart such that the price bounces back to its original course after hitting the MA line. In this case we can take the advayof making entries whenever the price hits the MA line provided that we have identified a trend with less volatility in the market such that breakouts will be seen clearly. The common of the different EMs on a particular chart will give the trader a lot of information about the price movement in the three basic moving terms. I will apply the 51-day period AM on all the three subcategories such that we have them on a single ETHUSDT chart.
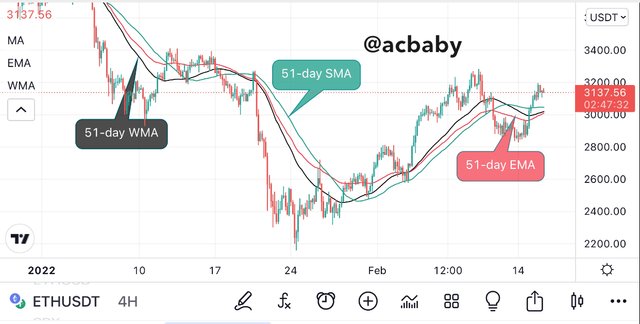
The above screenshot demonstrates the 50-day MA (in green), 50-day EMA (in red), and 50-day WMA (in black) on the ETHUSDT price chart. As we can see from the chart we have the SMA further away from the price while the EMA and WMA are closer to the price. When looked critically we see that the EMA forms a major and effective support on the chart while the WMA is more close to the chart compared to the EMA.
We can use the combination of any of these moving averages depending on the required analysis but all can be used to identify entry opportunities in the market. In this case I will use the EMA (21-day) and the SMA (100-day)
Like I said above, the moving averages can represent support and or resistance levels on the price chart such that they create an entry and exit criteria for a trader. When the moving average acts as a support level, we can make buy entries whenever the price is about to bounce on the support MA line. The rejection of price at such points is the success of our trade. Knowing that the SMA is mostly for long term analysis, we should know that when I apply the above SMA and EMA on a price chart the SMA should probably be far from the chart while the EMA acts as a support or resistance to the price depending on the current trend.
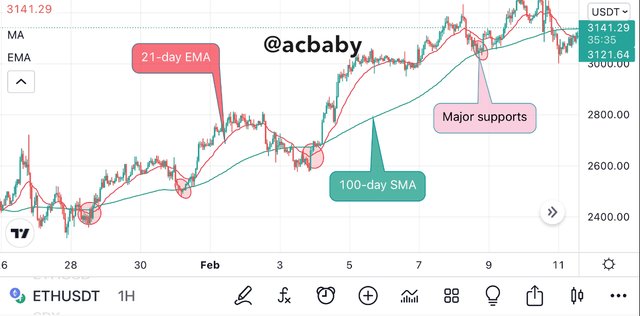
From the above screenshot we can see how the price is trading above the 100-day SMA and oscillating on the 21-day EMA such that the 21-day EMA forms immediate support levels and the SMA forms the major support levels. This already identifies the trend to be bullish and entries can be made whenever the price is above to bounce on the 100-day SMA and whenever the price slightly crosses the 21-day EMA we are assured that it’s heading for the major support so we can close open positions and wait for another entry opportunity close to the bounce back area. We can see that according to the chart above we have a potential to buy close to the 100-day SMA and we can exit when the price crosses the 21-day EMA or reaches back for the 100-day SMA such that we are still in profit.
However, in a more volatile market we can not have the price trading in a particular direction such that we can spot the price bouncing back from the resistance or support depending on the trend. In this case we have to use just one moving average such as the 21-day EMA so that when the price crosses this line we can identify a possible reversal signal. Another way is to use two different periods of the same moving averages (for example, using 21-day EMA and 51-day EMA) in the same price chart such that crossovers can be used as entry signals.
In this case I will use the 21-EMA on a volatile chart such that we see the crossovers clearly. The crossovers I’m talking about here is the price crossing the average line and not the case of two average lines crossing one another like I just said in the above paragraph.
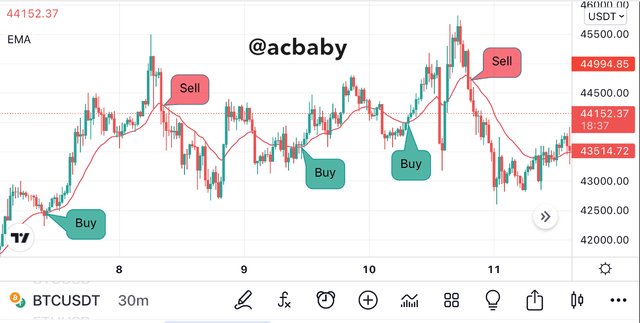
We can see on the screenshot how the 21-day EMA displays the buying and selling pressure in the market.
When the price breaks the 21-day EMA and heads above, we have high buying pressure hence a buy signal. On the other hand when the price breaks below the 21-day EMA we have a sell signal from the indicator. On the specific breakout or rebound areas in the chart we can see how the special candlestick characters are displayed on the chart.
The reversal signals are clearly shown where the price trades and breaks the 21-day EMA to the up or downside. Therefore I’m a ranging market. We can use this technique to get several entry opportunities on both market moves such that we can remain profitable. This is best used for intraday trading where several opportunities are brought to the trader.
With the effective application of this technique to your trading analysis, you already have high potential of a successful trading journey. It’s best to add filter tools when dealing with a single or just two indicators in order to avoid false signals. We could see areas on the last screenshot where the price broke through the 21-day EMA but reversed quite early to the opposite of the market.


The moving average crossover technique is different from the approach of the standard moving average combination technique. Here two moving averages are applied on a chart together with different periods such that one is higher than the other. A typical example is the application of the 21-day EMA and the 51-day EMA which I always use when carrying out my analysis together with some few indicators. The 21-day WMA is considered the faster EMA in this case because it moves on a smaller period compared to the 51-day EMA. The 21-day EMA will always be closer to the price movement while the 51- a little far away from the price itself. I will add these moving averages on the same chart and we can view how the smaller period is far from the candlesticks compared to the larger period moving average. The ETHUSDT price chart below best describes the indicators put together ok a chart.
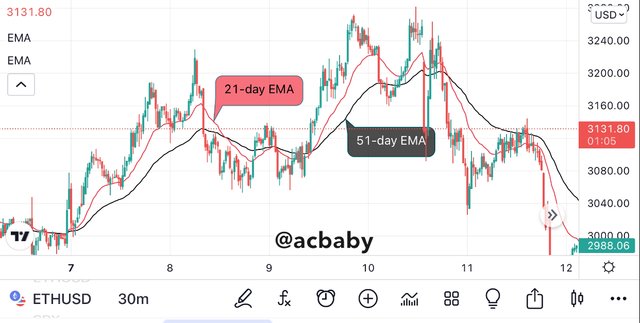
We can see the 21-day EMA very close to the candlesticks while the 51-day EMA tends to be further away. When these average lines cross each other it’s a good entry opportunity to open positions or close existing positions. Trading signals can be limited but very effective when applying this technique order crossovers.
The crossover technique is built on some rules to guide the trader on consideration of activities during this signal process. We can consider the following to be of effect when applying this technique on trading.
Whenever the short-term average line (e.g 21-day) crosses above the long-term average line (e.g 51-day), a buy entry opportunity surfaces on the market and we can open a long position. The same goes for a sell position but on the opposite side.
Whenever the short-term average line crosses the long-term moving average line to the south side, all long positions should be closed. The same goes for the sell trade but in the opposite direction.
I will use an ETHUSD price chart below to show how this entry and exit is done on the crossover technique of the moving average lines on a price chart.
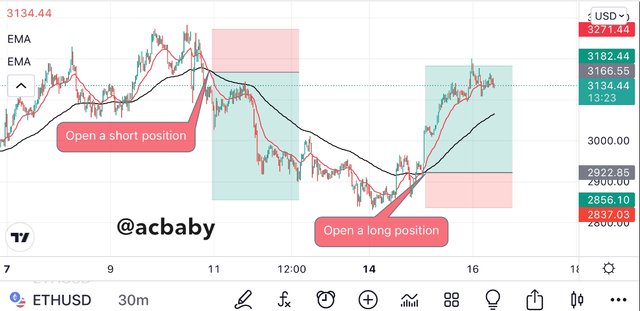
The ETHUSD price chart above shows the crossover of a 21-day EMA and 100-day EMA. We can see how the short position opportunity was open and the Long position opportunity later surfaced. At the opening of the long position all short positions should be closed.
I have used different combinations in this exercise but we should know that there are different types of combinations that are generally known to be famous amongst traders. These are listed below.
9-day EMA and 21-day EMA for short- term technical analysis.
25-day EMA and 50-day (or 21-day & 51-day EMAs) for mid-term trading analysis such as that which can take a few weeks
50-day EMA and 100-day EMA for long term analysis such as that for months
100-day EMA and 200-day EMA for long term analysis that make reach years
When the period of the average line increases the number of signals reduces and this gives room for the different terms of analyzing trades using this technique.


Indicators as good analytical tools in trading activities are also known to have limitations. The moving averages have their own limitations in effectiveness. Therefore this part of my task will emphasize on the limitations that d the moving average indicators.
The moving average only provides information based on what is happening on the price charts and doesn’t take into consideration what external forces affect the market price.
These indicators work based on the value inputs and therefore operating them can be confusing when choosing the length of the indicator.
The moving averages use past information of the market to give signals and as such they provide signals as lagging indicators would. They don’t predict or move ahead of the price.
Sometimes these moving averages indicators produce false signals such that they require filter indicators to assist them.
The current point of the average line can change to a different thing in a short time and this can be quite confusing to a trader. New price movement easily affects the indicators.
Crossovers can be faulty as the price can cross within seconds for a highly volatile market and return to the opposite side hence causing liquidity.
When there’s liquidity injection in the market the moving average cannot save a retail trader.


To buy low and sell high is the way of price action. If a trader wants to carry out trading analysis such that they can beat the whales by following them, they have to follow the trend of the market and trade according to the market trend. This can only be done while using trend following indicators like the moving average.there are different ways to calculate the three main types of moving average. Each moving average is best applicable in a particular term of analysis and quantification. The best moving average for intraday trades is the EMA. Analyzing the market with the moving averages is a good idea but a trader should always acknowledge the fact that these indicators can provide false signals and they require the trader to apply another indicator to act as a filter indicator to signals.