


Hello wonderful people of the Steemit platform. I welcome you to my homework task for professor @dilchamo for this season. I’m overwhelmed to talk to you about the line chart and how we can use it to carry out certain trading activities before placing profitable trades. Let’s ride on…..


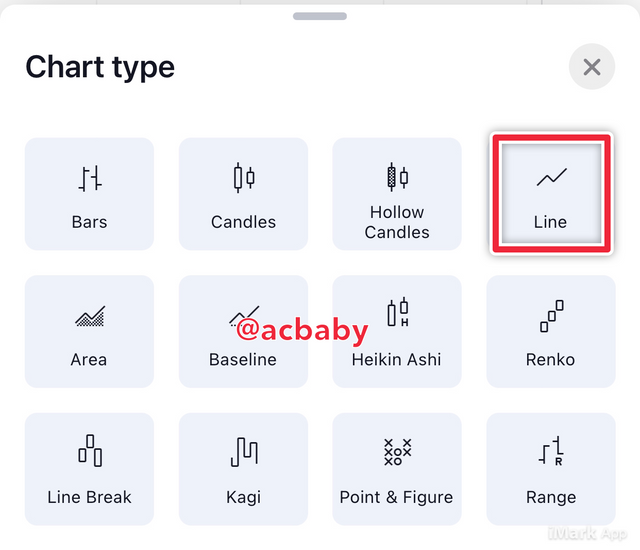
On trading platforms or platforms through which traders carry out technical analysis, there are different graphical representations of the price movement of an entity. Depending on the trader’s interest to ease the process and carry out technical analysis, the trader can choose any graphical representation of their choice. The screenshot below shows the different possible graphical representations options on tradingview.
The line chart is a special kind of chart representation showing a 2D data of price movement history which eases the process of technical analysis once the whole history of price movement is represented as a single line without much complications. With the line chart, the opening and closing price of an asset are linked together in time on a single line.
With the understanding that the love chart describes the opening and closing price of assets by a simple line, it helps to filter out noise and complications from the disjunction ups and downs movements seen on other graphical representations like the candlestick charts. Because of the simplicity of line charts, they give the trader a clear idea of the price movement of an asset without complications. Just like the other charts, the line chart is used to identify the change in market information with time. It is represented with the time scale at the horizontal axis while the price stays in the vertical axis. It can also be used for different timeframes (from seconds to months) just like the other charts.
Looking at the graphical representation of assets using the candlestick charts one can see how complex it can be to newbie traders. The solution to such complex charts is the line chart. With the utility of the line chart a beginner trader can easily make profits out of the market due to its simplicity which gives traders the ability to understand and interpret it properly. Irrespective of the over known and famous candlestick charts, when traders feel complicated or existed, an alternative chart is always the line chart.
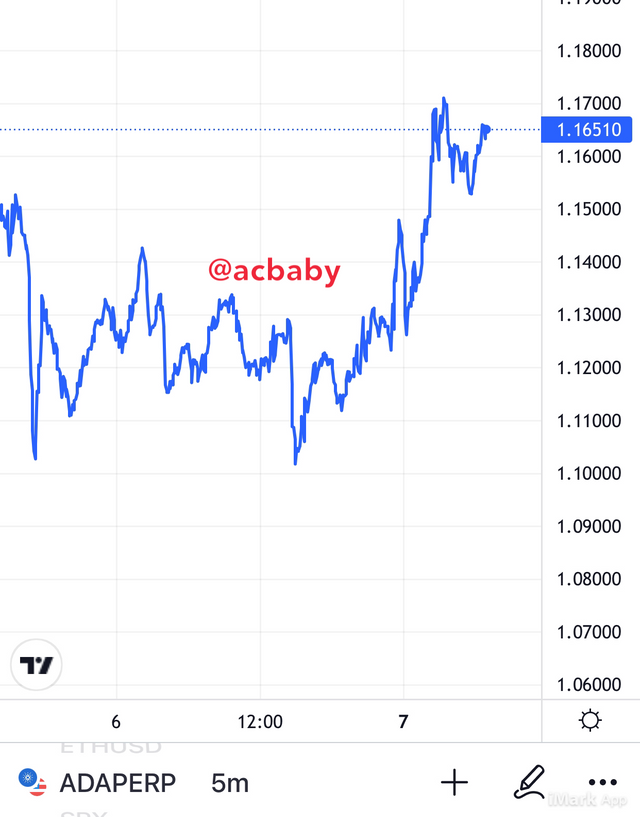
The screenshot above is an example of a line chart. You can switch to a line chart from the default chart on your trading platform by simply going to chart setting and click on “line” as seen below.
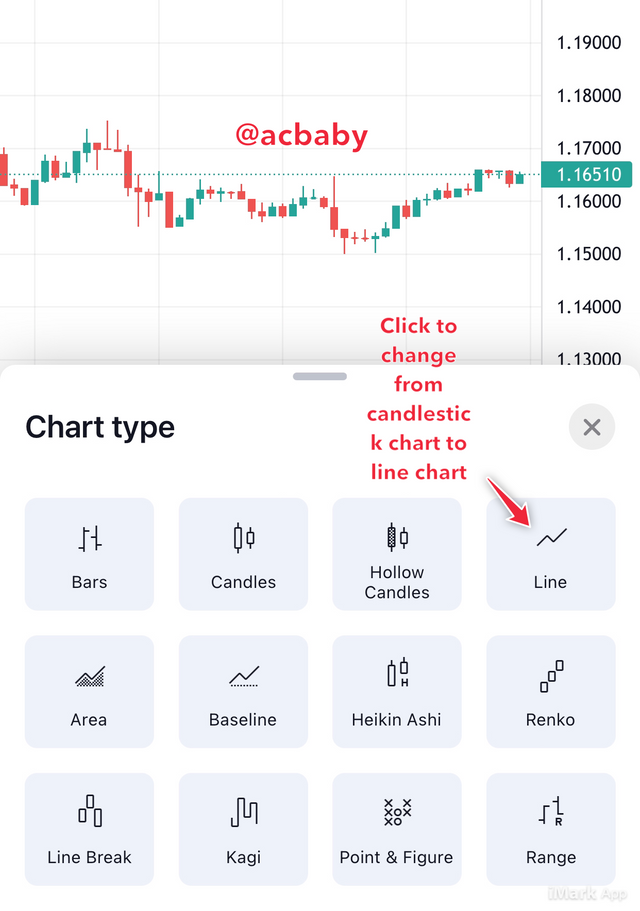
Line charts attract the interest of traders because they are simple representation of the price history of an asset. Interpretation of this chart type has been seen too easy by traders such that when carrying out particular analysis, traders may choose the line chart over the others. This is because this chart type offers productive profit making from easy analysis by the reduction of noise and complexity. In carrying out a long term trading, analysis on the line chart can be the best for every trader since movements are so clear and easy to understand the current and past movements as well as being able to interpret the upcoming market activity in a long term.


The term support refers to immediate or the long term price level that an asset repeatedly meets with time on the downside while resistance is the same but on the upside of the price charts. This means the support is an accumulation of lows while the resistance is an accumulation of highs at particular levels.
Generally, support and resistance analysis marks the roots of technical analysis in trading. They stand as a fundamental step to analyzing an asset on the price chart no matter the timeframe or chart style. A good trader will always identify the support and resistance of a price chart visually before even taking a step to interpreting the chart. This is used as a base to interpret price charts.
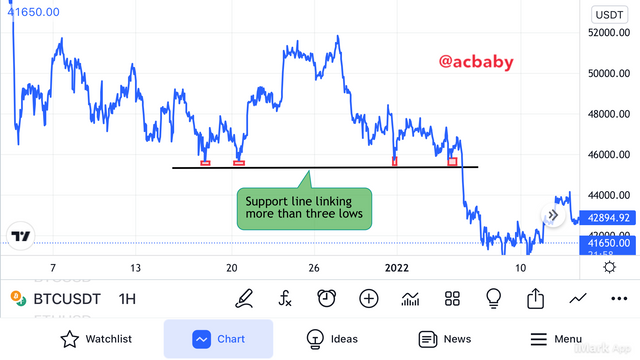
The above screenshot is that of the BTCUSDT price chart which describes the look of support level on a price chart. This can be further described as an area of the price chart which indicates a high bullish momentum such that the buyers over power the sellers and can only allow the price to drop to a certain amount (support level) while the bulls keep it on the upside.
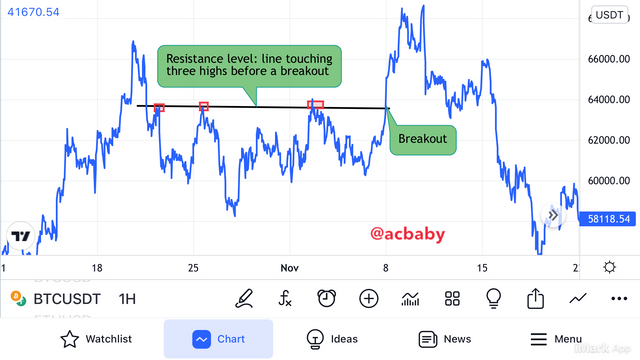
The above screenshot is that of the BTCUSDT price chart which is a description of a resistance line on the line chart. The resistance line is the line that connects highs of equal price at a certain time period. This is indicative of a period where the bears have high momentum over the bulls making the selling pressure to be higher than that of the buying. This makes the price to only move as far up as the resistance level and then freely migrates down.
When the resistance and support are identified on any price chart the trader can draw a line connecting them in order to ease the interpretation process. The said line is called a support line (in the case of connecting different lows of the same price) or a resistance line ( in the case of connecting highs of the same price). It should be noted that the said support or resistance line must touch at least three points on the line chart in order to be valid as a resistance level or support level. The more swings the line connects, the more valid and strong that support or resistance level becomes. This is to say a resistance line connected by five swings is stronger than that connected by three swings.


Like I described from the above sections, the line chart is a 2D representation of the price movement of an asset. This representation is seen as a single line connecting the open and closing price and different timeframes. The candlestick chart on the other hand is also a graphical representation of price movement of an asset but has been broken down into candles such that a single candle shows the open, close, high, and the low of the price of an asset at a particular time. With the candlestick you can see this activity in any timeframe of your choice. This makes the whole thing complex but very informative to a trader.
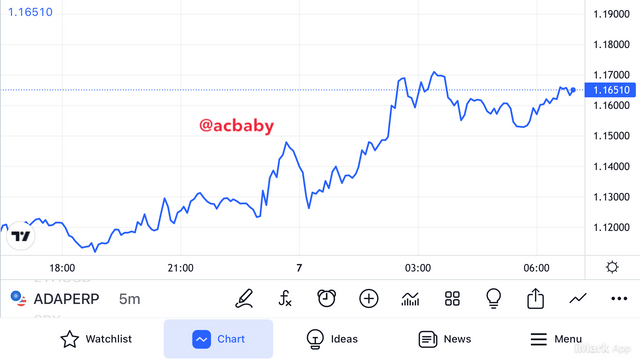
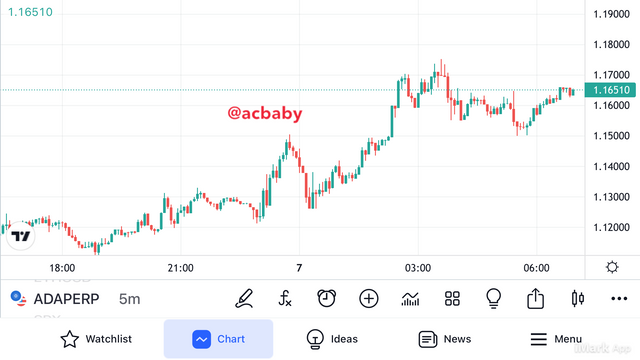
The above screenshots show the line chart of BTCUSDT and the candlestick chart of BTCUSDT. We can see a clear view of how different these charts appear but can be used to analyze assets the same way with some slide difference.
In general, line graphs provide pretty less information about an asset’s price movement because it only shows a single line connecting the open and close of price at a time. Thus, line graphs are best used for long term technical analysis for clearer and easy trend analysis. Therefore upon analysis for long term investments, the line graph should be used more compared to the candlestick charts.
The candlestick has a lot of information about the asset price movement since it shows more information than the line chart. To be on a safe side, no matter the idea of a long term analysis, it is better to use the candlestick chart to place your stop loss and take profit points. This is so because you will be able to see the highs and lows and differentiate them from the open and close that are near your support or resistance levels.
Even though candlestick charts are complex to work with, they can show more results from the price movement details recorded on individual candlesticks. There are also special analysis techniques employed on the candlestick charts such as the candlestick patterns and most at times traders use special candlestick characteristics to interpret the upcoming activities in the market and this aids the process of technical analysis into a perfect price movement prediction.


No matter the chart type a trader is working with, the trader makes sure to know the specific type of indicators that are compatible with the chart type in order to bring out good analysis before placing any trade. The line chart can be used with several indicators which I will describe a few and how we can use them to work out analysis on this category of chart.
We can use the Moving Average Exponential (EMA) on the line chart to analyze price trends and alternation as we place trades. In this case I can use two EMAs with one having a 21-period and the other having a 51-period. The EMA lines will act as the support and resistance when the price swings from side to side. If the price trades below the EMAs, we have a bearish market and if the price trades above the EMAs, we will have a bullish trend. The advantage to this indicator alongside the line chart is that we can trade the market on both sides if we wish. Thus it is preferable to check the overall market trend and trade only the side that is in line with the overall trend.
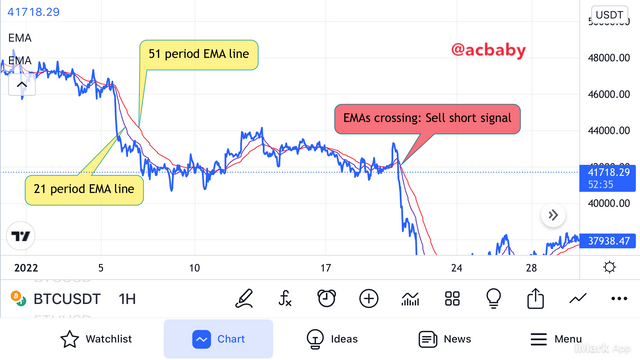
The above screenshot shows the EMA indicator lines with a description of a sell signal seen as the EMA line cross each other and the price trades below them. It should be noted that the higher the price trades away from the EMA lines the stronger the momentum of the market whether bullish or bearish.
Another suitable indicator is the Relative Strength Index (RSI) indicator. Just as applied on the candlestick charts, this indicator can be applied on the line chart also.

The above screenshot shows a line chart of BTCUSDT with the RSI indicator already added to the chart. When the RSI trades on the overbought zone it’s a sell signal and when it trades in the oversold zone, it’s a buy signal. We can see on the screenshot how the RSI gave a buy signal when it traded at the oversold zone and confirming from the line chart the price increased until an overbought is met.
A trader working with the line chart can use these two indicators at a time so that the information of one indicator compliments the other. These together with the support and resistance techniques will give a trader great trading clues on how to handle successful trades.


The line chart stands out to be very simply in trend identification as it’s made up of the price open and close by a single line. Being able to identify price trends in the market is very vital just like knowing the support and resistance levels in a market. Just knowing where the support and resistance lines stand, one can be able to know the market direction by drawing a trend line connecting the highs for a bearish market structure or by connecting the lows for a bullish market structure.
Trading success depends on knowing the direction of a market at any given time. Being able to identify when the market switches directions is of vital importance. With the line charts, the bullish and bearish market structures can be identified using several methods which I will describe one. The methods include flags, ascending and descending triangles, rectangles, and trend lines but in this exercise I will describe the trend line means of identification of bullish and bearish trends in the market.
To identify a bullish trend on a line chart you draw a trend line connecting the lows making sure that the trend line touches at least three lows. If this line is broken then we have a possible trend reversal.
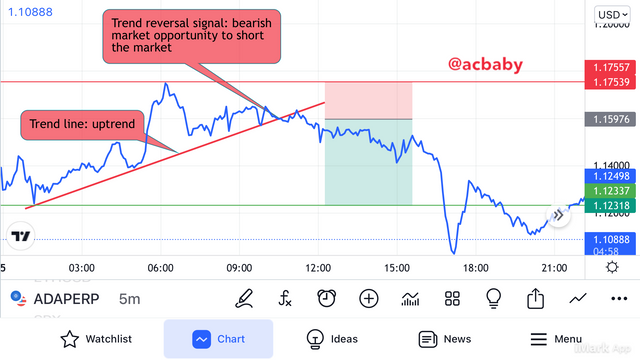
In the screenshot above for the ADAPERP price chart, I have drawn a trend line which indicates a bullish market. At one point the bulls could no longer maintain the strength in the market and the bullish momentum got weaker giving way for the bears to take over the market. Once this trend line is broken, we have a bearish opportunity in the market to trade on. As seen above I have placed a Sell trade with the entry just around the trend breakout area while theStop Loss (SL) is at the the immediate highest high and the Take Profit (TP) is at the base of the previous bull run.
Identifying bearish trend on a line chart is just the same as the bullish trend identification but on the opposite direction. Therefore I will draw a trend line connecting at least three highs. Whenever this trend is broken there’s a weakness in the bearish momentum. The price will keep on bouncing beneath the trend line until the bearish momentum becomes weak so much so that the bulls take over control of the market.
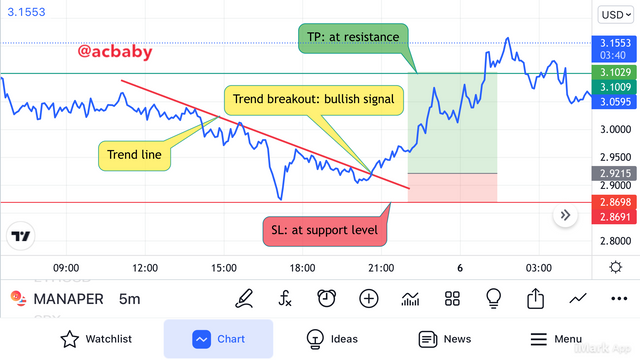
The screenshot above is that of the price chart of MANAPERP. MANA traded in a bearish trend as the price continuously hits the resistance level and returned to the bear zone until the momentum of the bears became very weak giving way for the bulls to take complete control of the market such that the was a breakout on the trend line to the “north” side. I have placed a Long position with entry just around the breakout price, Take Profit at the immediate highest high, while the Stop Loss is at the base of the previous bear run. That is, the SL is at the base of the immediate lowest low.
Several means for trend identification be used on the line chart to understand new market opportunities on the way or to trade and maintain the current trend in the market for successful trading.


To every technique there’s the possibility of having advantages and disadvantages no matter what. Between the advantage and advantage one has to outweigh the other and this is where the utility of a technique is considered productive to the one carrying out analysis.
Like I said from the beginning, line charts are easy to use and most especially for beginner traders on the financial markets. Using line charts helps a lot as well as keeps a lot of information away from the trader due to it’s limitations as a graphical representation of an asset’s price movement history recorder. Since the price charts only show the open and close of an asset and avoiding other information, this honders professional traders from getting all they need for analyzing the price charts. In this light most professional traders tend to use the famous candlestick charts for intraday trades as well as for long term since they become acquainted to this chart type because of ifs advantages over the line chart. Below are some compile advantages and disadvantages of line charts.
| Advantages | Disadvantages |
|---|---|
| Very suitable for long term analysis | most at times only used for long term analysis |
| Shows details that are hidden when using other chart styles | shows Manah disjunctive lines all over the chart |
| Breakouts are very unique | difficult to know current close position |
| Easy to read and interpret | difficult to determine SL/TP points |
| Good for beginner traders | most professional traders don’t use it |
| Provides good information without noise | hides vital details from the trader |
| Can be used on any timeframe | only considered good for long term analysis |
| Provides good results from indicators | indicator selective |


The line chart is one of the best charts I can recommend to a beginner trader in carrying out analysis for Spot trades. This is because for long term it will be the perfect chart to carry out analysis on. It is easier to determine trends on this chart and also different indicator tools can be applied on this price chart depending on the acceptance and acquaintance of the trader to these tools. Irrespective of the advantages that the line chart tend to have, it also has disadvantages compared to other price chart styles such as the candlestick chart.
Thanks to my professor dilchamo for such an explicit and swift lesson which has made me to be able to now analyze line charts in order to carry out trading.
Thanks for reading
Steem on
All the above screenshots are from tradingview.com mobile application