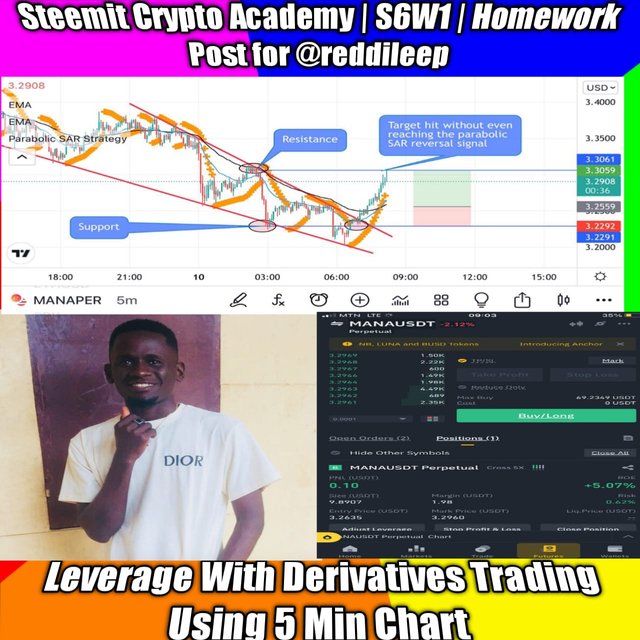


Hello steemians, welcome to my homework task for professor @reddileep about leverage with derivative trading. I will be talking about leverage trading, its advantages and disadvantages as well as how to actually carry out this activity. Let’s get to the work proper.


Trading the financial markets daily has brought the attraction of many minds. This is being influenced by the fact that one can use a small amount and trade with it as a very big amount of an asset such that the profits and losses are raised exponentially. On the cryptocurrency market, exchange platforms provide traders with leverage trading, which gives traders an advantage to make high profits from small staking capital.
Leverage refers to borrowing funds to increase a trading position such that it goes higher beyond what is the available balance of the trading account. Cryptocurrency traders are often provided with such advantages when they trade on centralized platforms. Leverage has the ability to amplify the profits as well as the losses from a trade.
Leverage involves the borrowing of a certain amount of an asset by a trader on a trading platform so that they can invest in an asset. This can range from 2x to above 100x depending on the platform.
So therefore, leverage trading can be defined as a lucrative and a risky means of carrying out a trading activity such that profits and losses can be maximized irrespective of the staking amount. You can simply multiply the amount you have in your trading account such that it is increased to higher amounts and so is your profit and losses. Leverage trading doesn’t look into a particular market structure and so it has the ability to make a trader profitable in both bearish and bullish market structures. This just depends on the position taken by the trader and how the market responds to that position.
The most important aspect of leverage trading is the ability to exponentially maximize profits and losses . Therefore if a trader accurately identifies a trend and takes a good position, the trader can make good profits. It should be noted that liquidation mostly takes place in this type of trading. This happens when a trader is proven wrong by the market such that all their sticking account is wiped off the market. With leverage trading it’s easier to blow an account and also easier to make a huge some of money in the short term.


Leverage trading is a very advantageous trading method which brings to the trader a lot of advantages over tha market no matter the structure of the market. With leverage trading a trader can make profits in bull and bear runs.
With leverage trading your capital is free since y ou u can use a small amount and man up to a higher staking amount for a trade. Therefore upon placing a levearge trade, you can use a $10 account and trade as $100 account. This will make you a profit for $100 if the trade goes as planned and losses for $100 if the trade goes south. This allows you to take much larger positions that’s your account worth. With such opportunities you can invest in different assets at a time with just a small amount in your wallet.
Leverage gives you the opportunity to increase your position while the trade is still live such that you receive a call or notification to add funds in order to stay in the market for a longer period. With such trading methods you are not required to actually buy the asset but you just predict it’s future move and place your trade then sit tight and wait for profits.
Like I said earlier, this trading method can be beneficial to a trader and at the same time very risky. As it allows you to borrow from the trading platform and trade for the reason that when your capital gets exhausted in the market, the trade automatically stops and you loss all. On the other hand you can make great profits and earn it all without anyone coming to ask for the interest on what you borrowed from the market.
An additional advantage of the leverage trading is that upon placing a trade you are given the option to chose a cross margin such that your portfolio can stand as an insurance fund to the amount you place on a trade.
During a leaveage trade, we can see the profits and loses. This gives the trader the ability to close the trade anytime possible. Imagine a situation where you can see when I’m profits and when in losses before the end of the trade. You can stop the trade once you have got your satisfied profits. You can easily get a part of the profits from a trade without closing the trade. This can be done by placing a limit order of a fraction of that trading amount and when the limit target is hit, you get the profits saved in your portfolio.


Leverage trading has a couple of advantages it offers to traders as well as disadvantages. Despite the famous advantages of this method of trading the cryptocurrency market, leverage trading has some cons.
The risk reward ratio of leverage trading is very high and as such it may lead to the blowing of a trader’s account upon trade failures. This means that small mistakes stand for great effects to the capital of the trader.
Compared to the famous spot trading, leverage trading has some certain fees a trader pays upon carrying out the trading activity. This amount, though very small, is significant to the portfolio of the trader’s account.
Liquidations on leverage trades are very common and take a lot of beginner traders by surprise. Small volatile movement in the market price of an asset can render a trade to be failed. This trading method is only advisable to be done by professional traders.


There are different basic indicators that we can use in carrying out analysis for leverage trading. The need for such indicators is that the trader needs to be very convinced of the trading position and it’s size from the analysis done on the price chart. This is to avoid trade failures which can of course lead to liquidation and even blowing of a trading account. Using basic indicators will filter false trend breakouts and also tell the trader when, where, and in what direction to place a trade at a given time.
Below I have described certain common indicators that can be used for this purpose such that every trading position taken by a trader is beyond doubt.
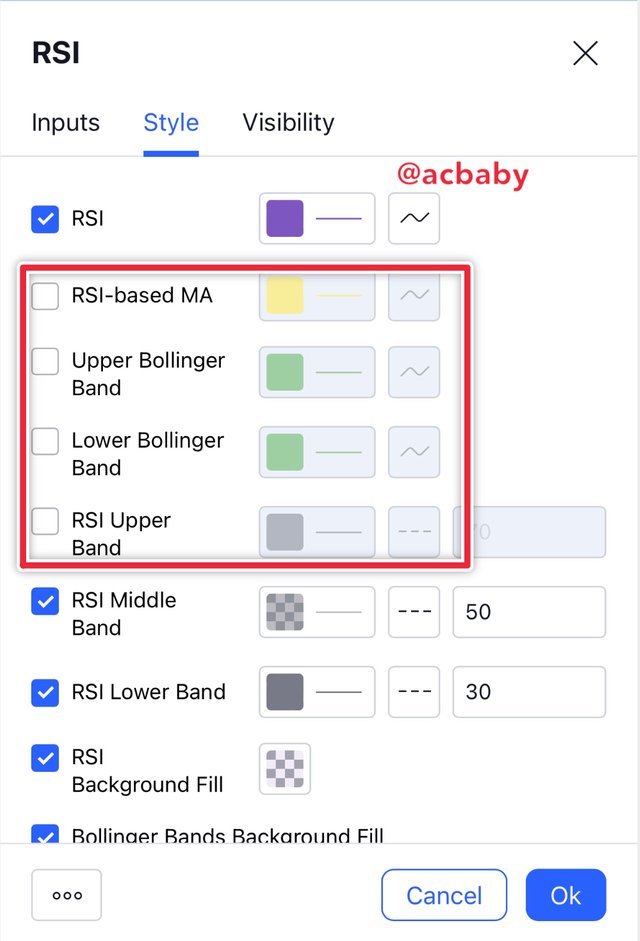
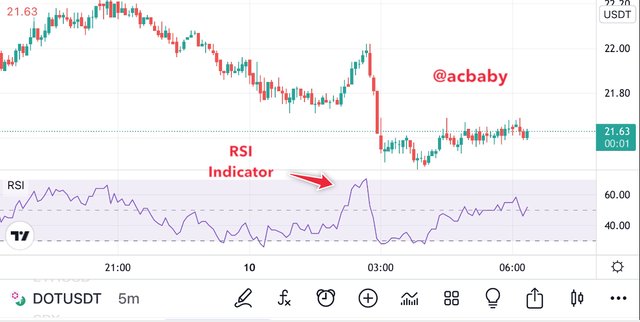
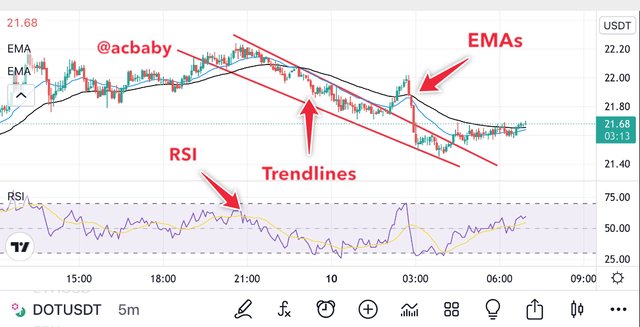
RSI is an indicator having a zero level which tells you when the asset is trading above (bullish) or below (bearish). The RSI indicator has an overbought region found from 80+ and an oversold region from 20 below. If the price trades in the overbought, then we have a sell signal and if the price trades in the oversold, we have a buy signal from the RSI. To use this indicator we can reduce some unnecessary functions in order to make the indicator very clear and easy to interpret. The first screenshot below shows how we can edit the indicator settings to suit us while the second screenshot shows us how the indicator appears on a price chart.
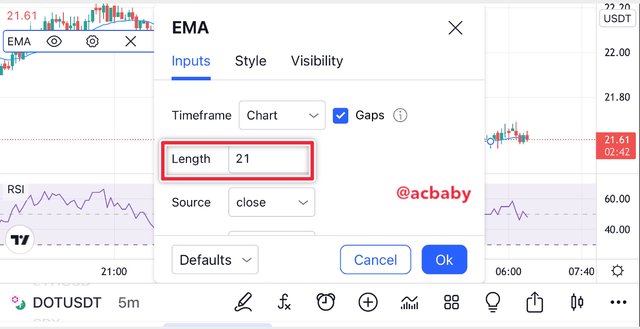
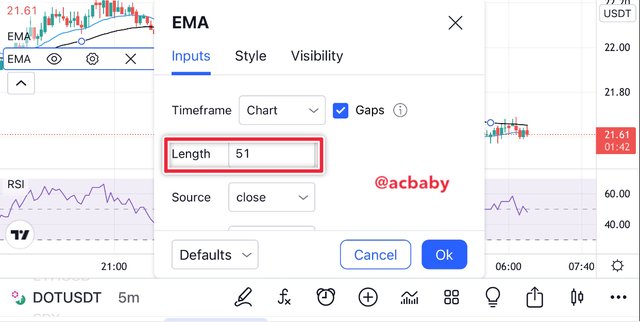
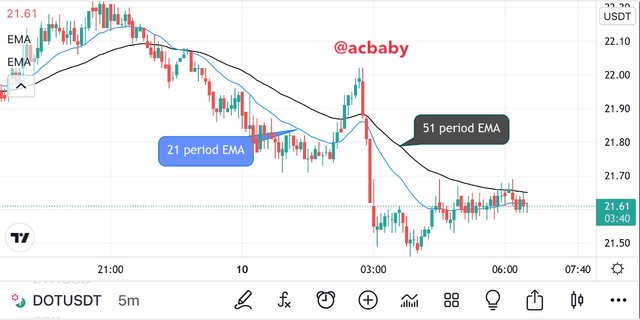
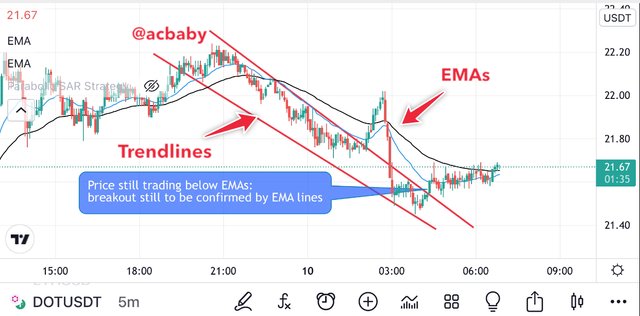
The exponential moving average indicator can be used as a trend identifier for leverage trading analysis. When applying this indicator, the settings can be changed to suit the use of the trader such that the trader can customize it in different ways. I will use the 21 period EMA and 51 period EMA. When the 51 period EMA is above the 21 period EMA and the price trades below them, the market is considered bearish and when the 51 period EMA is below the 21 period EMA while the price trades above them, it’s considered a bullish market structure.
Therefore, whenever the two EMAs cross each other we have a leverage trading entry signal. In this case we can have a sell trade signal or a buy trade signal depending on what is seen from the EMAs on the chart.
The screenshots below show the two EMAs configured and how they appear on a price chart.
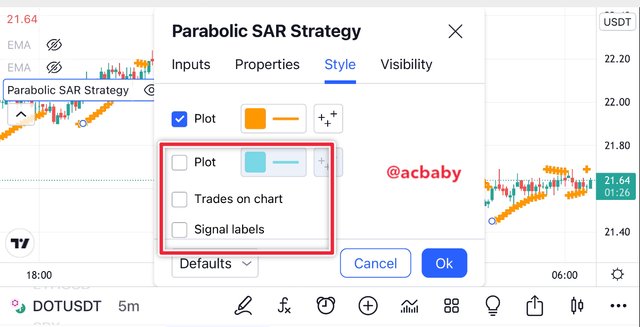
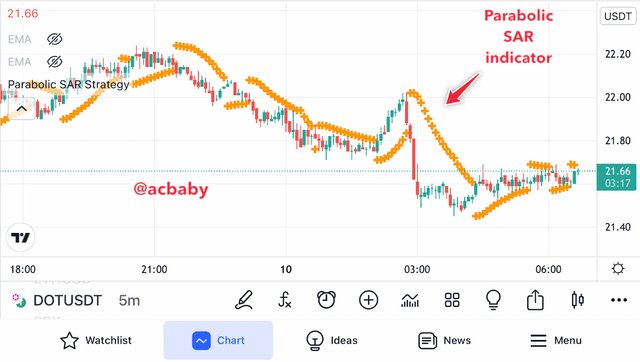
When the parabolic indicator is added to the chart, it can be configured to avoid too much complexity of the indicator on the chart. The screenshots below show a little about this configuration and how the indicator appears on a price chart. When this indicator appears below the price it is a buy signal and when it appears above the price it gives a sell signal. Therefore this indicator works like a trend line but additionally it gives directions to the trader ok when to long or short the market as well as when to open a position or close it.


To carry out leverage trading its required to take out time for some analysis since it’s a very risky trading method. I will describe how to use some of the indicators I talked about in the previous section in order to make good entries.
To perform a leverage trade I will firstly study the chart and draw support and resistance lines to identify areas of support and resistance levels or trend lines to identify when a particular trend will be broken. This will determine the trend of the asset and also readily indicate and identify any breakout from any of these levels on the chart.
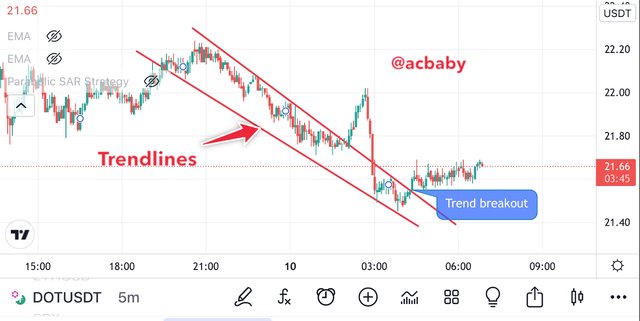
Secondly I will add the Exponential Moving Average indicator to the chat twice. Then I will configure the EMAs onto the 21 period and 51 period EMAs. When the two EMAs crossover each other I will make an entry. Like o said in the previous section, if the price trades below the EMAs it’s a bearish market structure and if it trades above, then it’s a bullish market structure. This together with the trend lines from the support and resistance will tell the trader the direction of the market very clearly.
The last part will be the filter indicator known as the Relative Strength Index. Here I will wait to see the indicator signal and overbought or oversold levels in order to confirm my entry. If the trend lines, EMAs and the RSI give the same signal then I can make an entry.
To confirm the breakout using another indicator I will employ the parabolic SAR at this point. Because I can only use three indicators at a time I will have to remove the RSI from my chart and add the Parabolic SAR indicator for entry and exit signal confirmation.
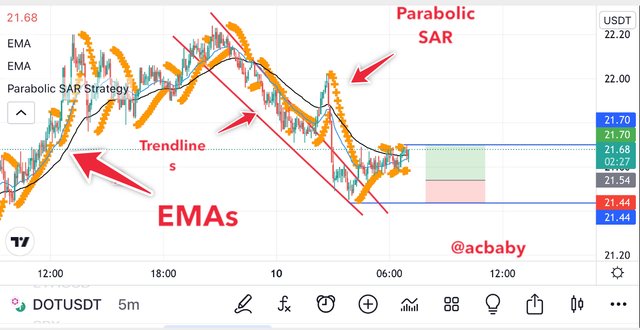
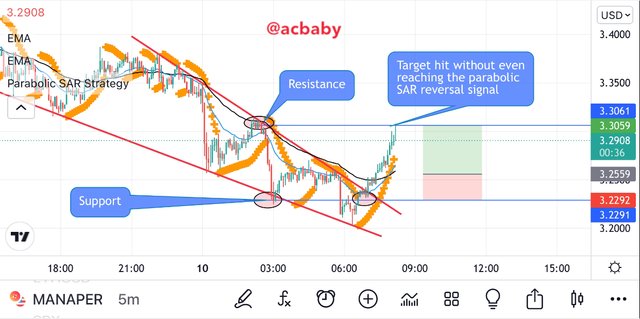
We can see how this indicator confirmed the breakout and gave an entry signal for a buy position. I made the entry and when the parabolic surfaced on the upper side the trade was closed to avoid losses.
That’s how we can used the combination of these indicators to catch trade opportunities in the market for levearge trading.


I will carry out a trading analysis on a 5 min chart of MANA Perpetual on tradinview with the methods I applied above and will complement it with the Parabolic SAR indicator in order to know when to close my position when already in the trade.
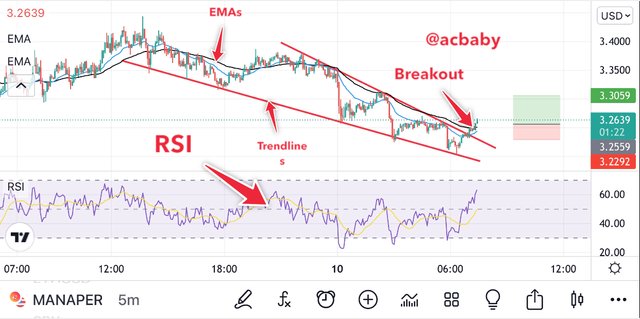
The first thing I did was to draw my trend lines and add the EMAs on my chart. At this point the was a bullish breakout from the trendline connecting highs. To confirm this breakout I had to check from a lower time frame to see if the EMAs have crossed over for a bullish market. When I got to a 3min time frame I saw that the EMAs had already crossed for a bullish trend so I tried to place my take profits and stop loss before continuing the confirmation of my entry. I later added the RSI indicator and it confirmed the breakout as it moved past the zero level into the upper band indicating a possible bullish market.
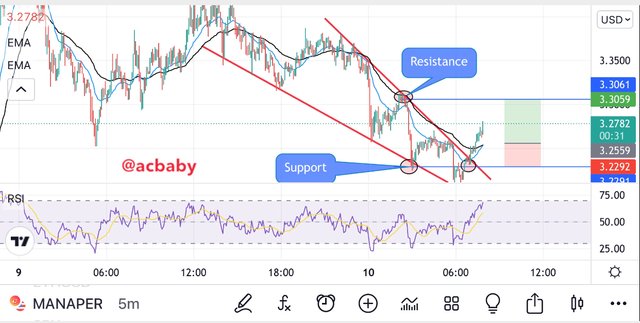
I identified the immediate support and resistance to use as the take profit and stop loss prices
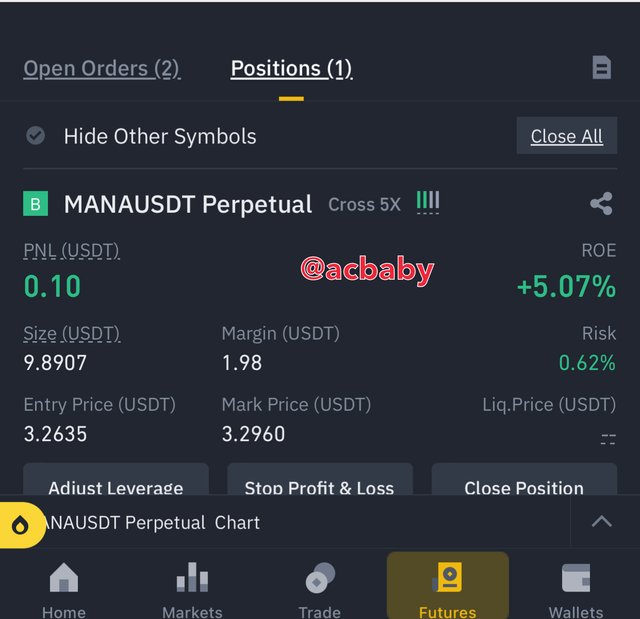
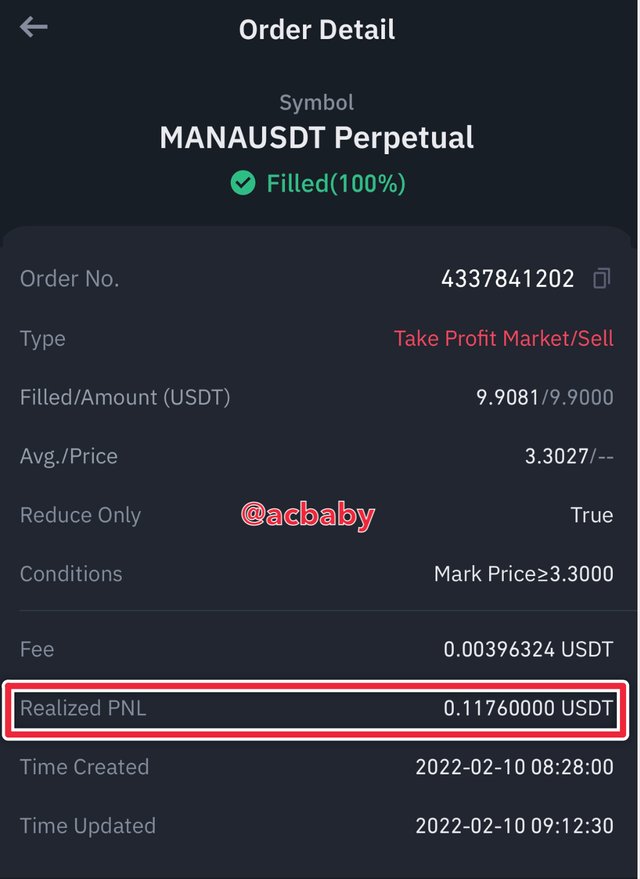
U made an entry when $MANA was $3.2635 and placed my take profit at $3.3 with the stop loss at $3.21. My margin was quite small because it’s for the proving of this exercise and the trade went 100% successful.
I made sure that I used the Parabolic SAR to determine the confirmation of my entry and also to keep watch on when to exit the market. Fortunately for me, the trade target hit without receiving a reversal signal from the parabolic SAR indicator. This means that the trend was still in progress


I’m conclusion we can see how wonderful leverage trading can be when you carry out good analysis before launching a trade. You have access into maximizing your account worth upon utilizing the leverage trading method. This is very profitable but very risky at the same time. We practice this type of trading when we are very sure about the trend of a market and this comes from using a good number of well understood indicators and trading strategies. Notwithstanding, we should know that technical analysis is not the overall idea behind trading because there’s more to it.
Thanks for reading my work and I want to also thank my professor @reddileep for a wonderful lesson as such.