


Welcome to my homework task post for professor @pelon53 about starting crypto trading. Normally as an individual before getting into a field it’s always good to know the generalities of that field e special when it comes to dealing with finances. To trade the cryptocurrency markets there is certain analysis that has to be done in order to know the price movement activities that may occur in the near future of a project you are to invest in. To carry out this analysis you will have to identify the type of analysis of the combination of analysis that suits your investment or trading scheme. This post is all about such analysis.


Fundamental analysis is an old means of analyzing the financial market by external forces that may affect the buy and sell criteria of a certain asset. This is the benchmark method of predicting the market movement by understanding the fear and greed index of the market based on information about a certain asset. A typical example of fundamental analysis is when a certain news about a cryptocurrency circulated around investors such that they sell or buy more of that asset based just on rumors. This can be seen when BTC was in a great bull run last year and rumors came about Russia having something to do with the banning of cryptocurrencies. This made many individuals sell their cryptocurrency assets causing the market to loss trillions of dollars in a short time. Another typical example can be seen from the news that comes to the cryptocurrency market about China not wanting to do with cryptocurrency from time to time causing drastic drops in the value of BTC and other alternative coins. Another way to look at fundamental analysis is how the tweets of the famous Tesla CEO Elon Musk affect the buying and selling of cryptocurrencies such as Doge coin and other meme coins.
Whenever there’s news about a certain cryptocurrency asset, the market price is affected. This is to say that the fundamental analysis, though based on external forces rather than price action, plays a vital rule in the trading of a particular asset.
Fundamental analysis is good for a trader but I don’t see it good for a trader to depend solely on fundamental analysis. This is because fundamental analysis comes with a lot of flaws. At one point people (investors) might resist the public opinion about the market and this will cause the value of an asset lot to change as expected by every news that hits the market. Fundamental analysis has never been able to make investors prepare for drastic market changes such as collapsing of the market of a certain asset. The volatility of the market place doesn’t seem to be directly dependent on the news that hits the market because this aspect of volatility is controlled by different activities. If fundamental analysis independently could be the best means of carrying out analysis on the financial markets, professional traders wouldn’t have been using other analysis to compliment it.
The fundamental analysis is solely based on the microeconomics of an asset such that it leaves out activities like the number of traders currently trading a particular asset and instead focuses on financial events, supply and demand chain, and the socio-political activities that can influence the value of an asset.
For traders who want to just get into the financial markets (cryptocurrency markets), can use the fundamental analysis for the beginning and later compliment it with different analytical models. Buying low to sell high can still be achieved by simple fundamental analysis such that a beginner trader makes good profits from the market without much calculations but just news and acting on the news with the hope that the rest of the market will follow.


Technical analysis dates back as far as the 1890s when Charles Dow wrote articles known today as the Dow theory creating the first stock index known as the Dow 12 Industrial Average. At this time fundamental analysis was a leading technique used in the analysis of the financial markets. This came to a point where for every one professional technical analyst there are about 700 professional fundamental analysts. Over the years the technical analysis gained much acceptance by investors of the financial markets. Despite being able to use technical analysis to predict the future of the market, technical analysis also has an added advantage as it is used for risk management during trading activities.
The repetition of activities in the financial markets made technical analysis to gain heights such that it became the most used form of analysis until date. Technical analysis focuses on the past history of the price chart of an asset to understand trading opportunities in the future of that market. This method employs patterns of collective behavior that acts as a representation of an activity that like happens all the time on the price charts. Due to the high volatility experienced in the cryptocurrency markets, technical analysis has gained more in this market type such that in combination with fundamental analysis, gives very good results. The overall working system of technical analysis employs technical indicator tools, chart patterns and other relevant data from the charts.
Technical analysis focuses on the price action of an asset and its past history to predict future market movements after carrying out some level of calcutive manipulations while fundamental analysis is based on understanding the microeconomics of an asset at a particular time to understand the next market move of that asset. Fundamental analysis is good for long term bull run and limited in the bear markets such that it is difficult to know the exact take profit position of a bear market while using the fundamental analysis. Technical analysis on the other hand can give an investor a certain direction and proof otherwise in later times such that it will tell the investor or trader that the former analysis result has been breached and the trader can change positions. The table below gives a better understanding of this difference.
| Fundamental analysis | Technical analysis |
|---|---|
| Analysis based on past and present activities | analysis based solely on history |
| Analysis brings out the actual value of an asset | Analysis only determines the future price of an asset |
| Used mostly for bull markets | not limited to bull markets |
| Calls for investment opportunities | calls for trading opportunities |
| A bear market is not a good thing | both market structures are considered as opportunities |
| Depends on news and external microeconomics activities | focus on price action as seen on price charts |
| May be influenced by political activities | only looks into chart activities |


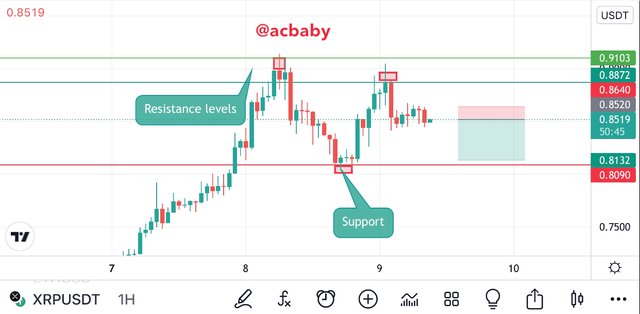
To place a support line I will draw a line connecting points of equal lows such that it forms an area of price rebound upon moving downward. Any breakout seen on this support level signals an entry and I will take a position depending on the breakout experienced. For support, I can make an entry during the rebound and take a long position or I wait for the support to be broken and I take a short position. This can also be done on the resistance levels but in the opposite direction.
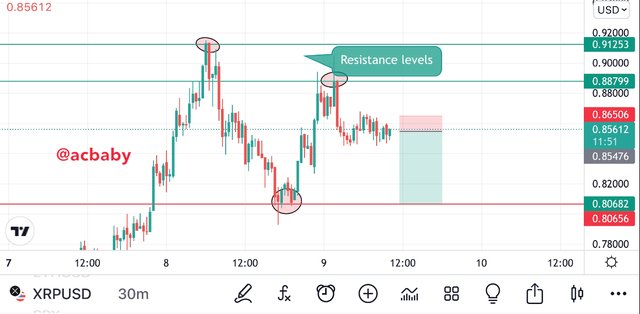
I will carry out a trading analysis below based on the support line breakout using the 1h and 30min timeframes. This will be best described on the below screenshots and the demo trade success/failure will be seen also.
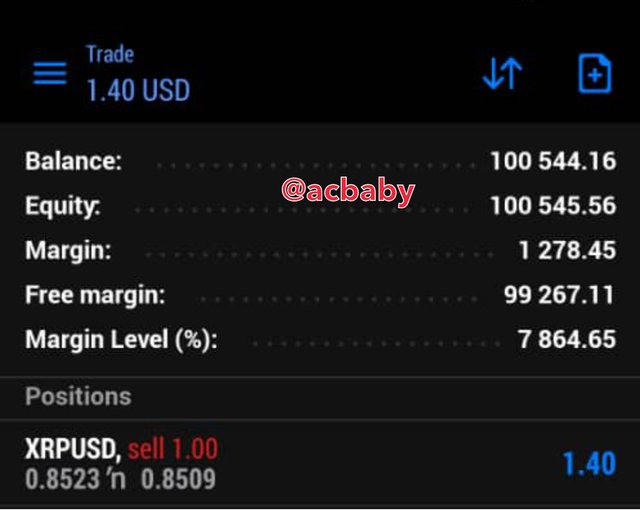
The following screenshots show the technical analysis carried on for the XRPUSDT price chart based on support and resistance techniques on different timeframes. The first screenshots are that of the analysis done on a 1H timeframe and the second is the demo account trade success.
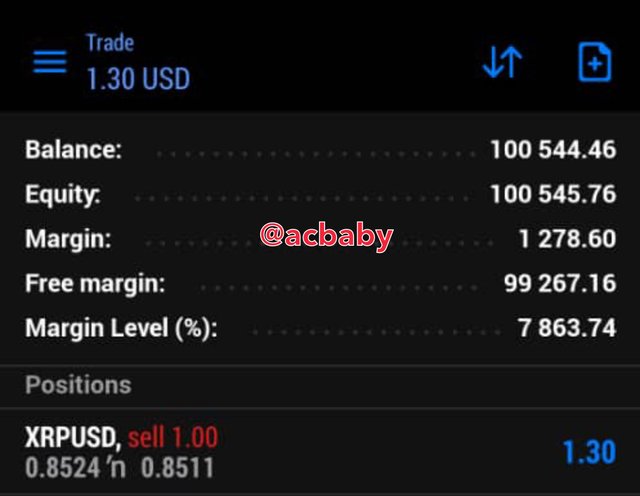
The proceeding screenshots are for the 30min time frame chart of XRPUSDT and the next screenshot is for the demo account trade success.


To place a resistance line I will draw a line connecting highs of equal prices such that it forms a level whereby the price was unable to go further ahead. Breakout from the resistance line signifies a long position and a trader can still trade during the downtrend from the resistance line. This same activity can be done on the support line but on the opposite side just like I explained in the last section.
I will place a demo trade below based on the analysis from breakout seen on a resistance line. This will be done on a 1 day and 4h price charts.
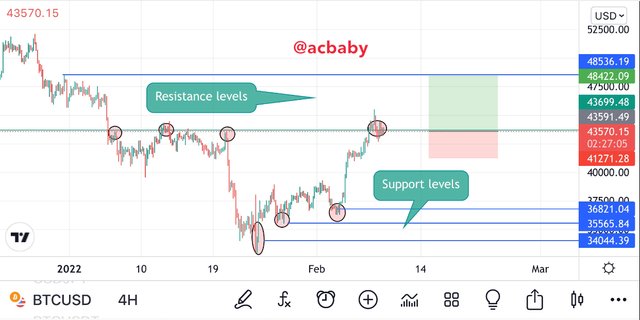
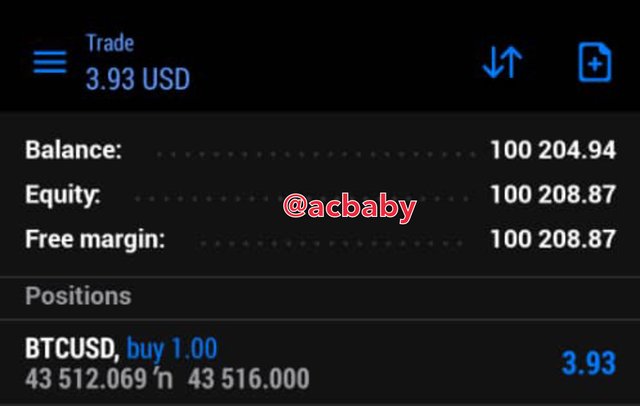
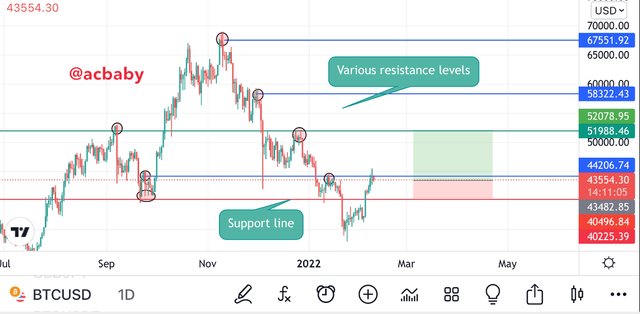
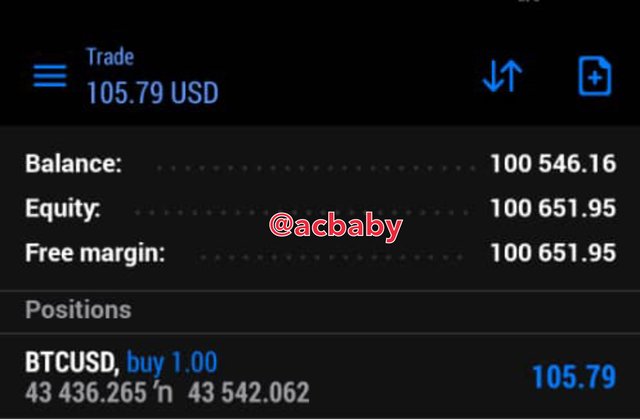
The screenshots below shows a technical analysis on the BTCUSD price chart based on support and resistance techniques. This analysis was done on a 4H timeframe and a 1Day timeframe producing the same results which is a buy signal but giving different take profit points and stop loss levels. The first screenshot is for the 4H timeframe and the next is the demo account trade success.
The screenshots below represent the 1Day chart analysis with a next screenshot showing the demo trade success.


A hanging man candlestick pattern is that which occurs when in an uptrend, the bullish momentum becomes weak and a reversal signal is produced. This happens by price moving up to a few price bars and later a single candle forms with a shorter body and longer wick to the downside. The candlestick has a lower wick with a shorter top body such that the wick is about two times the size of the body. This candlestick might have an upper wick sometimes but the upper wick should be very short.
This pattern is a representation of a high sell off level in the market such that the bears take over from a pre-existing bullish market.
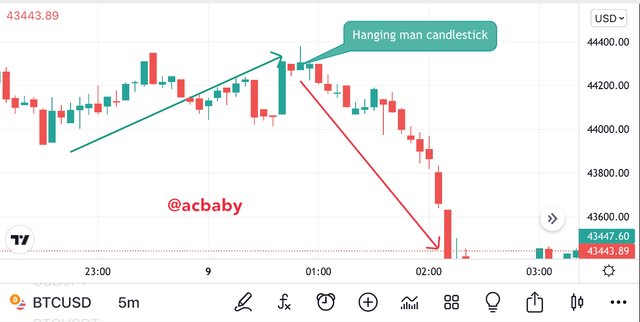
The above screenshot shows a hanging man candlestick pattern where the hanging man candle is formed on the top of the trend indicating a possible reversal from a bull run. After the rise of price to the body top of the hanging man candle, we can see how the next candlesticks takes the trend to the south side of the chart leading a bear market.
The shooting star candlestick pattern is the bearish reversal form of the hanging man candlestick pattern. Here the candlestick is called the shooting star candle instead of being called the hanging man candle. When prices trades to the south and the bearish momentum becomes weaker and an impulsive move to further south takes place forming a candle whose body is small and the wick is formed on the upper side, we have a shooting star candlestick pattern. For this to be confirmed, the wick of the shooting star candle itself has to be about twice the size of the candlestick body and there should be little or no wick to the bottom of that candlestick. When this happens, we have a shooting star candlestick pattern which ends up with a bullish trend formation.
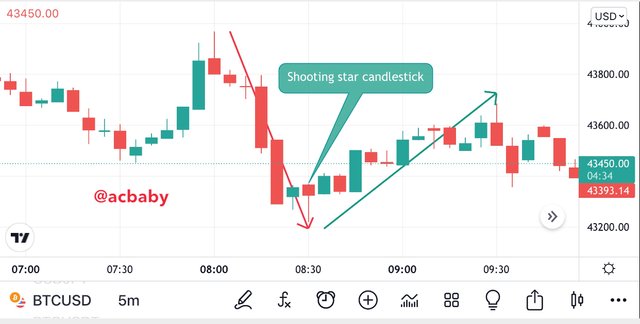
The screenshot above shows a shooting star candlestick pattern which leads to a bearish reversal into a bullish trend.


Trading the financial market comes with different analytical evaluations which determine the next move of the market. This can be done by fundamental analysis, technical analysis, quantitative analysis, sentimental analysis, and rational analysis. Amongst these analytical techniques is the famous technical and fundamental analysis.
The fundamental analysis focuses on information about the microeconomics of an asset and how news is spread about the growth or failure of an asset. Technical analysis on the other hand focuses on the price action of the market and how it affects or determines the next market movements since price patterns are known to be repeating itself in the market.
Both methods put together will give a trader an edge over the market because this analysis forms the basis of the action and decisions of most traders and investors of the financial markets.
Carrying out technical analysis can be for a variety of ways such as based on individual signals from candlesticks or a recurrent pattern such as support and resistance which when broken will give a trading opportunity to the technical analysts.
A big thank you to my professor @pelon53 for this great lesson about starting a trading life or journey. I also want to thank you for reading my work.
All screenshots were taken by me on tradingview and MetaTrader App