
Introduction
Hello to everyone.
First of all, I wish you all good and healthy days. We have entered the 6th week of Steemit Crypto Academy. In this article, I will complete the tasks given by professor @cryptokraze. I will complete these tasks and try to convey the topics and examples to you simply and clearly so that everyone can understand them.
In this week's article, our topic will be about Liquidity Levels in Trading. Without further ado, I want to get to the point. Thank you to everyone who reads my post.

Question 1
What is your understanding of the Liquidity Level. Give Examples (Clear Charts Needed)
Liquidity levels are defined in many ways. Generally, these are the points where money accumulates. For me, it's a hunting spot. However, in order to understand it better, we need to know the term meaning of liquidity.
Liquidity Levels; It is formed by the accumulation of orders at certain price points. These orders are entry and exit orders such as buy-sell, take profit, stop-loss. These orders, made by many traders for the same price point, cause the coins to accumulate at a certain level. For this reason, as we said before, we can say that the points where money is accumulated.
However, as I mentioned before, the liquidity level is a catch level for me. Because many institutional investors and whales produce false signals at these levels. In this way, novice traders or impatient traders can easily get their money.
So How Do We Understand Liquidity Levels?
After any asset reaches a certain high or low price level, many buy or sell orders are triggered. Thanks to these triggered orders, many transactions are activated and a reversal movement takes place in the price. These reversal points are called the liquidity level. We can see this more clearly in a cryptocurrency chart.
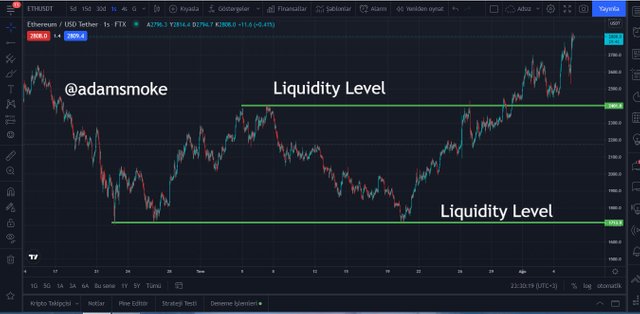
- Liquidity Levels are shown in the ETH/USDT chart above. As we can see from the chart, Liquidity Levels are similar to our support/resistance levels and also act as support/resistance. After these levels, a market reversal is possible, but not certain.

Question 2
Explain the reasons why traders got trapped in Fakeouts. Provide at least 2 charts showing clear fakeout.
Every trader can easily determine liquidity levels. However, this is exactly why I describe it as a hunting ground. Liquidity levels do not always move in the predicted direction. At this point Fakeouts occur.
Many traders are too early to take positions at these fakeout spots. They take their positions without waiting for the confirmation of the actual breaking point. Then the price does not move as expected and moves in the opposite direction, causing anyone who takes the wrong position to lose.
In fact, this can be called a price manipulation. It occurs when large-capital traders, whom we call the whales or those who manage the funds of large financial institutions, manipulate the price in order to make easy money.
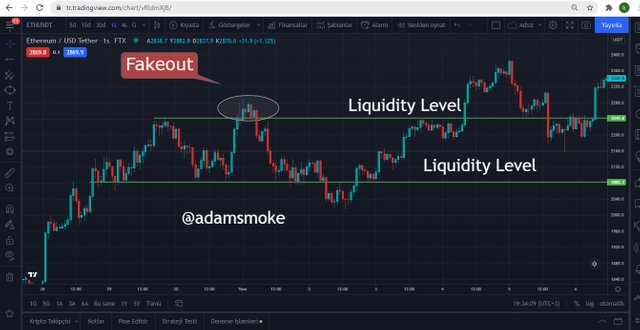
- As we can see in the chart of the ETH-USDT pair in the screenshot above, the price makes a low-high high while in an uptrend. It then breaks the liquidity level. Seeing this, traders make a purchase, and then large traders move the price in the opposite direction of the trend, thanks to their play on the price. In this way, he can earn money easily.
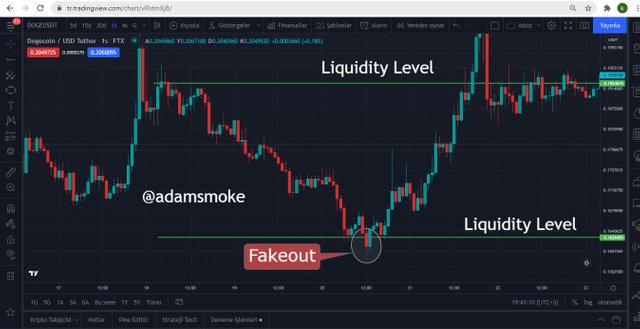
- Above is the chart of Doge-USDT pair. As we can see from the graph, there are fakeouts at many points. At the point I have shown, while the price is in a downtrend, the price enters a fakeout point after breaking the liquidity level. Then the big investors play on the market and the price starts to rise again and enters an uptrend.

Question 3
How you can trade the Liquidity Levels the right way? Write the trade criteria for Liquidity Levels Trading (Clear Charts Needed)
We need to be careful when trading at liquidity levels. Before entering a position, we must do the trend confirmation correctly and be careful not to hunt in fakeout areas.
In order to take a correct trading position, we can perform trend confirmation in two different ways. These; Market Structure Break (MNS) and Break Retest Interval (BRB) strategies. While using these strategies, we can get help from different indicators. Now, with these two strategies we mentioned, let's specify the Liquidity Levels trade entry and exit criteria.
Market Structure Break (MBS)
Entry Criteria
- First of all, we should pay attention to the price approaching the liquidity level. Then, after the price reaches the liquidity level, the price moves in the opposite direction or a fakeout occurs and the price exceeds the liquidity level.
- Then if the price is in a downtrend, it makes a high low. If the price is in an uptrend, it makes a lower rise.
- Then we must carefully follow the movement of the price in order to confirm the position we will open, and we must follow the price for a certain period of time by not entering the transaction.
- Then if we expect an uptrend reversal, the price will break and close at our previous low high. If we expect a downtrend reversal, the price will break and close at the previous high low.
- We should then take our position after these breakouts or closes have occurred.
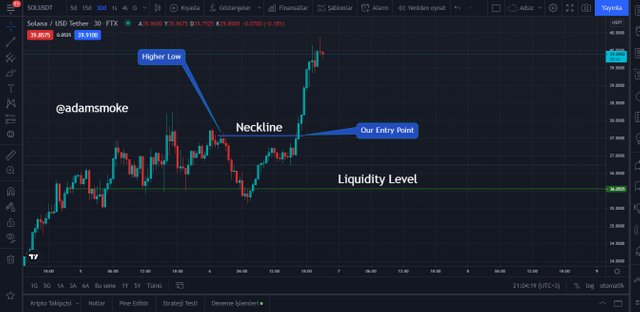
The 30-minute charts of SOL-USDT pair are used in the screenshots above.
Exit Criteria
- We have two ways of exiting this position.
- Our first exit method is the stop-loss point we set in case our trade does not go in the direction we want. We can place our stop-loss point slightly above or below our liquidity level according to our trend.
- Our second exit method is our risk:reward (1:1) ratio, followed by our take profit level.
- Our stop-loss and take profit orders allow us to reduce our losses and secure the money we have earned during our trading. We should definitely not forget to use stop-loss in every transaction.
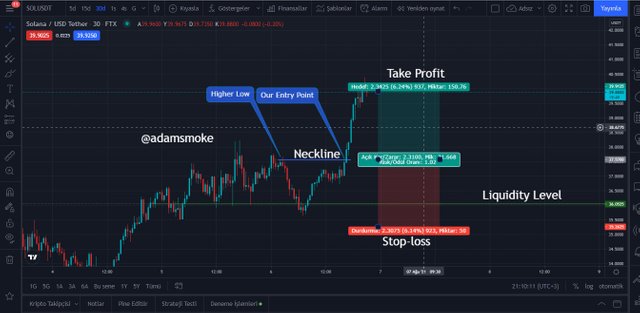
SOL-USDT pair 30-minute charts are used in the screenshots above.
Break Retest Break (BRB)
Entry Criteria
- Our price should again approach our liquidity level and break our liquidity level. The price then oscillates.
- During this swing of the price, the price should touch the liquidity level again and then move in the direction of the trend with a bounce in the opposite direction.
- While the price is making this movement, that is, while continuing its movement in the direction of the trend, it should break and pass the price level that it oscillates.
- The exact point where we will then take my position is the point where the price breaks the swing level.
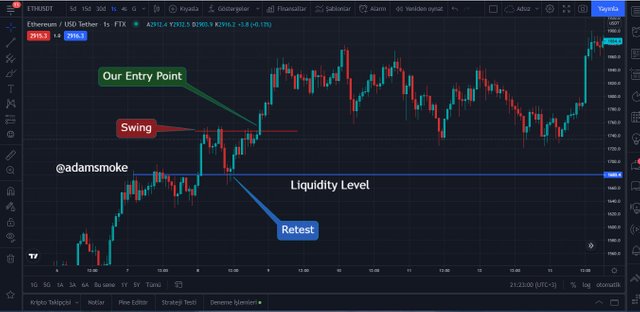
The 1-hour chart of the ETH-USDT pair is used in the screenshot above.
Exit Criteria
- After taking our position, we will have two exit points to exit our transaction.
- The first of these will be our stop-loss level. At this point, our stop-loss level should be slightly above or below our liquidity level, again depending on the direction of the trend.
- Our other starting point will be our take profit level, which we created by following the risk:reward (1:1) ratio.
- Likewise, our stop-loss and take profit orders prevent us from making further losses during our trade and allow us to secure the money we have won. As we said before, we should use stop-loss in every transaction.
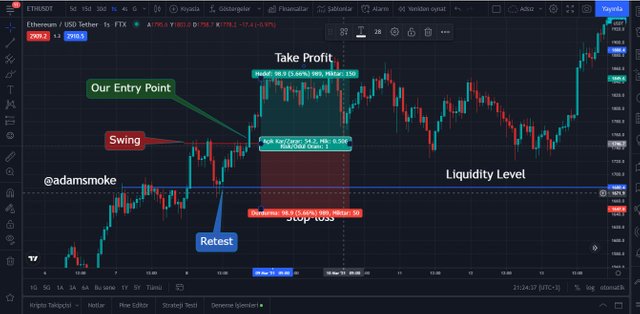
The 1-hour chart of the ETH-USDT pair is used in the screenshot above.

Question 4
Draw Liquidity levels trade setups on 4 Crypto Assets (Clear Charts Needed)
BRB Long Position
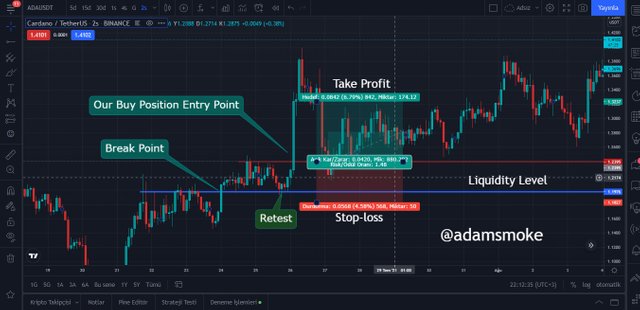
- The screenshot above shows the 2-hour chart of the ADA-USDT pair.
- After receiving our transaction confirmation, as seen in the screenshot; We take our position at our entry point 1.2395 USDT.
- Then our Risk/Reward ratio will be 1.48; Our take profit level is 1.3237 USDT with 6.78%. Our stop-loss level is; With 4.58%, it is our 1.1827 USDT level.
BRB Short Position
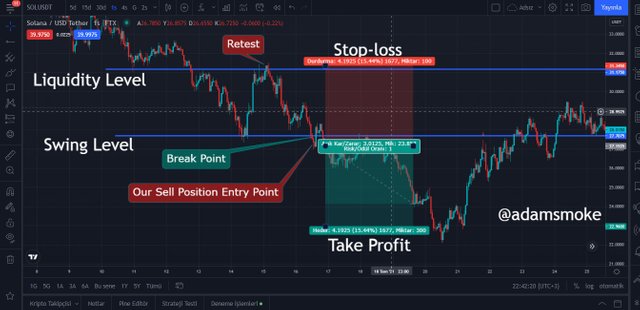
- The above screenshot shows the 1-hour chart of SOL-USDT pair.
- After receiving our transaction confirmation, as seen in the screenshot; After our entry point is broken, we take our position at 27.1525 USDT level.
- Then our Risk/Reward ratio will be 1; Our take profit level is 22.9600 USDT with 15.44%. Our stop-loss level is; With 4.19%, this is our 31.350 USDT level.
MSB Long Position
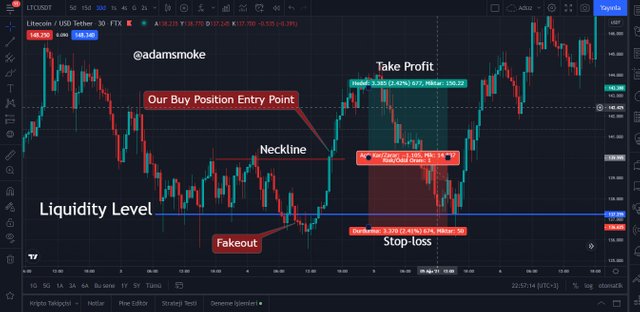
- The above screenshot shows the 30-minute chart of LTC-USDT pair.
- After receiving our transaction confirmation, as seen in the screenshot; our entry point is 139,995 USDT.
- Then our Risk:Reward ratio is 1; Our take profit level is 143,380 USDT with 2.42%. Our stop-loss level is 136,625 USDT with 2.41%.
MSB Short Position
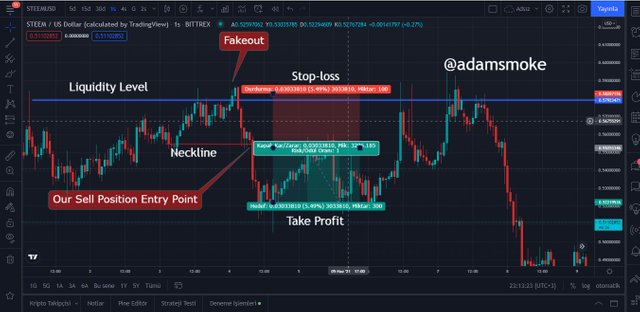
- The screenshot above shows the 1-hour chart of the Steem-USD pair.
- After receiving our transaction confirmation, as seen in the screenshot; our entry point is 0.53253346 USD.
- Then our Risk:Reward ratio is 1; Our take profit level is 0.52219536 USD with 5.49%. Our stop-loss level is 0.58287156 USD with 5.49%.

Conclusion
I think we learned well what the liquidity levels are in this share. I wanted to explain and show that if we want to trade at liquidity levels, we can easily be hunted in our transactions without trend confirmation or trade management.
Liquidity levels are price levels that many traders see as easy money making points. However, we need to be careful in our transactions and it is quite possible for us to make good profits at these points by following accepted strategies. As we explained in our article, MBS and BRB strategies protect us from being trapped while trading at liquidity levels. However, as with every trading method, there is no 100% accuracy in these trading methods. For this reason, the point we should never forget during our trading is to use stop-loss.
Thanks again to everyone who read my homework. I would also like to thank professor @cryptokraze for this nice and instructive assignment. Steemit crypto academy family, see you in our next lesson.