Introduction
Hello to everyone,
In this post, there will be assignments of this week's lecture given by professor @wahyunahrul. Our topic is about the effect of our emotions on the market and the “Fear and Greed Index” indicator. I think it will be a very good sharing. Let's start!

Question 1
Explain why emotional states can affect cryptocurrency price movements?
Cryptocurrency markets are a vibrant market. I used the word live in this sentence in its literal sense. Because there are many factors that determine the direction of the cryptocurrency market, but first of all, we are the traders. In general, the factor that determines the price of a cryptocurrency is the amount of supply and demand. This is directly proportional to the buying and selling of traders. Therefore, the more an asset is bought, the higher its price will be, the more it is sold, the lower the price.
Considering that the people we describe as traders are us and we do not forget that we are also human, it is impossible to think that cryptocurrency price movements are not affected by emotional states. Because, after all, human beings are creatures that live with their emotions.
Man has more than one emotion; fear, haste, jealousy, love, greed, etc. The emotions we enumerate greatly influence our thoughts and actions. E.g; We may like or envy the jacket we have seen on someone else. Regardless, as a result, we want and buy this jacket. The same is true for the cryptocurrency market. A positive news from a friend can lead us to a wrong trade.
As a result, we are human and most of our actions are the result of our emotions. This rule also applies in the cryptocurrency market. When a certain coin goes up, we want to buy that coin, or when it goes down, we want to sell it. Therefore, emotions or emotional states directly affect the cryptocurrency price for many reasons. What we need to do at this point is to trust ourselves and be cold-blooded, so that we can make better decisions. Even if emotional situations affect the cryptocurrency market if we make more accurate decisions; We must know how to open the right position at the right time.
The right trade is already; It is a trade where we know when we can buy or sell.

Question 2
In your personal opinion, is the Fear and Greed Index a good indicator of the market's emotional state? if not, try to give reasons and examples of other similar indicators for comparison.
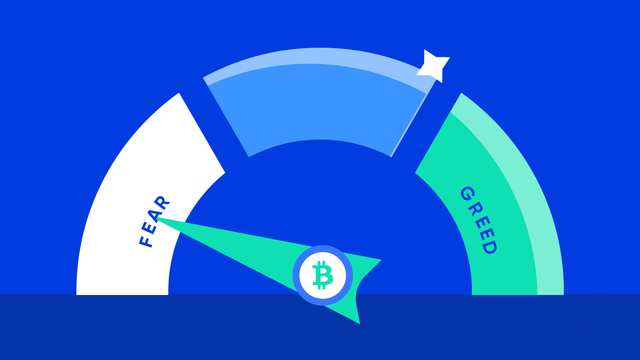
First of all, I would like to briefly talk about the Fear and Greed Index Indicator so that we can fully understand my answer to this question.
| Range | Market Emotion |
|---|---|
| 0-20 | Extreme Fear |
| 20-40 | Fear |
| 40-60 | Neutral |
| 60-80 | Greed |
| 80-100 | Extreme Greed |
- If this indicator is generally between 0-40 values; this tells us that there is fear over the market and there is a concentration of selling transactions on the market. This can be considered as a buying opportunity for us.
- 40-60 values are considered normal and are called natural. This means that the market is calm.
- Values of 60-100 indicate that there is greed on the market and there is a concentration of purchases on the market. This can be considered as a sales opportunity for us.
The Fear and Greed Index indicator is used daily, not instantaneously, unlike other indicators. For this reason, it is not recommended to be used in short-time trades such as scalping trading or in very long-term trades (3-5-10 years).
In my opinion, the Fear and Greed Index indicator is a very clear indicator. Because it is easy to use and everyone can easily understand what the indicator is saying. It is an indicator of the state of the market. To see this more clearly, let's take a look at how the Fear and Greed Index Indicator and the Bitcoin price chart move in a temporal range that we have determined.
- For this, we first visit the alternative.me platform and examine its graphic.
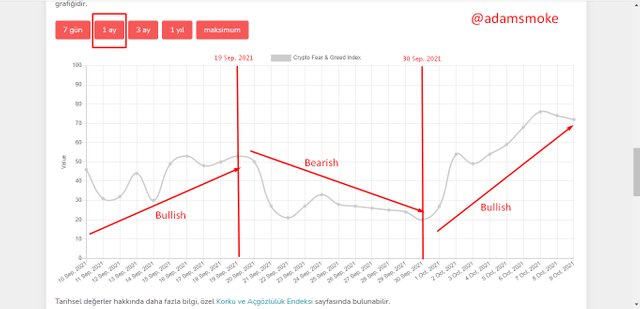
As we can see in the screenshot above, on the market;
- There is a Bullish from 10 Sep, 2021 to 19 Sep, 2021.
- From 19 Sep, 2021 to 30 Sep, 2021 there is a Bearish.
- From 30 Sep, 2021 to 9 Oct 2021, there is a Bullish again.
Now let's examine the movements of Bitcoin in the same time frame via the Tradigview.com Platform.
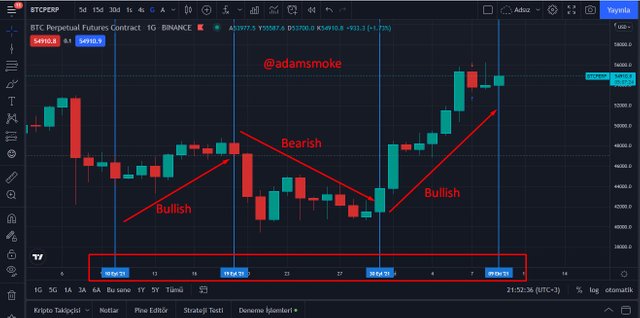
As we can see in the screenshot above, on the market:
- There is a Bullish from 10 Sep, 2021 to 19 Sep, 2021.
- From 19 Sep, 2021 to 30 Sep, 2021 there is a Bearish.
- From 30 Sep, 2021 to 9 Oct 2021, there is a Bullish again.
If you have noticed, the price chart and the Fear and Greed Index chart made the same turns on the same dates and moved within the same trends. As we can see from here, the Fear and Greed Index indicator produced very accurate signals and worked correctly, as well as being easy to use and understand.
Although the Fear and Greed Index Indicator produces accurate signals; It is not correct to use any indicator alone when trading. Because no indicator gives 100% accurate results and can make mistakes. Therefore, we should use additional indicators as confirmatory. These can be many indicators; MACD, EMA, ADX, RSI, etc. Since the purpose and values of each indicator will be different, it would be more appropriate to use additional indicators according to our trading style.

Question 3
Give your personal opinion on what data should be added to the Fear and Greed Indicator.
Here is the data the Fear and Greed Index Indicator uses:
- Market Volatility (25%)
- Market Volume and Momentum (25%)
- Social Media (15%) (Twitter and Reddit)
- Survey (15%) (Currently suspended)
- Coin Dominance Against Cryptocurrency Market (10%)
- Trends (10%)
The details of the above data have been nicely given by the professor in his lecture. The Fear and Greed indicator can actually get quite enough data. However, there are still a few things I would like to add.
Social Media: Social media platforms are very popular today and the number of users is quite high. Although there is a wide range of social media platforms, it may be a little insufficient to collect data only from Twitter and Reddit platforms. Because nowadays; Facebook, Instagram, youtube, etc. There are many different platforms and the user numbers of these platforms are not numbers that can be underestimated or ignored.
Survey: As for the survey data, stopping it was a wrong move in my opinion. However, as I said, if the range of social media platforms can be expanded, the need for survey data may disappear altogether.
As we know (as his professor mentioned in his lecture), the Fear and Greed indicator is currently only valid for Bitcoin. Although this indicator is a new indicator; other cryptocurrencies should definitely be added. Because cryptocurrencies have become quite popular and it is known that there are more than two thousand cryptocurrencies today. In a market with so much diversity, an indicator based only on Bitcoin seems insufficient to me.
Another missing aspect of the indicator is time. We all know that it is a daily indicator, but everything can change in a minute in the cryptocurrency market. Therefore, temporal additions can be made. We all know that there are data taken separately from many points. Therefore, as in the price chart, 1 minute, 3 minutes, 5 minutes, etc. It would be a silly idea to expect this indicator to work on very short timeframes. But instead of 1 day; Adding temporal data such as 4 hours or 3 hours can make it a more useful indicator.
Another data that I think should be added is (although not very different): getting data only through the Google search engine may cause many internet users to be unaware of their searches. Because although Google is a large search engine, there are many different search engines available today. While some countries have their own search engines, there are also major search engines around the world. The best example of this; It could be the Yandex search engine. Because although yandex is a Russian search engine, it is a worldwide popular search engine and has a large number of users. I mean Yandex, etc., although not small search engines. Getting data from major search engines will contribute to a more accurate indicator.

Quesiton 4
Do a technical analysis for 2 to 3 days (maybe more) using the Feer and Greed Index and the help of other indicators. Show how you made the decision to enter the cryptocurrency market and explain the results of your trade (Screenshot Required)
In this section, I will trade with my Demo account on the Tradingview platform.
Since Fear and Greed is a daily indicator, it would be more appropriate to do our chart analysis on high time frames. However, I will use shorter timeframes to get faster results. Because I want to share the result of my procedure with you.
- First of all, we need to know the value of the Fear and Greed Index indicator. We can easily access it from the alternative.me platform.

- As we can see in the screenshot above, our Fear and Greed Index rate is 72. This shows us that there is a greed over the market. At the same time, selling transactions are high in a market dominated by greed, so we are getting the signal that we will call our position as a sell.
As we have said before, no indicator should be used alone. Therefore, I will additionally use the EMA21-55 indicators during my trading to execute my trade.
EMA55 and EMA21 Buy/Sell Signal:
- If the EMA55 line crosses the EMA21 line from top to bottom, it gives a “Sell” signal.
- If the EMA21 line crosses the EMA55 line from top to bottom, it gives a "Buy" signal.
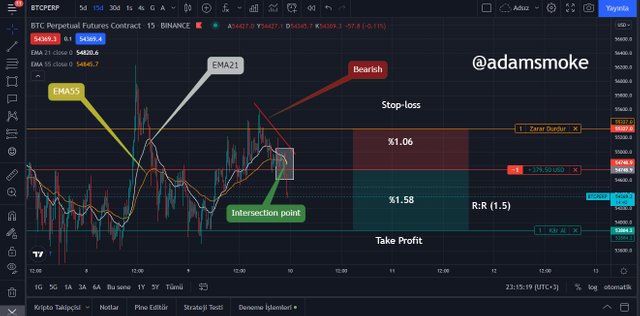
As you can see in the screenshot above;
- Before entering the trade, we do not forget that the value of the Fear and Greed indicator is 72. This signals us that we will seek a sell position.
- Later, when I look at our price chart, I see that the EMA21 line crosses the EMA55 Line from the top down. This gives us a sell signal.
- Then, without wasting time, I open my position as "Short".
- Then I set the highest peak where the price started to fall as the Stop-loss point. I place my take profit level slightly above the lowest point of the price, with the R:R reward ratio not less than 1:1.
- Entry Price: 54748.9 USD
- Stop-loss: 55327 USD
- Take Profit: 53884.2 USD
- Risk:Reward ratio: 1.5
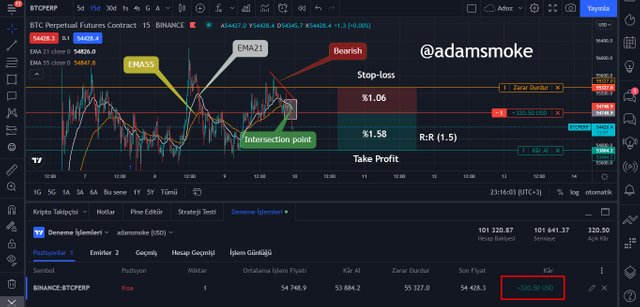
While I was writing this article, the market had a small uptrend; In order not to lose the amount I earned, as you can see in the screenshot, I closed the position at the profit level of 320.50 USD.

Conclusion
As we have said before, it is impossible for anything that people are in to be unaffected by emotional states. In this post, we tried to elaborate on the effects of these emotional states on the cryptocurrency market.
The Fear and Greed Index indicator is among the easiest to use. Although it is a beautiful and useful indicator in many ways, it has shortcomings. I have tried to address these shortcomings in my sharing as much as I can. As time progresses, like everything else, the Fear and Greed Index indicator will improve itself, of course. Although it is not very popular to use, I can recommend you to take a look at this indicator during your trades.
Thank you professor @wahyunahrul for this excellent lesson and everyone who read my post so far. I wish you all a healthy and beautiful day.
CC: @wahyunahrul

Hi @adamsmoke, Thanks for taking my class.
Based on the homework that you have made, here are the details of the assessment you get:
My Reviews and Suggestions:
You have completed the given task.
The data suggestions you provide for the Fear and Greed Index in question number 3 are too general, please try to provide other data suggestions.
You show the steps in making decisions using Fear and Greed and supporting indicators very well and completely.
Use italics only for a few words that are needed.
Thank you!
Downvoting a post can decrease pending rewards and make it less visible. Common reasons:
Submit