Hello Everyone
First of all, I wish everyone who read my homework a good and healthy day. The topic of this week's lesson is Pivot Point.

Pivot Point
Traders who trade on any asset use a variety of analysis methods. Traders who will trade during the day need these analysis methods more. We need to determine the direction of the asset we will trade or to identify the support/resistance zones. At this point of need, we meet our need for the pivot point.
So what is a pivot point?
It is a system that allows us to determine the direction of the market by using various mathematical methods to use the fluctuations in the market and to predict these fluctuations. At this point, the Pivot Point appears as a technical analysis indicator on the chart. This technical analysis is a price balance created by examining the movements of an asset in the previous day. The direction of the market is determined by comparing the instant price and the pivot point price. The pivot point also indicates possible support and resistance points. It uses levels at or near these points, identifying possible support and resistance points, previous lows or highs.
When traders use this system, a possible pivot point on the current price is calculated using the previous high, low and closing levels.They used to calculate these transactions manually before. But now, thanks to advanced systems, we can apply it directly on the chart as an indicator. All of the pivot point levels have a mathematical formula. However, as we said before, we can use these calculations as an indicator without going into them.

Pivot Points Levels
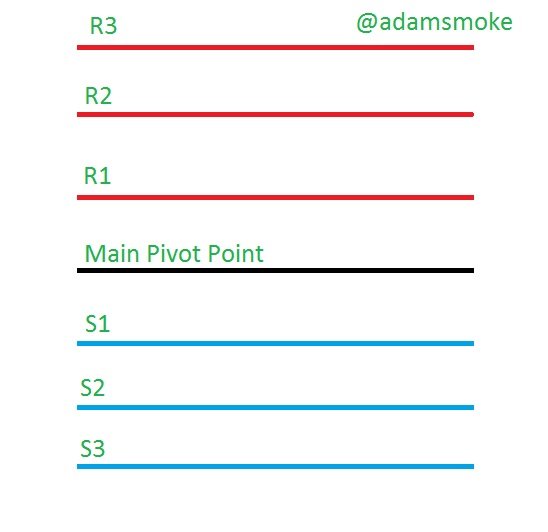
When calculating Pivot Points as we have mentioned before, we know that they are calculated according to the lowest, highest or close levels of the previous period. These levels are detailed in the table below.
| Pivot Level | Details |
|---|---|
| Main Pivot Level (PP) | This pivot level is our middle pivot level and is our main pivot point. |
| Support 1 (S1) | This level is our first support level below PP. |
| Support 2 (S2) | This level is our second support level below PP and S1. |
| Support 3 (S3) | This level is our third support level below PP, S1 and S2. |
| Resistance 1 (R1) | This level is our first resistance level above PP. |
| Resistance 2 (R2) | This level is our second resistance level above PP and R1. |
| Resistance 3 (R3) | This level is our third resistance level above PP, R1 and R2. |
These lines, which we show with the table, appear on the graph as in the picture below.
So what do these levels mean?
Main Pivot Point (PP)
This level helps us determine the direction of the market, as we said before. If the price is above PP, it represents bullish. If the price is below PP, it represents Bearish to us.
Support 1 (S1)
This level is our initial support level where the price will react and it is possible to reverse the market trend to Bullish. This level is the oversold zone and purchases can be made at this level, but if the price falls below this level, the price is expected to fall further.
Support 2 (S2)
This level has the same logic as S1. Again, it is our second support level where the price will react and the market can turn into Bullish by moving in reverse. As in S1, this level is the oversold zone and buying takes place at this level. However, if the price falls below this level, more bearish is expected.
Support 3 (S3)
It still has the same logic at this level. Again, it is our third support level, where the price will react and move reversely and the market can turn into Bullish. Like S1 and S2, this level is the oversold zone and buying takes place at this level. However, if the price falls below this level, more bearish is expected.
Resistance 1 (R1)
This level is our first resistance point where the price will react and the market may turn Bearish by moving backwards. This level is the overbought zone and sell transactions start at this level. However, if this price level is broken, more bullish of more prices is expected.
Resistance 2 (R2)
This level has the same logic as R1. At the R2 level, it is our second resistance point where the price will react and the market may turn into Bearish by moving backwards. This level is the overbought zone and sell transactions start at this level. However, if this price level is broken, more bullish of more price is expected.
Resistance 3 (R3)
This level has the same logic as R1 and R2. At the R3 level, it is our third resistance point where the price will react and move reversely and the market can turn Bearish. This level is the overbought zone and sell transactions start at this level. However, if this price level is broken, more bullish of more price is expected.

Pivot Point Levels Calculation
As we mentioned before, we said that certain mathematical formulas are used when making Pivot calculations. We will understand more clearly how these formulas are calculated with the tabular representation.
| Pivot Level | Details |
|---|---|
| Main Pivot Level (PP) | Daily High + Daily Low + Close / 3. |
| Support 1 (S1) | 2 x Pivot Point – Daily High. |
| Support 2 (S2) | Pivot Point – Daily High – Daily Low. |
| Support 3 (S3) | Daily Low – 2 x Daily High – Pivot Point. |
| Resistance 1 (R1) | 2x Pivot Point – Daily Low |
| Resistance 2 (R2) | Pivot Point + Daily High – Daily Low |
| Resistance 3 (R3) | Daily High + 2 x Pivot Points – Daily Low |
The calculation method we show with this table is the classical pivot point level calculation method.
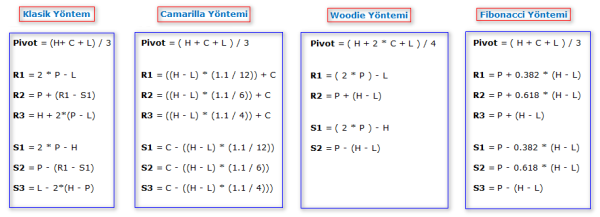
There are many Pivot point calculation methods similar to this calculation method. We can see some of them in the picture below.
Abbreviations in formulas:
- Pivot Point: P
- Highest Price: H
- Lowest Price: L
- Closing Price: C
- Support Points: S1, S2, S3
- Points of Resistance: R1, R2, R3

Add Pivot Point Indicator
I will show this process on Tradingview.com with screenshots.
Step 1
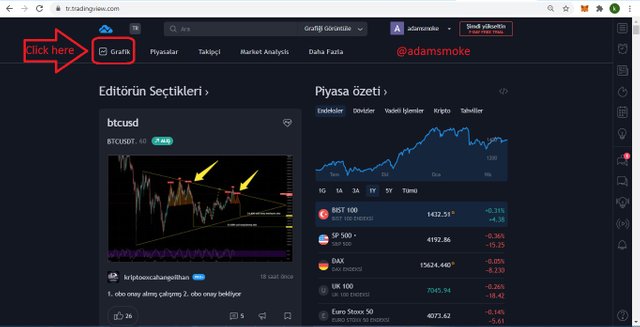
- First, we enter Tradingview.com. (https://tr.tradingview.com/)
- Then we select a pair of assets we want by clicking on the "Graphic" section from the area I indicated with the box. I chose the BTC/USDT pair.
Step 2
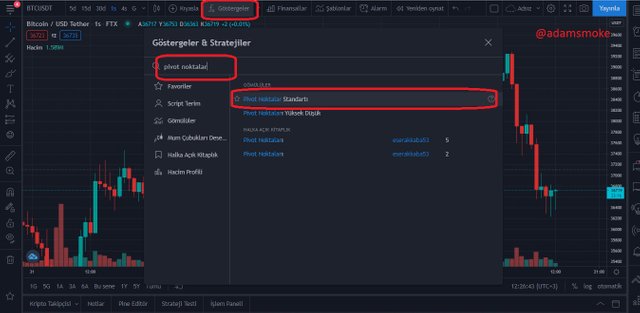
- Then we click on the indicators (fx) that I show with the box and write Pivot Point in the menu that opens.
- Then we select the Pivot Point Standard option and our indicator is added.
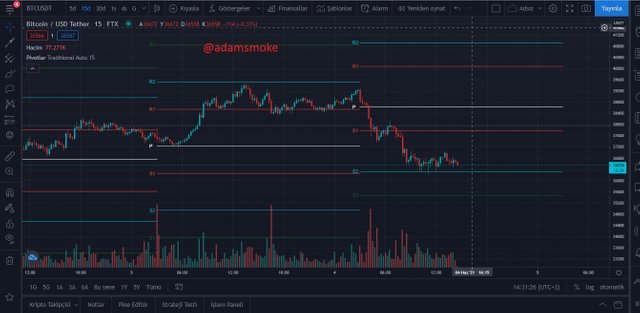
Step 3
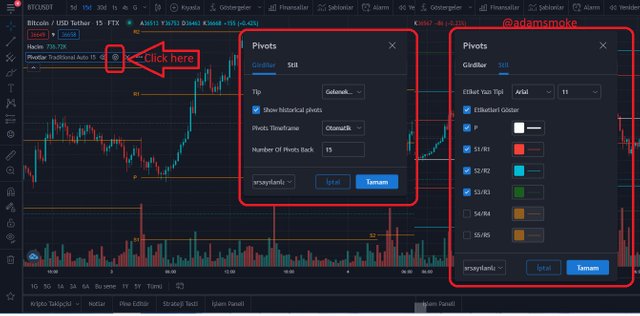
- Later, when we click on the settings button that I show with the box, in the "Input" section, we are greeted with the options of pivot types, time frame and number of pivots.
- You can choose what you want from these options. I have traditionally chosen the pivot type, the time frame automatically and the pivot number as 15.
- In the other "Style" section, there are line color options, line types and text styles options for the pivot points. We can change them as we wish.
- We can also choose how many resistance and support lines to use in this section. I chose not to use the S4/R4 and S5/R5 options.

How Pivot Points Work
As we mentioned before, Pivot Points work logic allows us to see the market trend and make price predictions. So how do we predict the direction of the market and determine what price will do at any pivot point?
We have already shown the levels of pivot points. Pivot Point (PP) point helps us to see the direction of the market. If the price is below PP, it tends to be bearish and above it bullish.
There are two types of moves the price will make at other pivot levels. Once the price reaches any of the pivot levels support/resistance, if it breaks down the price will continue to bullish/bearish, otherwise the price will reverse and the bullish/bearish will continue.
I show you this with a screenshot.
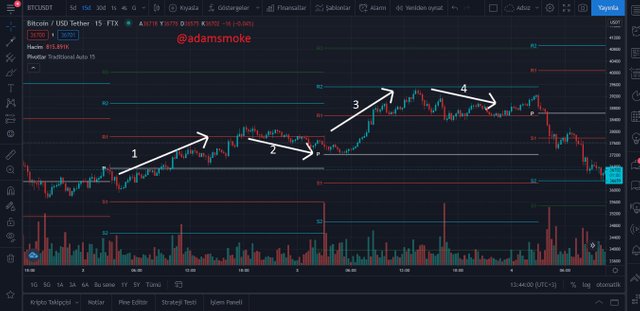
I opened the 15-minute chart of the BTC/USDT pair and let's see what happens on the 2-day Trend.
- First of all, the point we need to pay attention to is that the price is above the Pivot Point within 2 days. This shows us that the market is a bullish.
- Then we see that the price has just passed the PP point and entered a bullish trend by breaking the PP point in the area indicated by the arrow number 1.
- This rise continued until our first resistance point, R1. Although it breaks a little, we see that the price has decreased again in the area indicated by the arrow number 2 and reached the PP point of the next day.
- We see that these fluctuations act with the same logic on the other day.
- The difference on the second day is that the price comes to the R1 level after the PP point and breaks this level and bullish to the R2 level. We can understand this by looking at arrow number 3.
- Then, in the area I indicated with the arrow number 4, the price could not break the R2 level and regressed to the R1 level.
As we can see in this example, Pivot Points, as we said before, determine the direction of the market by movements where the price is above or below the PP point. When the price reaches any level, it either breaks that level and continues its bullish/bearish movement, or it encounters a reaction at the level it reaches and switches to bullish/bearish movement in the opposite direction.

Pivot Point Reverse Trading
I open the BTC/USDT pair and its 15-minute chart to show the Reverse Trading method with Pivot Point. Again in this example, I will display on the 2-day Trend.
First of all, let's briefly recall what Reverse Trading is.
Reverse Trade:
It is called when we open a trade in the opposite direction by waiting for the candle to close when the market has 20% or more price fluctuations in 1 day or other time periods. The important point to note here is that the previous close is close to the opening price.
We can now examine the Pivot point Reverse trade movement within the 2-day Trend.
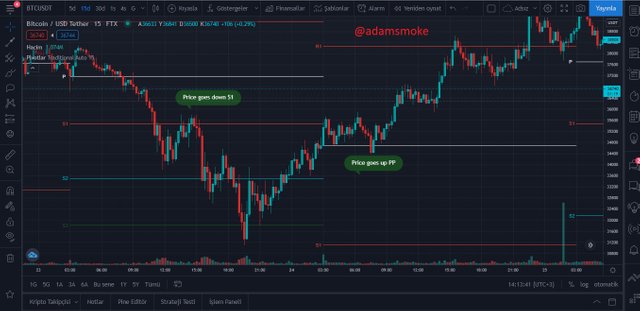
- In this chart, we see that the market is bearish in the 1st day cycle. Then we see that the price breaks the S1 level and approaches S2. however, we see that the price is bullish without falling to the S2 level.
- We know that price will face a backlash when it returns to point S1. We are waiting for the candle close then we already know that the market is in a bearish trend.
- After examining the newly opened candle, we can open a Reverse Trade at this point and profit between S1 and S2 as the market tends to bearish.
- Likewise, when we look at the 2nd Day Trend, we see that the price is above the PP point and is in a bullish trend.
- When the price reaches the PP point, it will either break the PP point or move in the opposite direction. Since we know that the price is in a bullish trend, we can still make a profit by trading reverse at the point I showed.
Of course, while performing these transactions, we should not forget to use stopl-loss as in every transaction.

What could be a common Mistakes in Trading with Pivot Points
In trading with a pivot point, as in any trade, many mistakes can be made. We should never forget that no indicator gives us 100% results in our trading and we should act accordingly. So how do we do this? We can do this by making more use of auxiliary indicators. (RSI, MACD, etc.)
We should avoid trading if price is constantly breaking the Pivot Point and moving erratically above and below if we are having trouble determining the direction of the market.
As we said before, we should do our trades with Pivot Point during the day. If we are going to make long-term investments, it can mislead us. Because Pivot Point is among the indicators that should be used daily.
When we determine the direction of the market, we should avoid trading in the opposite direction of the market, except for Reverse trading points.
We should not be greedy as we should be in every trade. We should be able to close our position at the point where we will close our position.
As in all our transactions, we must put stop-loss, otherwise we will face big losses.

What could be the reasons For Pivot Points is Good.(Pros/Advantages)
The Pivot Point indicator is a really good indicator.
Advantages
- It is one of the easiest and most understandable indicators.
- Even those who are new to trading can use it easily.
- Provides convenience in determining support and resistance points.
- It allows us to earn good profits in a short time as it is used in daily trades.
- We can use it with many indicators. It works in harmony with almost every indicator.
- It makes it easier for us to see the positions that we will buy and sell in our transactions.
We can count many more advantages such as these. However, as in every trade, we should determine the points we will buy / sell well in this trade and use stop-loss.

Apply the Pivot Points indicator in the Today chart (the day when you making this task) and set the chart for 15 minutes. Explain the market trend till the time of writing the task and how it will be next till the end of the day. You can give possibilities on both the side bearish and bullish.
Since I am narrating on the BTC/USDT pair in this assignment, I will also make the price prediction on the BTC/USDT pair. I opened our 15 minute chart and I'll show my forecast on my chart where I've added my Pivot Point indicator.
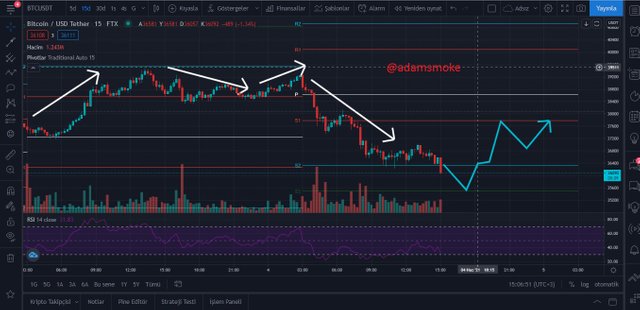
When we examine the movements of the BTC/USDT pair the day before, we see that the price is hovering above the PP point. this shows us that the market was bulish the previous day. This first bullish broke the R1 level to reach the R2 level and fluctuated between the R1-R2 levels throughout the day.
When we examine the chart for today, we see that the price is at a PP point. this shows us that the market is Bearish. When we look at the movement of the price, we see that it broke the S1 point 2 times and then regressed to the S2 point.
While I was doing the analysis, the price had a breakout at the S2 point. I think this breakout will reach the S3 point, but then it will not be able to break the S3 level and will go up again and reach the $37600 level at the S1 point. I understand this prediction from the fact that the price has broken the S2 point and when I look at the RSI level in this breakout, it is hovering around 30 levels. Once the price reaches the S3 support, the value of the RSI indicator will drop below 30 and the price will be at the oversold point.
At this point, traders will buy and the price will bullish to the S1 level.

Weekly Price Forcast For Crypto Coin: Chiliz (CHZ)
Chiliz Basic Information
Chiliz (CHZ) was launched in 2018 by Socios.com. Chiliz is an ERC-20 token. It runs on the Ethereum network and uses the blockchain database.
Chiliz is based on sports and entertainment themed. For this reason, many sports clubs create their own tokens through Chiliz. This is to ensure interaction between sports organizations and those who support these organizations. And in this way, it is to ensure that the supporters make money. It also ensures that the supporters have a say in the decisions taken in sports clubs through the coins they own.
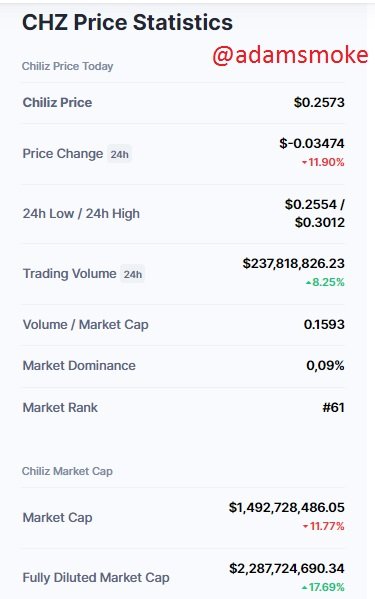
I would like to show you the Chiliz market data with the screenshot I took from the coinmarket platform.
Why I chose Chiliz?
As seen in the Coinmarket data, it is a cryptocurrency with a very high daily trading volume. In addition, Chiliz's sports and entertainment theme, providing the opportunity for many sports clubs to issue their own cryptocurrency is another point that attracts me.
Chiliz (CHZ) Technical Analysis
I will give you a price estimation by presenting a clear and clean graphic as best I can.
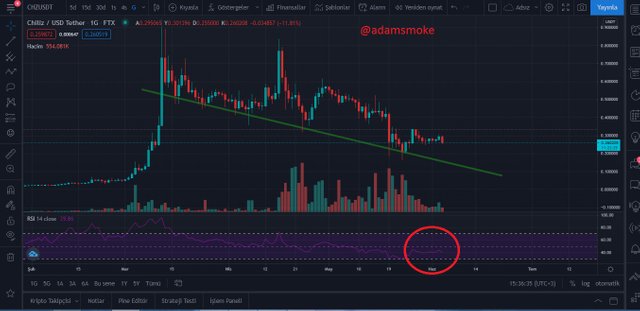
- First, by opening Chiliz's daily chart, I understand that the trend of the market is a bearish. At this point, when I look at the RSI level, I see that it is below 50. However, I still see that it hasn't gone oversold. Therefore, I think the price will continue to drop a little more. Then I switch to my 4-hour chart.
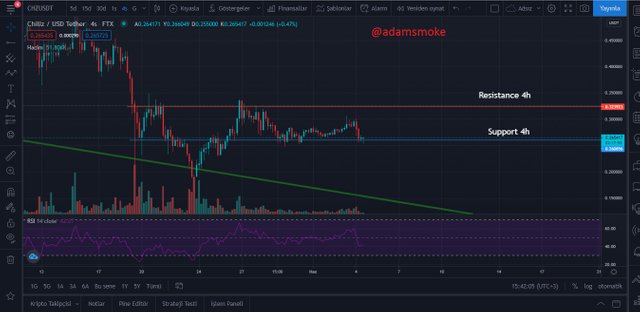
- I set myself a support and resistance point on my 4-hour chart. Then I switch to the 1-hour chart to identify more detailed support and resistance points.
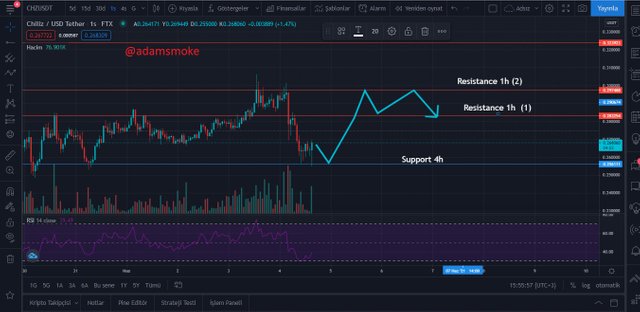
- When I come to my 1-hour chart, I see that the price is hovering at the 4-hour support point.
- Then I draw 2 resistance levels at 2 different points and determine the reaction points that the price will meet first.
- When I look at the RSI indicator, I see that the bullish has passed. However, the RSI gives more positive signals on the daily chart. so I remember the RSI was moving around 30 on the daily chart and the market was in a bearish trend.
- My price prediction will encounter a reaction when the price reaches my 4-hour support point. This is because the RSI level will fall below 30, entering the oversold region, and traders will buy high, causing the price to rise.
- However, since the market is generally Bearish, I think the price will rise a little and fluctuate between my 1-hour resistance points Resinstance 1h (2) and Resistance (1).
The instant price of CHZ is around $0.2680. I predict that this price will bounce off my support at $0.2561 and will be around $0.2832 during the week.

Conculusion
At the end of this lesson, I understood how simple and understandable the pivot indicator is. I realized that the pivot indicator could be used better in our day-to-day trading and is essentially based on support/resistance points. We have seen in the price prediction section how easy this indicator is when we use it properly. Thanks to this indicator, I could easily determine the trend of the market during the day.
We have seen in our reviews that it gives more accurate signals on the 15-minute charts and 2-day trends during the day. Therefore, it would be more accurate to use it in these time periods.
As we do in every trade, we should not forget to use stop-loss in this trade.
Thanks again everyone for reading my assignment.
Thank you very much to professor @stream4u for this nice and instructive lesson.
Hi@adamsmoke
Thank you for joining The Steemit Crypto Academy Courses and participated in the Homework Task.
Your Homework Task verification has been done by @Stream4u, hope you have enjoyed and learned something new.
Thank You.
@stream4u
Crypto Professors : Steemit Crypto Academy
#affable
Downvoting a post can decrease pending rewards and make it less visible. Common reasons:
Submit
Thanks for your review professor. As in your other lessons, I have enjoyed and learned something new in this lesson.
Downvoting a post can decrease pending rewards and make it less visible. Common reasons:
Submit