Indroduction
Hello Everyone
First of all, I wish everyone a nice and healthy day. Our topic today is Bollinger Bands. The professor explained this topic in detail in the lecture. I will give you information about Bollinger Bands in my homework as much as I can.

Define the Bollinger Bands indicator by explaining its calculation method, how does it work? and what is the best Bollinger Band setup?
One of the most important indicators in technical analysis is Bollinger Bands. Bollinger Bands are one of the indicators that help us to follow Trends on the market, buy/sell zones.
In the early 1980s, John Bollinger created the Bollinger Bands, which are named after him. Its main purpose is to understand the volatility of movements in stock prices. This method reached its goal after a while and started to be used in a popular way.
What are Bollinger Bands and how do they work?
Bollinger bands have been one of the main tools of technical analysis today.
Bollinger bands; It is a channel-shaped indicator formed by the wrapping of a simple moving average, two bands working as support, resistance and trend. Bollinger bands can also be called Volatility bands.
So what is this Volatility?
Volatility is the change in the price of an asset over a period of time in financial markets. Volatility varies according to standard deviation.
We can easily see volatility in Bollinger Bands. Because as volatility increases, Bollinger bands widen. Bollinger bands narrow as volatility decreases.
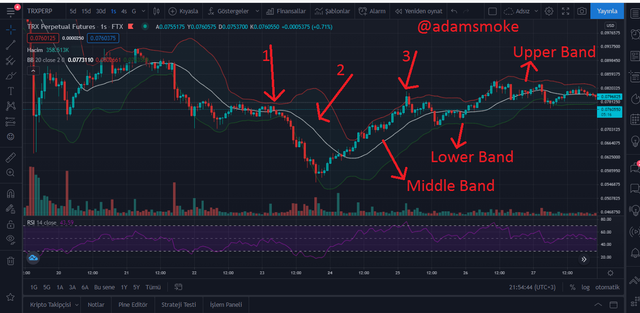
- As we can see on the TRX chart in the screenshot above, the area indicated by arrow 1 is low in Volatility. Therefore, the Bollinger band is narrow in width.
- However, where I indicated with the arrow number 2, Volatility is high. Because the Bollinger Band has widened.
- In some special cases, the price goes out of the Bollinger band. You can see this in the area I indicated with arrow number 3.
Bollinger bands also allow us to make price predictions.
- If the price is in the Bollinger band, close to the upper band, we can say that it is high, if it is close to the lower band, it is low. (The lower, upper and middle bands are shown in the screenshot.)
The formula or method for calculating the Bollinger Bands indicator
Bollinger bands formula:
Moving Average = Sum of prices over x days/number of days
It is said that using the 20 moving average in the Bollinger band will give more accurate signals. However, 10 and 50 are used in moving averages.
The lower, upper and middle bands we have shown before are formed as a result of the volatility of this moving average.
- For the upper band, it is created by adding 2 standard deviations to the moving average.
- For the lower band, it is formed by subtracting 2 standard deviations from the moving average.
These standard deviation values are valid for 20 moving averages. The standard deviation of 10 moving averages is 1.5. In the 50 moving average, it is formed by taking 2.5 standard deviation values.
How Does the Bollinger Band Work?
The purpose and operation of Bollinger bands are generally used to determine overbought and oversold points, to understand whether the price is high or low, and to determine volatility.
Volatilitiy
As we mentioned before, we can understand the volatility of the price from Bollinger bands. If Bollinger bands are narrowing, volatility is decreasing, if Bollinger bands are widening, volatility is increasing. We can show this again with a screenshot.
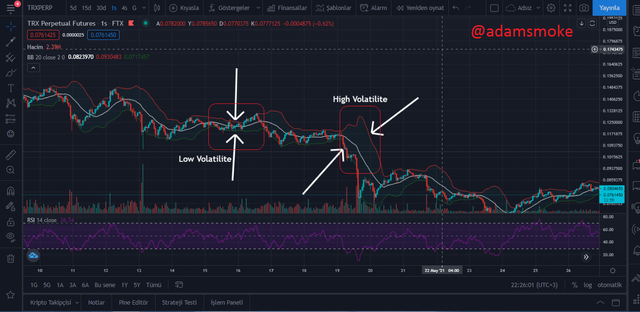
In the screenshot above, I have shown the highs and lows of volatility on the TRX chart.
Overbought and Oversold
Bollinger bands help us identify overbought and oversold areas as we have said before. But it would not be correct to say that it works in every market. It operates in a relatively calm and diversified market.
Overbought
If any asset is trading at high prices, it is called overbought. In Bollinger bands, the high price is the area where the price touches the upper band and is called overbought.
Oversold
Similarly, if any asset is traded at a low price, it is called oversold. In Bollinger bands, on the other hand, the low price is the area where the price touches the lower band and is called oversold.
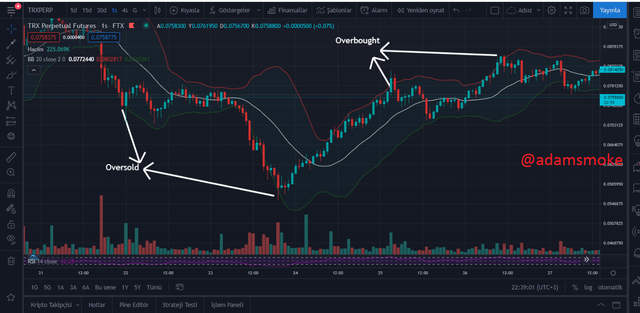
I tried to show the overbought and oversold points in this screenshot.
Best Bollinger Band Setup
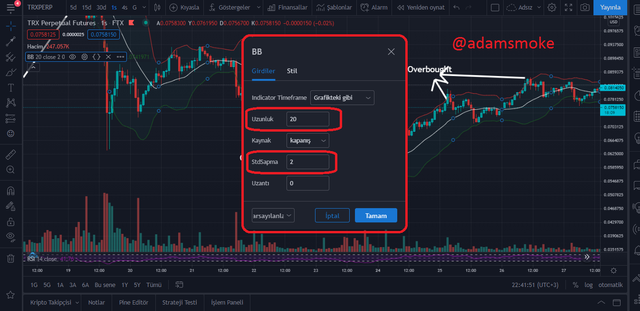
As we said before, we said that bollinger bands give the most accurate signals with 20 moving averages.
Therefore, when we enter the value of 20 in the Length section, the closing value in the Source section and the value of 2 in the Standard deviation section, we will have the most accurate Bollinger Band setup.
As we said before, we need to enter the standard deviation value as 1.5 if we enter the 10 moving average value, and 2.5 if we enter the 50 moving average value.

What is a breakout and how do you determine it? (Screenshot required)
Breakout is when any asset is bought/sold in high amounts in a short time and it breaks the support/resistance levels.
Breakout in Bollinger Bands, volatility in the market decreases when the bands narrow too much. This also heralds the news that there will be a breakout.
When this breakout occurs, the price moves out of the bollinger bands that have started to expand. For this reason, we can say that there may be a breakout where the bollinger bands are very thin. Let's reinforce this with a screenshot.
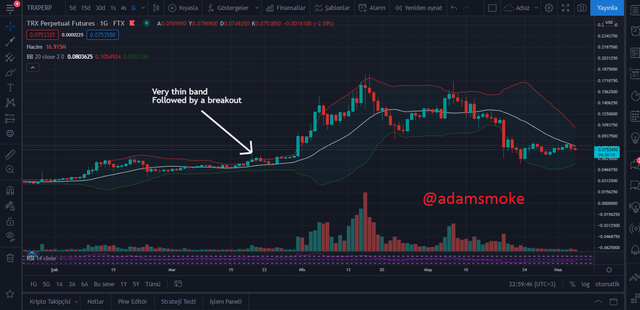
In this screenshot, I have shown that there will be a breakout on the TRX chart.

How to use Bollinger bands with a trending market? (screenshot required)
It is better to trade in a market that is trending on the Bollinger bands. We can also identify the trend by looking at the Bollinger bands. Because Bollinger bands move in the direction of the trend. When the market is in a downtrend, the bollinger bands are also bearish. When it rises, it shows an upward trend.
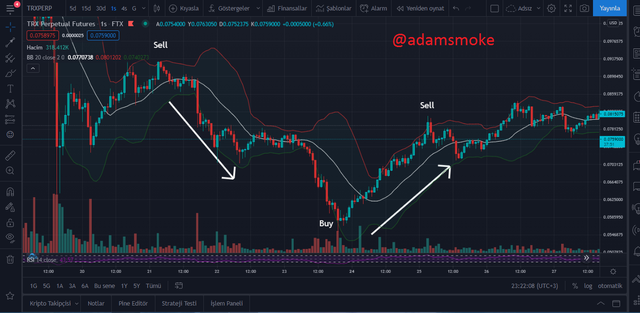
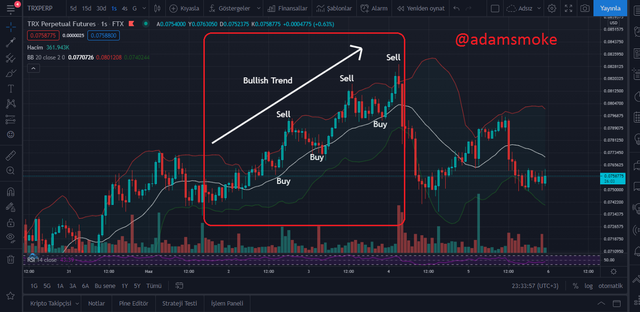
- As we can see in the screenshot, the bollinger bands move in the same direction as the market trend.
- Buying and selling is easier as I showed in a trending market. A sell is made when the price touches the upper band. When it touches the lower band, a buy is made.
A trending market has high volatility. If you are going to buy/sell within the trend, the buying and selling points may differ. In a downtrend market, the buying point is again made when it touches the lower band, but selling is done in the middle band instead of the upper band. Likewise, if the trend is up, selling is done when the price touches the upper band, but buying is done at the middle band. You can see this more clearly in the screenshots below.
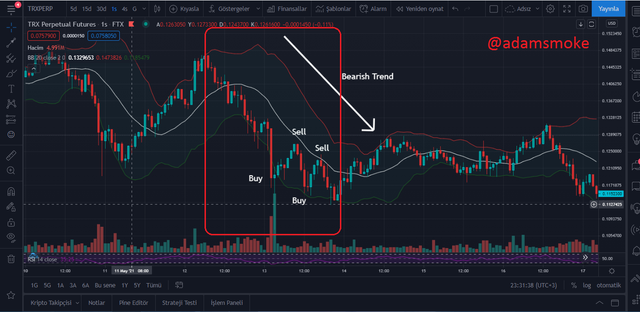

What is the best indicator to use with Bollinger Bands to make your trade more meaningful? (Screenshot required) (Screenshot required)
To me, I think I can use Bollinger bands in harmony with the RSI indicator, which I use as a confirmatory indicator in every trade.
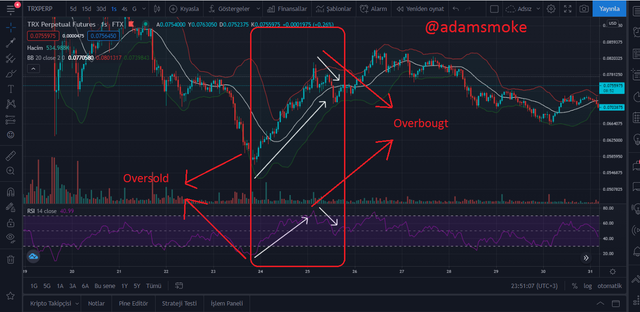
- As seen in the screenshot, the RSI and bollinger band indicators work in harmony on the TRX chart.
- We know that when the RSI is below 30, it is in the oversold region. Likewise, we know that there is an oversold zone when the price crosses the lower band. In this way, when we get the same signals from both indicators, we can execute our transactions.

What timeframe does the Bollinger Bands work best on?And why? (Screenshots required)
I think the timeframe when Bollinger bands work best will vary by trader. Because as a result of my investigations, I saw that it works in harmony in every time zone.
However, in my opinion, it is more reasonable to use it in the 1 hour time frame. Because I usually use the RSI indicator as a confirming indicator in my trades. In my opinion, the RSI gives the most beautiful and accurate signals in the 1 hour time frame. Therefore, I can say that the best time frame for me is 1 hour.
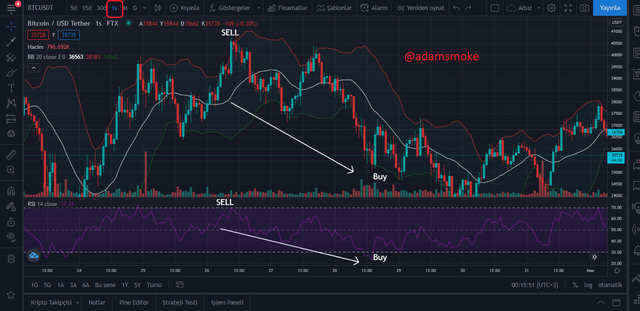
- In the screenshot, we can see that the RSI and Bollinger bands indicators work in harmony on the BTC/USDT pair.
- While the RSI is at 70 levels, we can see that the bollinger bands are giving a Sell signal.
- While the RSI is below the 30 level, we can see that the bollinger bands are giving a buy signal.
- As we can see from the screenshot, our two indicators work in harmony in a 1-hour time frame.
As I said before, you can use the Bollinger Bands indicator on any time frame. Choosing any timeframe will depend on your trading strategy.

Review the chart of any pair and present the various signals giving by the indicator Bollinger Bands. (Screenshot required)
I tried to show the signals of all the bollinger bands I could find on the daily chart of the BTC/USDT pair.
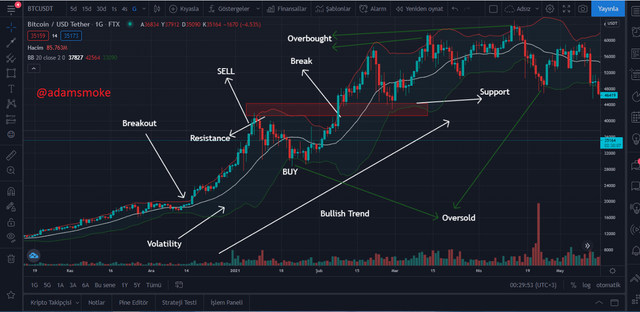
- If we start from the far left, at the point I showed with Breakout, the width of the bollinger bands has become very small. This gives us the news that there will be a breakout.
- Later, I understand that the market is in a bullish trend by looking at the bollinger bands.
- Then I showed the points where we can buy/sell.
- Overbought and oversold points are the points where we can buy/sell.
- Then I showed the point where a resistance point broke into support and broke.
- We can also see that the volatility increased after the Breakout, thanks to the bollinger bands.

Conculusion
- Today, we learned in detail about the bollinger bands indicator, which is among the popular indicators. We have seen the signals produced by Bollinger bands and what these signals mean.
- We know that not every indicator gives 100% accurate signals. For this, we have shown its compatibility with the RSI indicator, which is among the indicators that we can use compatible with the bollinger bands indicator.
- Finally, we showed the signals given by the bollinger bands indicator on the cryptocurrency pair chart.
- I think I learned pretty much everything about bollinger bands in this course.
Therefore, so thank you very much to professor @kouba01 for this nice and instructive lesson.
Also, thank you to everyone who read my Homework.
CC: @kouba01
Hello @adamsmoke,
Thank you for participating in the 8th Week Crypto Course in its second season and for your efforts to complete the suggested tasks, you deserve a 6.5/10 rating, according to the following scale:
My review :
An essay with acceptable content in which you passed on the various required tasks. What is lacking is the in-depth analysis of the various signals, with the absence of useful additions, such as tracking the price movement of the pair and giving the decision to enter or exit a position.
Thanks again for your effort, and we look forward to reading your next work.
Sincerely,@kouba01
Downvoting a post can decrease pending rewards and make it less visible. Common reasons:
Submit
Thank you professor. I will be more successful in your next lesson.
Downvoting a post can decrease pending rewards and make it less visible. Common reasons:
Submit