Introduction
First of all, hello everyone. Thank you in advance to everyone who reads my homework. I also wish everyone a healthy and beautiful day. Although we take care of our health, we can get sick during this difficult pandemic period. For this reason, I would like to express my condolences to the professor and I would like to express that I am happy that he has returned to us in a healthy way. Get well soon professor @kouba01, and thank you for this nice and educational lesson.
The topic of this week's lesson is the Ichimoku - kinko - hyo indicator. Before we move on to the task of this week's lesson, I would like to give a small and brief information about our topic so that we can better understand what is what while reading our homework.
The Ichimoku indicator is a technical analysis tool that combines multiple indicators on the chart. It was first developed by Japanese analysts in the 1930s, and it was in the 1960s that it became widespread. In general, we can describe its meaning as a look at the balance graph.
Ichimoku shows support and resistance levels, as well as a versatile technical tool that shows momentum and trend direction. The Ichimoku indicator consists of 5 lines. 4 of these lines are drawn by averaging the highest and lowest prices in the moving average method.
1-Tenkan Sen: 9 Period moving average (Highest price + Lowest price)/2
2-Kijun Sen: 26-day moving average (Highest price + Lowest price)/2
3-Senkou Span A: Tenkan sen and Kijun Sen are added together and divided by 2 and shifted forward 26 periods.
4-Senkou Span B: The highest and lowest values in the 52 periods are added together and divided into two and the resulting value is shifted forward by 26 days.
5-Chinkou Span: It is formed by moving the closing price back 26 periods. If this value is above the 26-period previous close, it indicates a bull market, and if it is below, it indicates a bear market.
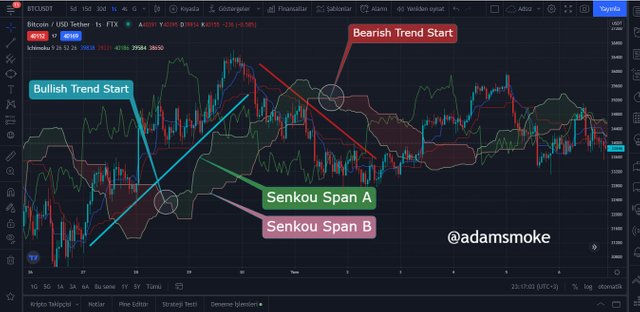
The area between the Senkou Span A line and the Senkou Span B line is called the Ichimoku Cloud (Kumo).

- In the above BTC/USDT pair chart, I have shown the lines on the Ichimoku indicator in detail so that you can better understand which lines they are.

Qestion 1
Discuss your understanding of Kumo, as well as its two lines. (Screenshot required)
Kumo
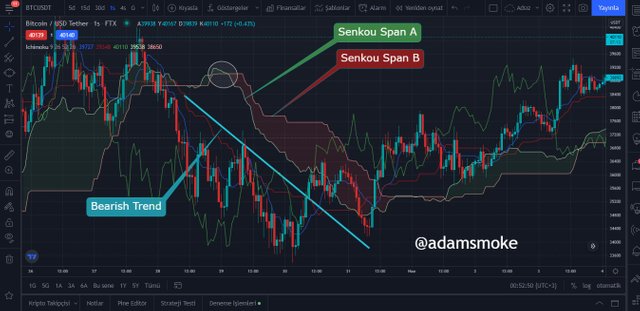
Kumo cloud, as we have briefly mentioned before, refers to the area between Senkou Span A and Senkou Span B. At the same time, we can say that Senkou Span A and Senkou Span B form the boundaries of the Kumo cloud. This area is the area that catches our eye the most in the Chart. The cloud helps us to understand whether the trend is bearish or bull. If the cloud is green, this indicates that the market is in a bull trend, and if the cloud is red, this indicates that the market is in a bear trend.
Green Cloud: Situations where the Senkou Span A is above the Senkou Span B line shows us that the price movements are in a bullish trend.
Red Cloud: When Senkou Span A is below the Senkou Span B line, it shows us that the price movements are in a bear trend.
If Senkou Span A and Senkou Span B are moving at a flat level, it shows us that there is no trend and the price movement is sideways.
Note: Although Kumo Cloud gives us information about price movements, success rates are higher than trend lines. Because the trend lines are not always formed properly and the information about the price is limited.
Senkou Span A
Senkou Span A is also referred to as leading span A and leading A. Senkou Span A is part of the Ichimoku indicator, as we mentioned earlier. As we mentioned before, Senkou Span A is calculated as (Tenkan Sen + Kijun Sen)/2 and a moving average is created and shifted forward 26 periods and takes its place on the chart. Senkou Span A allows us to follow price movements and also identify support/resistance levels. When Senkou Span A cuts Senkou Span B upwards, it indicates that an uptrend has started, while a downward cut indicates that a downtrend has started.
Senkou Span A
Senkou Span B is also referred to as leading span B and leading B. Senkou Span B is part of the Ichimoku indicator, as we mentioned earlier. As we mentioned before, Senkou Span B is calculated as (Highest Value + Lowest Value)/2 in the last 52 periods, and a moving average is created and shifted 26 periods forward and takes its place on the chart. Senkou Span A allows us to follow price movements and also identify support/resistance levels. When Senkou Span B cuts Senkou Span A upwards, it indicates that a downtrend has started, while a downward cut of Senkou Span A indicates that a downtrend has started.
Kumo Cloud Chart Pattern of Bullish Trend
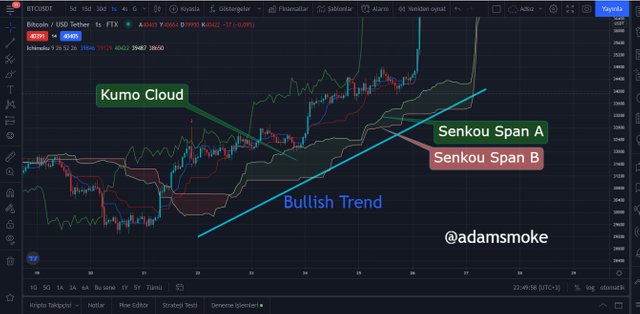
- As you can see on the BTC/USDT chart in the screenshot above, the Senkou Span A line is above the Senkou Span B line and the market is in a bullish trend. Also, as we mentioned before, the cloud is green and this directly indicates a bullish trend.
Kumo Bulutu Ayı Trendinin Grafik Modeli
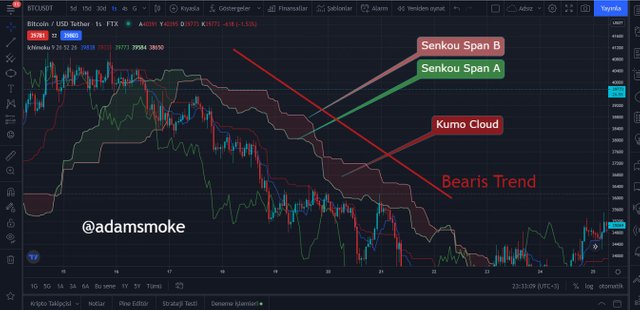
- As you can see on the BTC/USDT chart in the screenshot above, the Senkou Span A line is below the Senkou Span B line and the market is in a bear trend. Also, as we mentioned before, the cloud is red and this directly indicates a bear trend.

Question 2
What is the relationship between this cloud and the price movement? And how do you determine resistance and support levels using Kumo? (Screenshot required)
It has 3 important positions between the Kumo cloud and price action. With this; price on the rise, price on the downturn, and lateral (sideways) price movements. Let's take them one by one.
Kumo Cloud Support Levels at an Uptrend Price
We know that in an uptrend price move, the cloud moves below the price line. When we face such a situation, the cloud acts as a support. But the cloud is not a fixed support line at this point, at this point our cloud is our support zone. In this support zone, Senkou Span A creates one of our Support1 points for us and Senkou Span B creates one of our Support2 points for us. We can understand this more clearly if we show it on a graph.
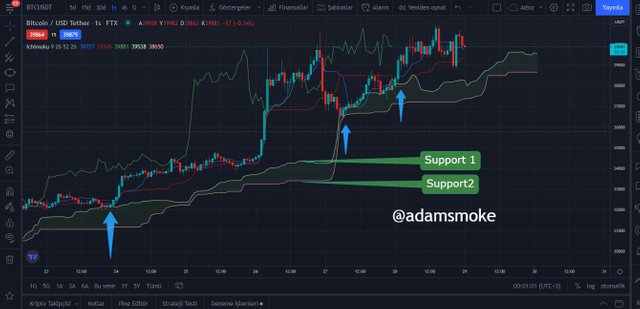
- As you can see in the screenshot above, Senkou Span A and B points acted as support at the points I indicated with the blue arrow and the price bounced back from these levels.
Kumo Cloud Resistance Levels at a Downtrend Price
We know that in a downtrend price move, the cloud moves above the price line. When faced with such a situation, the cloud acts as a resistor. However, the cloud is not in the form of a fixed resistance line at this point, at this point our cloud is our resistance zone for us. In this resistance zone, Senkou Span A forms our Resistance1 points and Senkou Span B forms our Resistance2 points. . We can understand this more clearly if we show it on a graph.
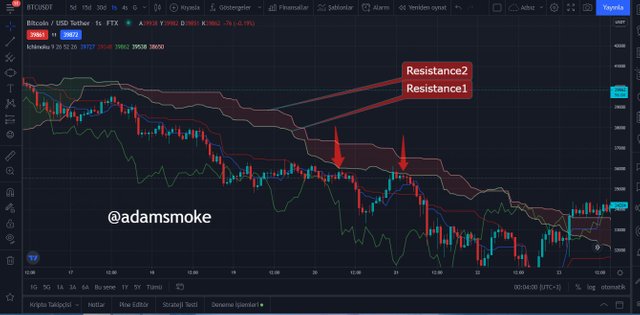
- As we can see in the screenshot above, Senkou Span A and B points acted as resistance at the points I indicated with the red arrow and the price bounced back from these levels.
Kumo Cloud Support and Resistance Levels at a Lateral Trending Price
During the sideways (sideways) movement, the price moves inside the Kumo cloud. According to Price Trend, both Senkou Span A and Senkou Span B lines act as strong support and resistance. We will see this more clearly in a screenshot.
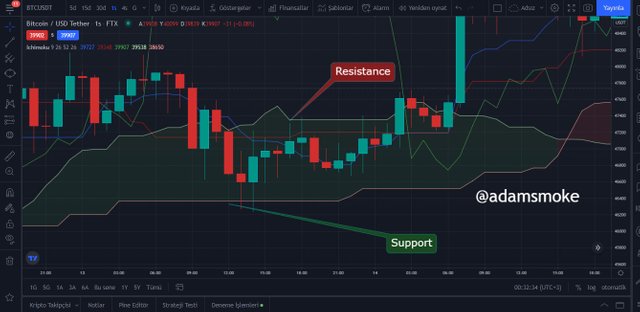
- As seen in the screenshot above, the Senkou Span A and B lines form support and resistance zones when the price enters the kumo cloud during the lateral movement.

Question 3
How and why is the twist formed? And once we've "seen" the twist, how do we use it in our trading? (Screenshot required)
In the command cloud, Twist occurs when the Senkou Span A and Senkou Span B lines intersect each other from above or below. After twisting, three different movements take place in the market; Uptrend, downtrend and sideways movement occur.
- Uptrend After Twisting:
While the market is in a bearish trend, the area between Senkou Span A and B lines (Kumo Cloud) begins to thin. Then, an uptrend begins when Senkou Span A crosses Senkou Span B from the bottom up, when a twist occurs and the kumo cloud stays below the price.
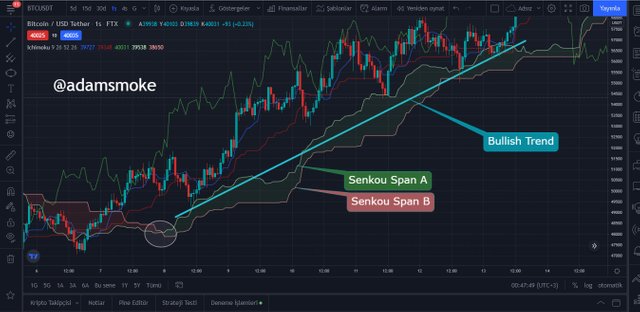
- Downtrend After Twisting:
While the market is performing an uptrend, the kumo cloud begins to thin. Then a downtrend starts when Senkou Span A crosses Senkou Span B from above and a bend is made and after the kumo cloud moves above the price.
- Lateral Movement After Twisting:
When the price bends after a certain trend, it actually moves sideways very often.
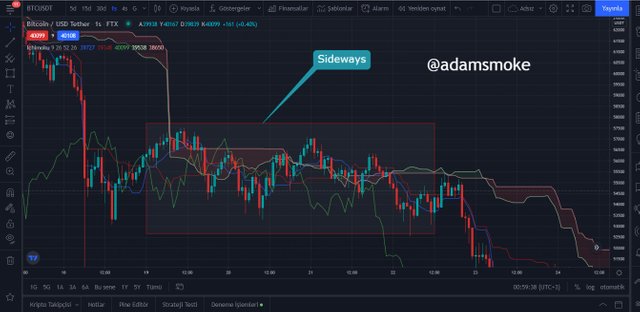
- As you can see in the screenshot, the market bends during a downtrend. Then the price remains unstable for a certain period of time, bending several more times and continuing the downtrend. It should not be forgotten that the price could also go up after the lateral movement.
Twist in Trade
As we said before, the area of the kumo cloud shrinks before the bending takes place. This contraction tells us that there will be a twist. After this inflection, the price can move up, down and sideways. Generally, after a bend, the price enters a holding period and moves sideways before a downtrend or uptrend begins. Twisting after this lateral movement allows us to foresee whether the trend will change or continue. In this way, it informs us during our buying / selling transactions. This gives traders time to hold their positions, take profits, and trade.

Question 4
What is the Ichimoku trend confirmation strategy with the cloud (Kumo)? And what are the signals that detect a trend reversal? (Screenshot required)
We now know the trends in the market and the three different movements of the price. For the uptrend; When Senkou Span A moves above Senkou Span B, at the same time the cloud moves below the price and its color is green, it indicates that the trend is up. For Downtrend; When Senkou Span A moves below Senkou Span B, at the same time the cloud moves above the price and its color is red, it indicates that the trend is bearish. For Lateral Movement; If Senkou Span A or Senkou Span B moves straight, Senkou A is above for certain periods or Senkou B is above for certain periods, if the price moves in the cloud, it shows us that the price is in a lateral movement.
Trend Reversal Signals
Twist: If Senkou A and B cross each other, a twist occurs and the Trend may reverse after this twist. However, it would not be right to say that a twist alone has changed the trend. Because very often after a twist, the price enters the waiting range.
Cloud Break: When price breaks the kumo cloud while any trend is in progress, it is a trend reversal signal.
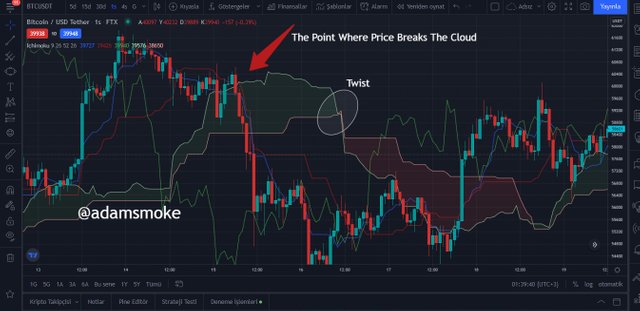
- As we can see in the screenshot above, the price cloud is breaking in the area indicated by the arrow sign. Then, after a certain time, a twist takes place. When the price breaks the cloud and then a twist occurs, it signals that the Trend will change.
Direction of the Kumo Cloud: Another method we use to confirm that the trend will change, the direction of the Kumo cloud should be in the same direction as the trend.
Chikou Span: Chikou is a line formed by shifting the price movement back 26 periods. Chikou Span cutting the cloud in the same direction as the trend is a Trend reversal signal.
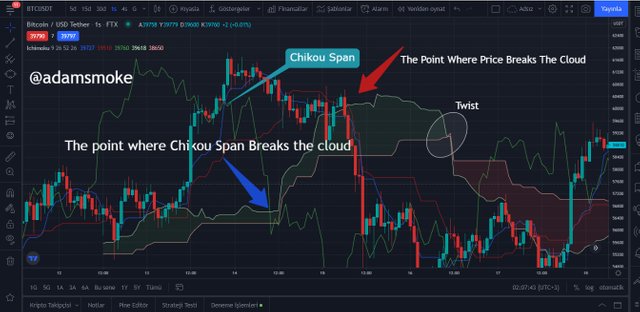
- As seen in the screenshot above, Chikou Span is breaking the cloud in the direction of the trend.

Question 5
Explain the trading strategy using the cloud and the chikou span together. (Screenshot required)
Chikou Span is the line created by moving the current closing price back 26 periods, as we have mentioned before. So Chikou Span shows us 26 periods back and Kumo Cloud shows us 26 periods forward. But we must not forget about the calculation methods of the Kumo Cloud lines. Like Chikou, it is not directly based on the closing price.
Uptrend Trading Strategy
The Chikou line, breaking the kumo cloud and the price upwards, as well as moving above the price and the kumo cloud gives us the signals of an uptrend.
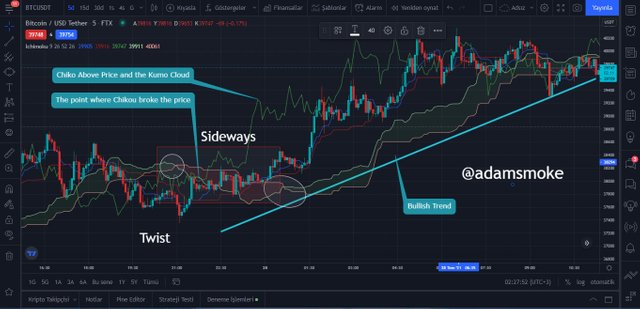
The screenshot above shows the chart of the 5-minute BTC/USCDT pair.
- In this chart, we see that the price and the cloud are moving above Chikou after breaking the cloud.
- At this point, we see a twist occur just before Chikou cuts the Cloud.
- Before this twist, the market was in an uptrend. Then the price started to move sideways.
- We can consider this lateral movement as a holding point and preparation for trade. Then we see Chikou cut the cloud and price as the sideways move continues.
- Later, we see Chiko moving above the price while the sideways movement continues. Then a twist occurs again as the lateral movement continues.
- All this shows us that the uptrend will continue and the price will continue a strong bullish Trend.
- At this point, we can open a long position to evaluate this strong Bullish Trend.
Of course, we do not forget to determine our stop-loss and take profit levels after opening our position.
Downtrend Trading Strategy
Contrary to the Uptrend, Chikou crossing the price and the kumo cloud from above, as well as moving below the price and the kumo cloud gives us the signals of a downtrend.
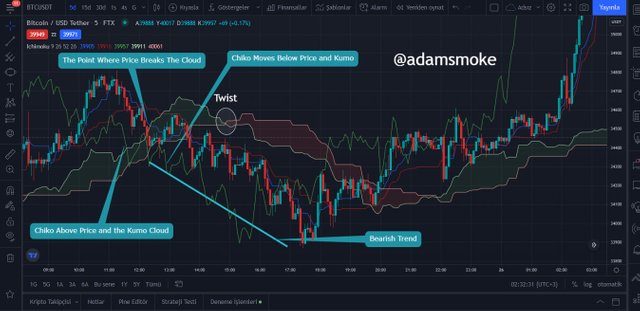
The screenshot above shows the chart of the 5-minute BTC/USCDT pair.
- As you can see in the screenshot, Chikou breaks the price first and then the cloud from top to bottom.
- Then the price breaks the cloud from top to bottom.
- The trend was an uptrend, but these two signals indicate to us that the trend will change and the downtrend will begin.
- Then, after waiting for a certain time, when we watch Chikou's movement, we see that the price is moving below the cloud.
- Then after a while we see that there is a twist. All these signals give us the signals that a strong downtrend will start.
- If we want to take risks at this point, we can open our position short when we see the downward movement of Chikou after cutting the cloud. However, if we want to open our position more safely, we determine the direction of the trend.
- We then look at the cloud during this waiting period and see that it's shrinking, then we realize it's going to be twisting. After this point, our profit rate will decrease a little in our position that we will open, but we are sure that the trend will change and we take our short position with confidence.
We should make our trade by determining our stop-loss and take profit levels in all our transactions. It should also be noted that no indicator gives 100% accurate signals. because we must not forget that the opportunities in cryptocurrency trading are endless.

Question 6
Explain the use of the Ichimoku indicator for the scalping trading strategy. (Screenshot required)
Scalping trading method:
It is a trading method performed by analyzing charts that do not exceed 15 minutes. There are hundreds of technical analysis indicators that we can use when trading scalping. Scalping trading is possible with the ichimoku indicator.
In the scalping trading method with ichimoku, 1-minute charts are used at most. This trading method is called 'One Munite Ichimoku Scalping' (M1). It is also a trading method used on 5-minute charts (M5) and 15-minute charts (M15). In fact, the analysis of M5 and M15 is more important than the M1 trading method analysis. Because the effects of our support and resistance levels, which are defined in higher time frames, on price movements are more prominent and their effect is more significant.
Buy and Sell Positions in Scalping Trading with Ichimoku
Before we start Scalping trading with Ichimoku, let's do a recap to make sure we know the uptrend and downtrend on ichikomu:
Uptrend
- The first point we need to look at is making sure that the price is below the ichikomu cloud.
- Next, we look to see if Chiko Span moves above the price. If Chiko is moving above the price and the cloud after breaking our price and cloud, it signals a strong uptrend.
- We then look for a twist in the cloud. When Senkou Span A crosses Senkou Span B from bottom to top, this gives us the news of an uptrend.
Downtrend
- The first thing we need to pay attention to is to make sure that the price is above the kumo cloud.
- Next, we look to see if Chiko Span moves below the price. If Chiko breaks our price and cloud, we make sure that the price moves below the cloud. This gives us a signal of a strong downtrend.
- We then look for a twist in the cloud. When Senkou Span A crosses Senkou Span B from top to bottom, this gives us the news of a downtrend.
Then, to open a position:
- The first thing to consider before taking our position is that we are not sure that the price is coming out of the kumo cloud. Otherwise, when the price is in the kumo cloud, the price is in the waiting range and it is difficult for us to detect a trend. Therefore, we should avoid taking a position before the price comes out of the cloud.
- Another point that we need to pay attention to before taking our position is that we interpret the Kujin Sen and Tenkan Sen lines, which we use to ensure the accuracy of the trend. The fact that the tenkan line is above the kujin line gives us a buy signal. If the tenkan line is below the kujin line, it gives us a sell signal.
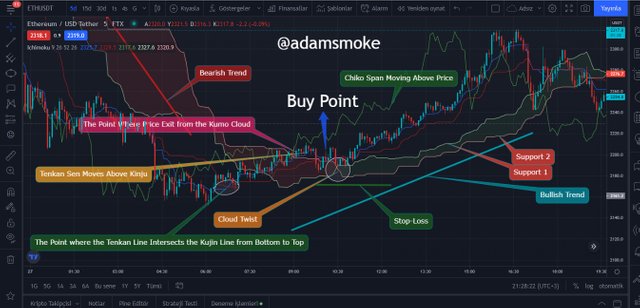
- The above screenshot shows the ETH/USDT pair and is a 5-minute chart.
- First of all, we determine the trend according to the criteria mentioned in the screenshot above. The Trend is a downtrend and a contraction is occurring in the kumo cloud around 6 pm on April 27. However, the bending did not occur. Subsequently, the price entered the kumo cloud. This shows us that the price has entered a holding point and the trend will either continue or the trend is preparing to reverse.
- Later, when we look at our Chiko line, we see that it broke the cloud first and then the price. This gives us signals that an uptrend is about to start.
- Then again around 6 o'clock on April 27, we see that the Tenkan line cuts the Kujin line and rises above it.
- All these Ichikomu indicator analyzes give us the news that a strong trend will start.
- However, one of the most important points for us to take our position is the point where the price comes out of the cloud. After seeing this, we open our long position.
- As in every trade, we determine our stop-loss point. In this trading strategy, I place my Stop-loss point just below the first values after the twist of Senkan Span B, which is my Support 2 level after the twist occurs in the kumo cloud. Because this is the point where the Uptrend is confirmed and the twist takes place. If the price drops below this level, the trend will change. Therefore, I place my Stop-Loss level around 2170 USDT as seen in the screenshot.

Conclusion
In this article, we first explained what the Ichikou indicator is and how it looks. Then, we learned in detail what the two lines that make up the Kumo cloud and the Kumo cloud are, how to determine the support/resistance points, more precisely, the support and resistance zones, and how the movements between the Kumo cloud and the price are interpreted.
We have shown in detail how the Kumo cloud on the Ichikou indicator is in trend setting and signals that the direction of the trend will change. Then I tried to explain the relationship between the kumo cloud and the Chiko line in a beautiful and simple language.
Later, we explained and tried to show in detail the answers to questions such as how we can use this information we learned in our Trading Strategy, can we also use this trading method in Scalping trading or how we can use it.
After all these topics, we saw together that although the Ichikou indicator seems difficult compared to many indicators, it actually gives us very good signals when we understand its logic. If we are going to trade scalping, we have shown that this trading method is a very suitable method.
Thanks again to everyone who read my homework and to professor @kouba01. I wish you all a healthy and beautiful day.
Hello @adamsmoke,
Thank you for participating in the 5th Week Crypto Course in its third season and for your efforts to complete the suggested tasks, you deserve a 7/10 rating, according to the following scale:
My review :
In general, you did a good job answering the questions directly and clearly, with a laconic analysis of certain points.
You explained the cloud and its lines in a good and clear way, where all aspects were addressed.
For the second question, you did not answer the first part that interprets the relationship between the price movement and the Kumo cloud and you have passed directly to explain how to determine the points of support and resistance.
The third question guarantees correct information but lacking deepening the answers analysis.
Thanks again for your effort, and we look forward to reading your next work.
Sincerely,@kouba01
Downvoting a post can decrease pending rewards and make it less visible. Common reasons:
Submit