Introduction
Hello to everyone.
This week we are in front of you with another great lesson. In Professor's lecture on indicators we can use in our trading, this week's topic is the ADX indicator. In this post, we will cover all the details of the ADX indicator. However, in general, the important points we need to know about the ADX indicator are; We cannot trade with the ADX indicator alone, but it is an excellent indicator for determining trend direction and strength. Now let's move on to our lesson.
Thank you to everyone who reads my post.

Question 1
Discuss your understanding of the ADX indicator and how it is calculated? Give an example of a calculation. (Screenshot required)
ADX Indicator
The ADX (Average Directional Movement Index) indicator is also called the “Average Directional Index”. The ADX indicator is not used as much as other technical analysis indicators. It is generally used for filtering false signals in price movements.
The ADX indicator helps us to make more accurate decisions in our trades by using it with other technical indicators instead of being used alone. ADX generally does not generate buy-sell signals, but rather gives traders an idea of whether there is a trend or not. ADX also allows us to determine how strong the trend is.
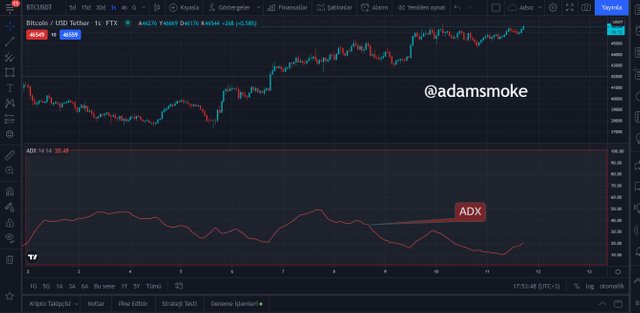
- ADX is seen in the BTC/USDT chart above.
How can you tell if there is a trend with ADX?
In the ADX indicator, the ADX line has values between 0-100. These values between 0-100 represent the strength of the trend. However, the thing we need to pay attention to is the ADX line, which only shows the strength of the trend, not the trend direction.
| ADX Value | Trend |
|---|---|
| 0-25 | No or very weak trend |
| 25-50 | Strong Trend |
| 50-75 | Very Strong Trend |
| 75-100 | Extremely Strong Trend |
- As we can see in the chart above, when the ADX line is below 25, we understand that there is no trend or a weak trend. Sometimes this value can be accepted as 20.
- If the ADX line is between 25-50 values, it means that there is a trend, and if it is above 35-40 values, there is a strong trend.
- If the ADX line is between 50-75 values, it indicates that there is a very strong trend.
- ADX line indicates an extremely strong trend at 75-100 values. However, the ADX line is not seen very often above 75.
ADX Indicator and DMI Curves
DMI curves are used to determine the direction of the trend with the ADX indicator. Thanks to DMI curves, graph reading becomes easier and allows us to determine the direction of the trend.
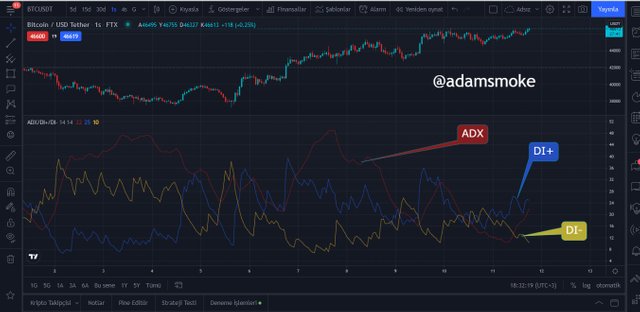
- The above BTC/USDT pair chart shows the components of the ADX indicator.
- ADX line (Red), DI+ line (Blue), DI- line (Yellow) form the ADX indicator. The colors of these lines can be customized.
DMI curves consist of two lines as we can see. These are DI+ and DI-.
DI+: This line shows us the strength of the uptrend.
DI-: This line represents the strength of the downtrend.
It also gives information about the movement of these two lines and the direction of the trend:
- When the DI+ line is above the DI- line, the price is on the rise.
- When the DI- line is above the DI+ line, the price is declining.
The movements of these lines are not perceived as a buy-sell signal. This is because these lines are sensitive and may cross constantly.
ADX Indicator Calculation
To calculate the ADX indicator, DMI+ and DMI- are calculated first.
DMI+ = day high - previous high
DMI- = previous low - low of the dayThen True Range (TR) is calculated.
Current high - current low
Current high - previous close
Current low - previous closeThen our DI+ and DI- values are calculated.
DI+ = DMI+/TR
DI- = DMI-/TRThen the DX value is calculated.
DX = 100 * ((DI +) - (DI-)) / ((DI +) + (DI-))
As a result, our ADX formula is:
ADX = Total n [((DI +) - (DI-)) / ((DI +) + (DI-))] / n
Sample:
Current High: 45
Previous High: 43
Current Low: 44
Previous miscarriage: 41
Previous Closing: 42
Number of periods: 14
DMI+: = 45-43= 2
DMI-: = 41-44= -3
DMI+ = 2, DMI- = 0
True Range:
TR = MAX( 45-43),(45-41),(44-41)= (2,4,3) TR = 4 as the largest value will be taken.
DI+: = 2/4 = 0.5
DI-: = -3/4 = - 0.75
ADX = 14 x ((0.5-(-0.75))/(0.5+(-0.75)))/14
ADX = 14 x ((1.25)/(-0.25))/14
ADX = 5
Question 2
How to add ADX, DI+ and DI- indicators to the chart, what are its best settings? And why? (Screenshot required)
- In this section, I will perform a show on https://tr.tradingview.com/.
- The first thing we need to do is open any asset pair.
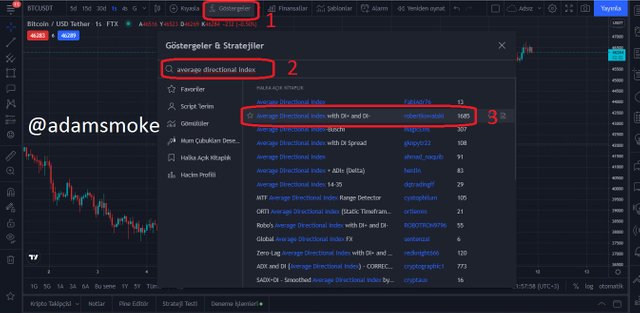
- Then we click on the “fx” button.
- Then we write “Average Directional Index” in the search field.
- I select “Average Directional Index with DI+ and DI-“ in this field.
- To configure it later, we click on the settings section by hovering over the indicator.
- Then the "Style" section appears. This section contains the color settings of ADX, DI+ and DI- lines.
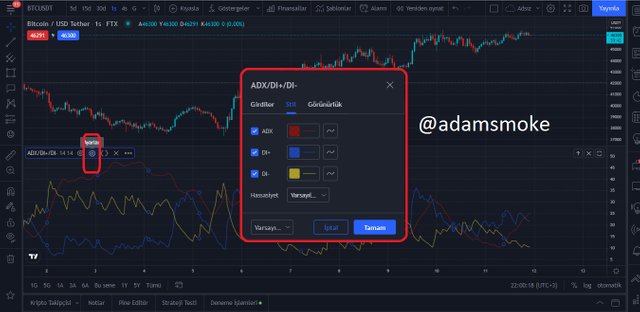
- Later in other options; Input and Visibility options.
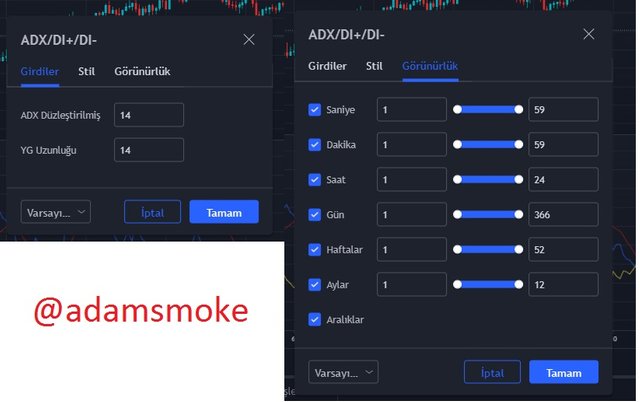
- In the Entries section; we can set the time zone and length.
- In the visibility section; seconds, minutes, hours, days, etc. There are times like We must not disturb the settings of this section.
Best Settings
The standard settings of the ADX indicator are used as 14 periods. The reason for this is that when shorter periods are selected, it generates too many signals and the generation of false signals increases at this rate. When a longer period is selected, it may be late to react to price movements. For this reason, 14 terms were chosen as the standard. Let's examine this with an example:
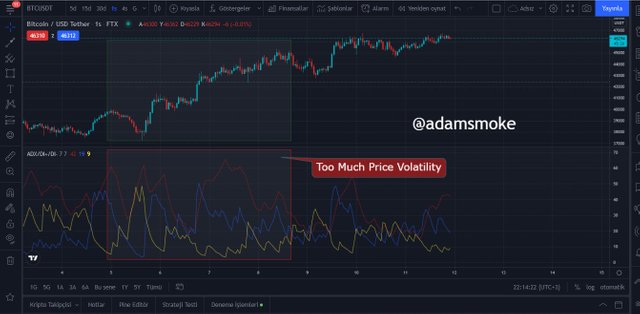
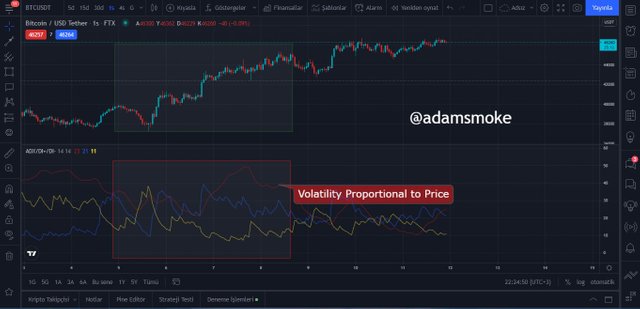
- In the above chart, the 1-hour chart of the BTC/USDT pair is visible.
- 7-period ADX is used in this chart. As you can see in the screenshot, the volatility of the ADX indicator is quite high.
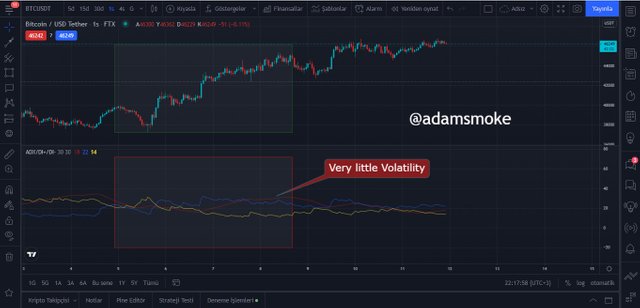
- In the screenshot above, the 30-period ADX indicator is used using the same chart.
- As you can see in the screenshot, the volatility of the ADX indicator is quite low and it lags behind in trend tracking.
- Again on the same chart, this time a 14-period ADX indicator is used.
- As we can see in the screenshot, the ADX indicator moves accurately with the price action.
The settings of the ADX indicator may vary depending on our trading method. For this reason, it would be more accurate to adjust our settings according to the time period in which we will trade. I was able to follow the correct trend while doing 1-hour analysis here. It would be more accurate to choose a period according to the time period we analyze. If you are a scalping trader, 7-9 periods may be a good choice. If you are a swing trader, longer periods like 30 might be the right choice for you. After we set our period settings according to our trading method, we should experiment and find out what the right settings are for ourselves.
As a result, we can say that; It would be wrong to use the phrase “this is the best setting” of the ADX indicator. 14-period settings are used as standard, but we can say that the most accurate setting depends on the trader's trading method. In addition, it is not recommended to go beyond the 7 and 35-period values in the ADX indicator.
In addition to this information, as we have said before, it would be wrong to use the ADX indicator alone in our trades. The ADX indicator should be used as a confirmatory indicator such as trend tracking and trend strength. Also when using the ADX indicator in our trades we can additionally use the RSI, MACD, etc. If we use indicators, it allows us to make more accurate decisions. Another thing to remember is that no indicator gives 100% accurate results.
Question 3
Do you need to add DI+ and DI- indicators to be able to trade with ADX? How can we take advantage of this indicator? (Screenshot required)
As we said before, ADX does not in any way help us determine the direction of the trend or generate buy-sell signals. It only allows us to see if there is a trend and if there is a trend, the strength of the trend. However, with the addition of DI+ and DI- indicators, it also allows us to determine the direction of the Trend. Therefore, we can add DI+ and DI- indicators to ADX. However, this does not mean that we should definitely add it. We can follow the direction of the trend from price movements and many other indicators. At the same time, we can trade with the help of other indicators without adding the DI+ and DI- indicators.
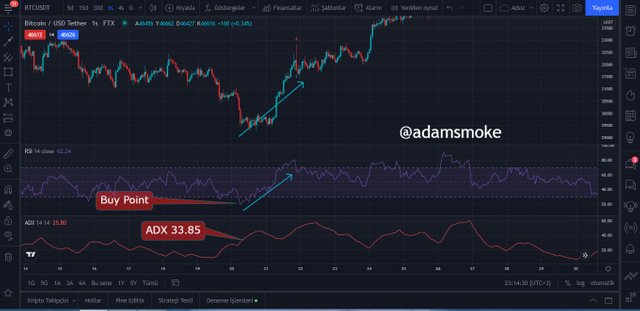
- The chart above shows the 1-hour chart of the BTC/USDT pair.
- As we can see in this chart, we can set a buying point for ourselves without adding DI+ and DI- indicators.
- First, when we look at the value of the ADX line, we see that it is 33.85. This shows us that there is a strong trend. With the help of our RSI indicator, we see that our RSI value has dropped below 30 at the same point and gives a buy signal.
- When we look at the price action later, we can see that the price has risen after our buy point.
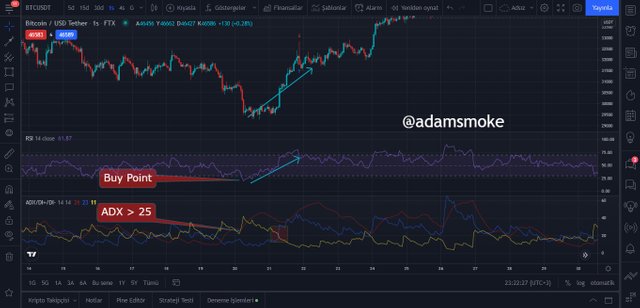
- When we add the DI+ and DI- indicators on the same chart, we can see the direction of the trend more clearly.
- After the ADX line crosses 25, the DI+ (blue) line crosses the DI- (yellow) line upwards and the uptrend officially starts.
- At this breaking point, the price ends its lateral movement and chooses a trend, and this trend is an uptrend.
- When we look at the ADX value, it is above 25, which shows us that the trend is strong.
Another issue that we should pay attention to here is that DI+ and DI- indicators are said to give buy-sell signals at the points where the ADX line is higher than 25, according to some sources. This is a wrong judgment. The use of DI+ and DI- indicators together with ADX can only be considered as an advantage. Because ADX alone cannot enable us to determine the trend direction. The trend direction is determined by the DI+ and DI- indicators. At the same time, DI+ and DI- indicators react to price movements faster than ADX. Therefore, as the gap between DI+ and DI- increases, it can be understood that the trend is strong.
Question 4
What are the different trends detected using the ADX? And how do you filter out the false signals? (Screenshot required)
As we mentioned before, the trends detected by ADX are as in the table below.
| ADX Value | trend |
|---|---|
| 0-25 | No or very weak trend |
| 25-50 | Strong Trend |
| 50-75 | Very Strong Trend |
| 75-100 | Extremely Strong Trend |
No Trend, Weak Trend
With the ADX line, non-trend points or weak points can be easily determined. As we said before, when the ADX value moves below 25 (20 according to some sources), it represents no trend or a very weak trend. The price is at a consolidation point at this point. This point can also be interpreted as a waiting gesture.
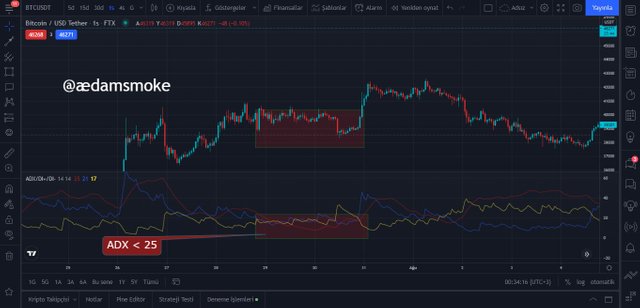
- The above screenshot shows the 1-hour chart of the BTC/USDT pair.
- In the area shown with the box in this graph, ADX is below 25. As it can be understood from the price action, there is no certain trend in the price.
Strong Trend
When the ADX line is between 25-50 values, there is a strong trend in the market. Traders generally prefer this range to trade. Because the value 25 is an important value for the ADX indicator and it means the start of the trend.
- The above screenshot shows the 1-hour chart of the BTC/USDT pair.
- In the area shown by the box in this graph, the ADX value is between 25-50. As can be seen from the price action, there is an uptrend. We can understand this from the fact that the DI+ line breaks the DI- line upwards.
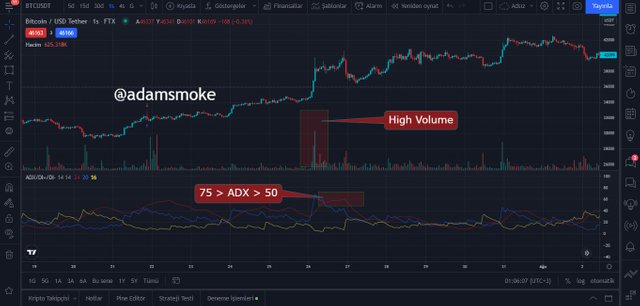
Very Strong Trend
When the ADX line is between 50-75 values, there is a very strong trend in the market. These values are indicative of high volume buying trades and the price often breaks the support/resistance levels between these values.
Extremely Strong Trend
When the ADX line is between 75-100 values, there is an extremely strong trend in the market. This is rare. This represents the volatility of the price and lasts very short. This type of upswing usually happens because of good or bad news in the market.
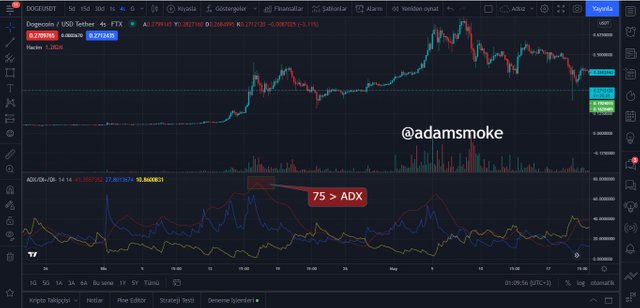
- The above screenshot shows the 4-hour chart of Doge/USDT pair.
- In the area shown with the box in this graph, the ADX value is above 75. This tells us that it is an extremely strong trend.
- We said that it is rare and may occur as a result of good/bad news. The reason for the volatility of the cryptocurrency in this example is that Elon Musk has a toy in his hand.
Filtering False Signals
There are many ways to filter false signals with ADX. The simplest of these may be the transition to longer periods. At the same time, the ADX line forming lower highs may not indicate that the trend has changed, but that the trend is weakening. If there is an ADX line above the 25 level, there is a trend. Only the strength of the trend (trading volume) may decrease. In addition to these, we can also filter false signals by making use of many indicators.
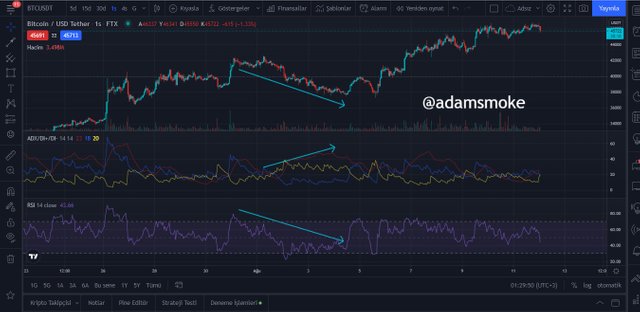
- The chart above shows the 1-hour chart of the BTC/USDT pair.
- As we can see in the chart, the ADX level is increasing. We can interpret this to mean that the uptrend is getting stronger. However, when we look at the RSI indicator, we can see that the price has entered the oversold region and there is a correction in the price. Then we see that the uptrend continues.
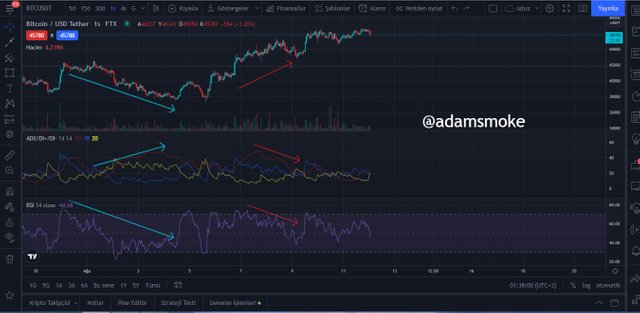
- On the same chart, there is a false reversal signal on the RSI in the areas I have shown with red charts.
- We see that the price continues to increase while the RSI value decreases. Likewise, this appears in the ADX indicator. However, this divergence on the ADX line should not be interpreted in the same way as the RSI.
- The divergence on this ADX line represents the change in momentum. We should use additional indicators like RSI to confirm that this is a reversal signal. As on our chart, this divergence may not always be a reversal and may simply indicate a weakening of the trend.
Question 5
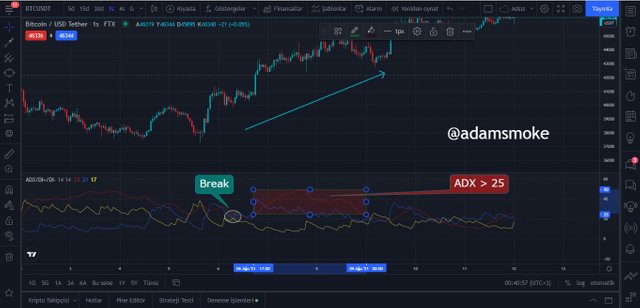
Explain what a breakout is. And How do you use the ADX filter to determine a valid breakout? (Screenshot required)
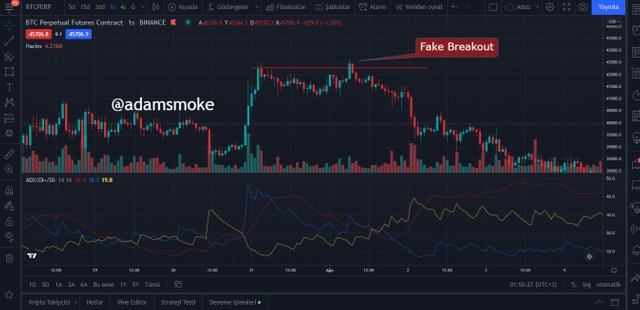
Breakout, as we can understand from its name, means to exit (escape) from any place or level. The same is true for financial assets. The collection of prices on financial assets at certain levels and the points where they see a reaction are called support and resistance. When the price exceeds these support and resistance levels, it is called a breakout. The reason for this is that the price exceeds this level by being overbought or oversold at any support-resistance level. However, one thing to remember is that these breakouts can sometimes be fake. It may be a trap set for us by institutional investors or large traders. In a true breakout, the price moves in the direction of the breakout. However, in a fake breakout, the price moves in the opposite direction after breaking down.
ADX Filter
We all know that the ADX indicator is used to determine the strength of the trend. In this way, we can understand whether the Breakouts are real or fake with the ADX indicator.
So How Do We Do This Filtering?
We know that the trend is strong when the ADX line is above the 25 level. therefore, breakouts occurring in areas where the ADX value is above 25 are taken into account. Breaks below 25 are not taken into account.
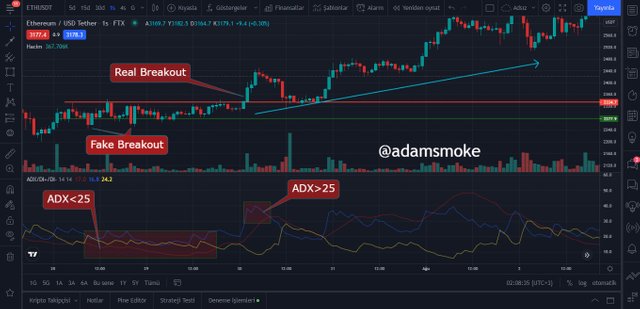
- The above screenshot shows the 1-hour chart of the ETH/USDT pair.
- As we said before, when ADX is below 25, there are two breakouts, but since this area is not a trend, these breakouts are not taken into account. Price then makes a sideways move.
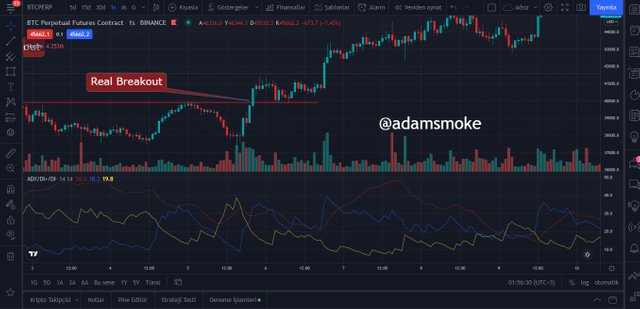
- However, another breakout occurs after the price moves sideways. At this point, when we look at the ADX indicator, we see that it is higher than 25 and we confirm this breakout. Subsequently, the price entered an uptrend.
Question 6
What is the difference between using the ADX indicator for scalping and for swing trading? What do you prefer between them? And why?
Scalping Trading
As we all know, Scalping Trading is a trading method that allows us to earn more with small profit rates by entering more than one position during the day. In this trading method, charts such as 1 minute, 5 minutes, 15 minutes are used.
In the case of using the ADX indicator during scalping trading, shorter period periods can be used instead of the 14-period period. However, the rate of false signals produced as a result of its use will increase. It is possible to filter these false signals using additional indicators. E.g; Indicators such as ichimoku cloud, RSI, Average True Range indicator can be used.
Swing Trading
As we all know, Swing Trading is a trading method in which traders maintain these positions for several days by taking positions thanks to fluctuations in prices. In this trading method, charts on longer time frames are used.
In case of using the ADX indicator during swing trading, longer period periods can be used instead of the 14-period period. However, there may be a delay in the signals produced as a result of its use. Therefore, it would be more accurate to adjust this setting according to our trading timeframe. At the same time, we do not need many additional indicators during our Swing trade. However, additional indicators can be used to more easily identify our entry points and support-resistance levels. Again, when the RSI indicator is used on the daily chart, it gives more accurate signals at overbought – oversold points in my opinion. Likewise, we can use the ichimoku indicator to determine our trade entry and exit points in a timely manner.
My preference would be swing trading. Because scalping trading is a trading method that really takes time and requires constant chart monitoring. Since I work during the day, swing trading is more suitable for me. After making the analysis on the chart, I can set my alarms and open my position even over the phone if the price reaches the point I want. As for the technical analysis part, swing trading is suitable for me. Because I have the time I need to do the necessary analysis. Also, when trading swings with the ADX indicator, I avoid unnecessary signals and traps by using longer timeframes. By integrating additional indicators with the ADX indicator, I can identify more accurate trading points. In this way, my rate of taking wrong positions decreases and I can make more profit.
Conclusion
Thanks to this lesson, I understood what the ADX indicator, which is not used much (I rarely hear its name), is and what it does. I realized that the use of the ADX indicator alone indicates only the strength of the trend, and when the additional indicators DI+ and DI- are added, it is a very good indicator that we can determine the direction of the trend.
I can't say that I fully understand how to calculate ADX power, but I tried to understand it as much as I could and presented it to you with a simple example. However, I am not so sure that the result is correct. Because I couldn't find a source in my own language, I couldn't understand how to calculate all the points. If you search on the internet yourself, you can find the right calculation method. For the Total N value at the end of my transactions, I couldn't quite understand how to calculate the total dx value. For this reason, I will leave you a link for easy access. (https://www.investopedia.com/terms/a/adx.asp)
Then, I tried to explain to you in plain language how the ADX indicator can be used in Scalping and Swing trading. At the same time, I shared with you that I prefer Swing trading and why.
Thanks again to everyone who read my post. Also, thank you professor @kouba01 for this nice and fun lesson. I wish you all a healthy and beautiful day.
Hello @adamsmoke,
Thank you for participating in the 7th Week Crypto Course in its third season and for your efforts to complete the suggested tasks, you deserve a 9.5/10 rating, according to the following scale:
My review :
Great content article in which you covered the topic in all its aspects where the answers were clear. I have some notes:
A simplified and understandable explanation of the indicator and its use.
The final operation is ADX = Sum of n [((DI +) - (DI-)) / ((DI +) + (DI-))] / n, So to get the correct ADX result, you need to calculate DX values for at least n periods then smooth the results.
Good reading of the data included in the graphs to clarify the ideas presented.
Thanks again for your effort, and we look forward to reading your next work.
Sincerely,@kouba01
Downvoting a post can decrease pending rewards and make it less visible. Common reasons:
Submit
Thanks professor.
Downvoting a post can decrease pending rewards and make it less visible. Common reasons:
Submit