##Fibonacci retracement levels
Horizontal lines which indicates where resistance and support are likely to occur in a market is called a fibonnacci retracement level. This levels are associated with a percentage which are known as fibonnacci ratios. The fibonnacci retracement ratios can be denoted as 23.6%, 38.2%, 61.8% and 78.6%.
Fibonnacci retracement is another technical analysis tool that is drawn between two significant price points such as a last support and resistance level of an asset price, then the indicator will be drawn between this two points.
Fibonacci sequence was discovered in the 13th century by Leonardo Fibonacci who is an Italian mathematician, this is why the sequence was named after him.
The retracement ratios are dervied from the fibonnacci numbers which are 0.1.1.2.3.5.8.13.21.34.55.89.144 etc. These numbers are gotten by adding up the first 2 numbers to get the next number, for example adding up 2 and 1 to get 3, then adding 3 and 2 to get 5. And the sequence continues till infinity.
Formula for fibonnacci retracement levels.
There is no real formula for the Fibonacci retracement levels, the indicators are gotten when a trader chooses two points on a chart, the lines are then drawn according to point selected.
A simple mathematics can be done to get an insight of how it works. If for example a price moves from $4 to $12, if a retracement level indicator is to be drawn, the first percentage which is the 23.6% level will be ($12- ($4 × 0.236)) = $10.696 so the first line will be on $10.696 also if we are to calculate the price at 38.2% ($12 - ($4 ×0.382)= $10.472, then the next line will be at $10.472.
This is just the logical explanation of how the Fibonacci retracement level works. Most platforms has helped with the calculations all you have to do is activate the indicator on the chart and it is fixed for you.
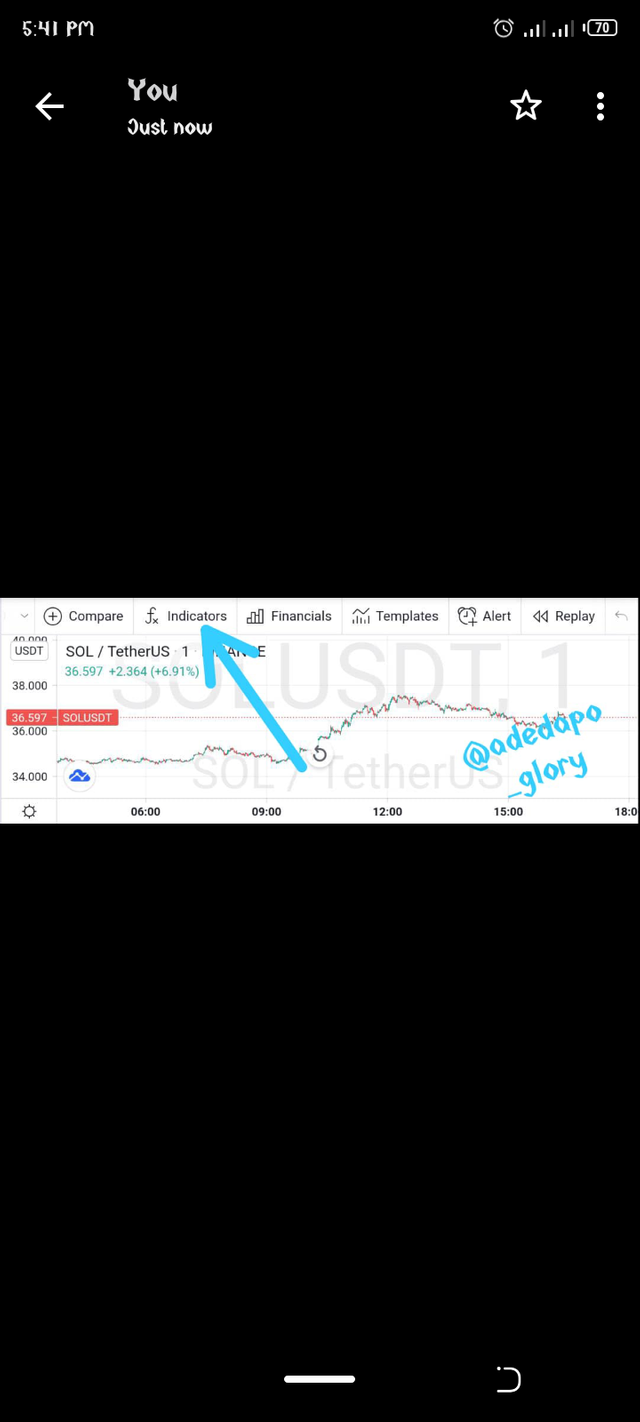
HOW TO SETUP FIBONACCI RETRACEMENT LEVEL ON A CHART
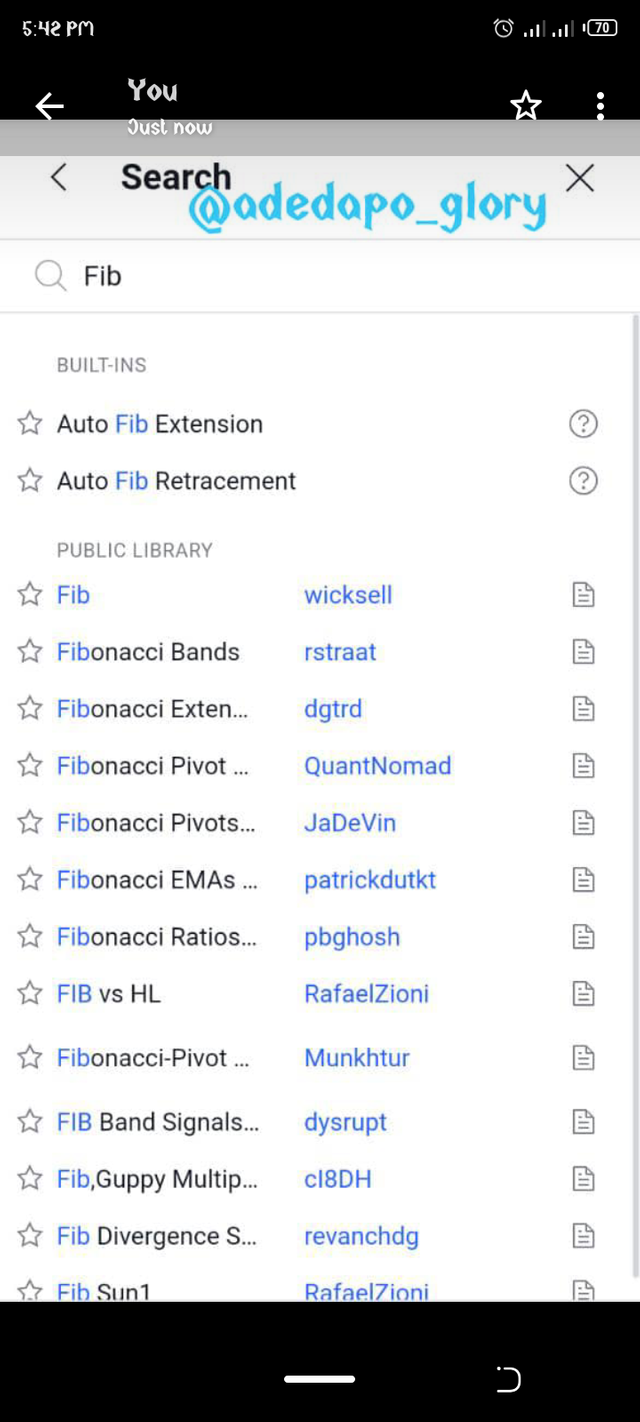
To setup a the Fibonacci level we have to open our chart analysis platform, for this tutorial tradeview will be used, after launching and selecting the asset you wish to do a technical analysis on, you then click on indicators on the interface and input the fib on the search bar, this will then bring results of Fibonacci levels of different kinds then choose the preferred one.
.
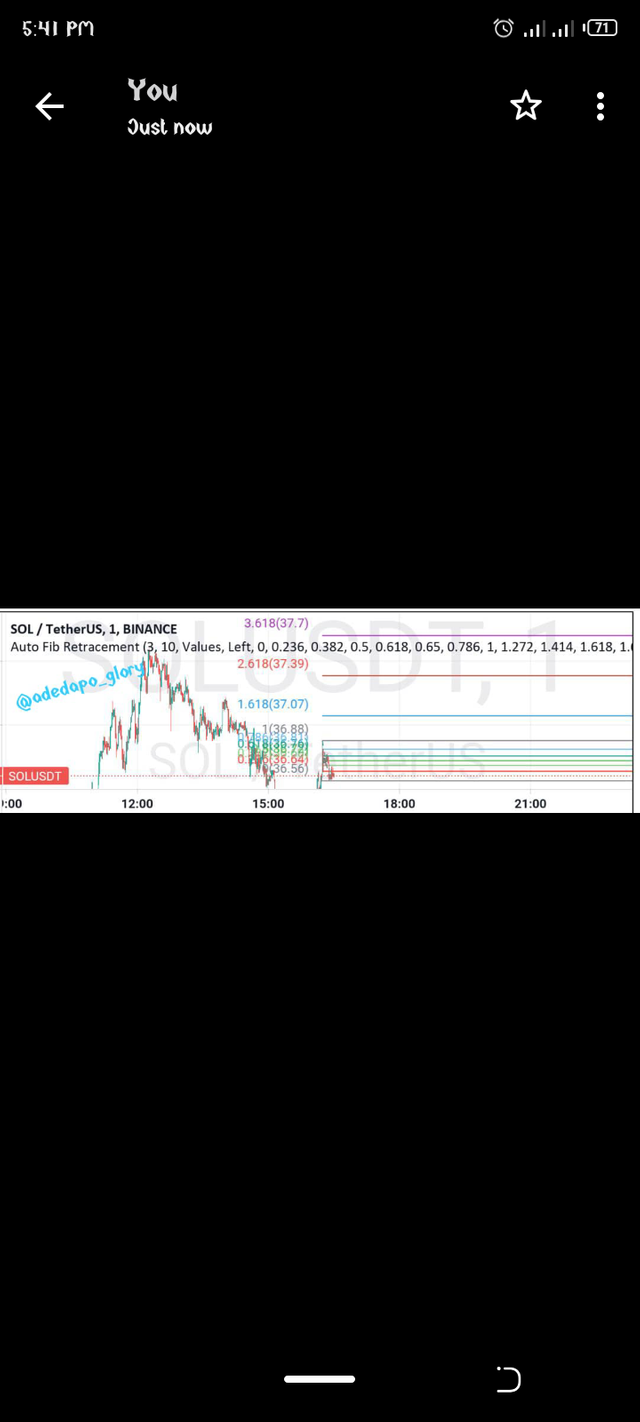
I will choose the auto fib retracement which will show on the chart immediately, you can then tap on the lines and edit the settings of the fib as preferred.
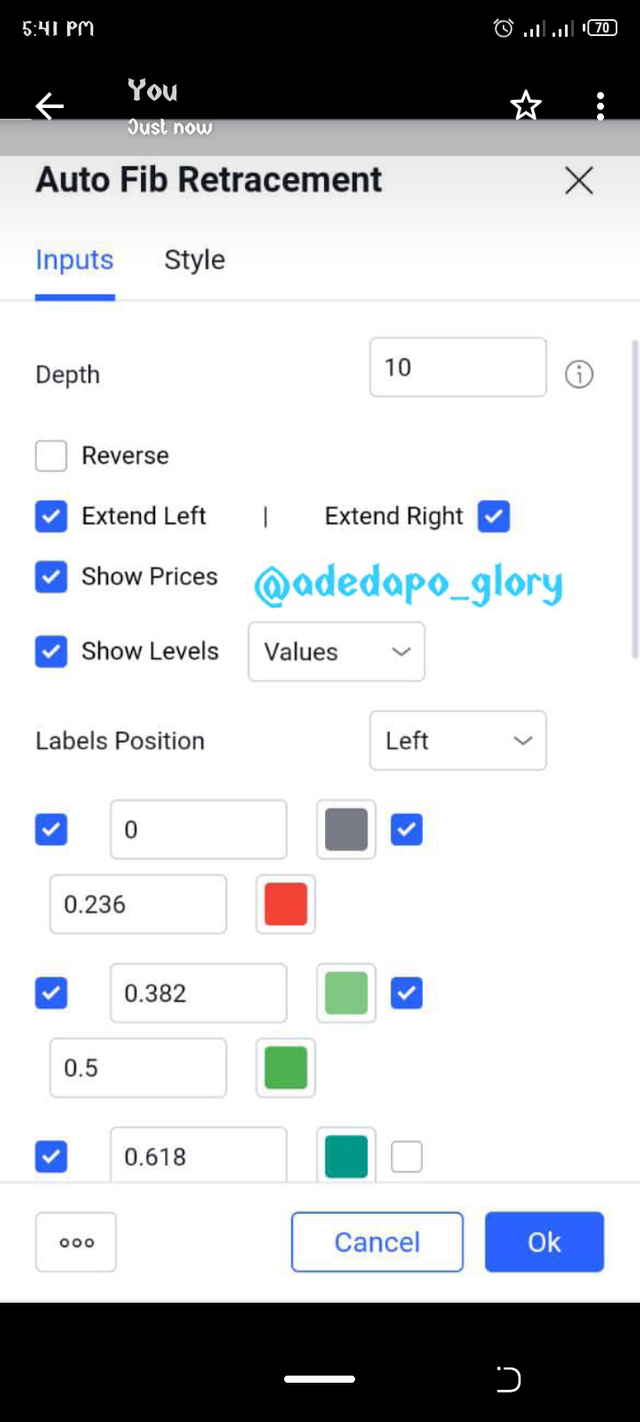
Under the input we have various settings that cab be edited they are listed below.
Deviation
This calculated how much the price will deviate from there previous pivot o form a new pivot
Depth
This is the amount of bars that will be taken into consideration when drawing the lines.
Extend Lines
This is how far the line of the Fibonacci level will go and to what direction to infinity.
Reverse
This features reverses the arrangement of the lines
Prices
This is the display of the price
Levels.
This displays the level of the fib.
Levels Format
This gives us a choice to choose how we want the level to be displayed either in percentage or in numbers.
Advantages of Fibonacci retracement levels.
(1). Fibonaccus retracement level helps to determine potential uptrend or downtrend in a market and helps you indicate to a trader when yo open or close a position.
(2). This indicator is highly profitable for traders who can use it properly.
(3). It helps to identify possible reversal on a market chart.
Disadvantages of Fibonacci retracement levels.
Without a high level of understanding, the Fibonacci retracement level can be of great disadvantage if it is solely depended on by a trader. It is only to give insights about a market trend and not a 100% guarantee price forecasting tool.
Fibonacci retracement level can't be used with a small price assets if not a lot of false triggers will be seen on the chart with the use of Fibonacci levels, also the levels will be so close to each other that it will be riskier to trader with the signals
Fibonacci can't be used alone but needs to be used with other technical indicator tool.
How to use a Fibonacci retracement level.
To use the Fibonacci retracement levels to get a better result it is advisable to use it in a strong trend either in a bullish or bearish trend. It shouldn't be used in a sideways movement of the market because this will lead to indecision on to whether to go short or long in the asset. Also it is applied to assets with big prices.
The tool is good determining where a stop.loss can be set and helps a trader spot where his take profit can be and where to enter the trade.
Also, it is better to be sure one isn't trading a permanent reversal but a temporal one so as to avoid huge loss, so one has to enable a trade management. So one must set the stop loss a few pips below or above the retracement levels depending on whether one is going short or long.
To do it manually you locate 2 points on the chart the highest top and the lowest bottom, this point is what use in plotting your Fibonacci retracement level.
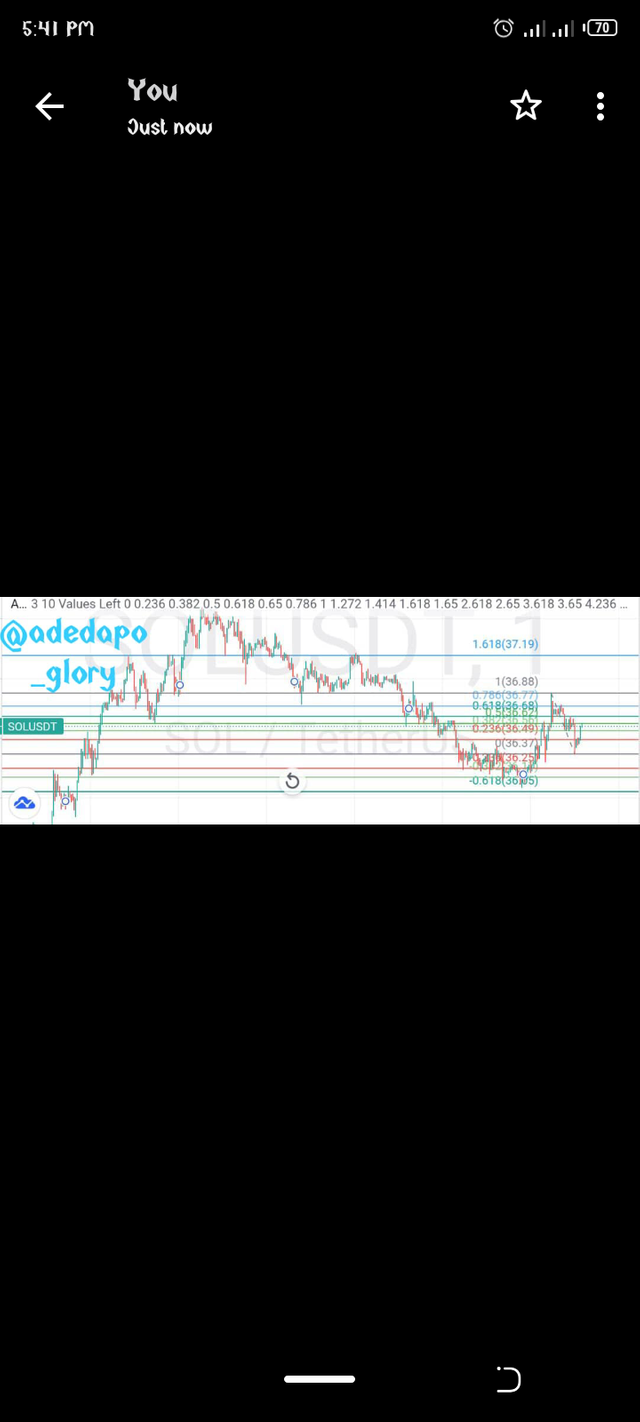
REVIEW ON CHART
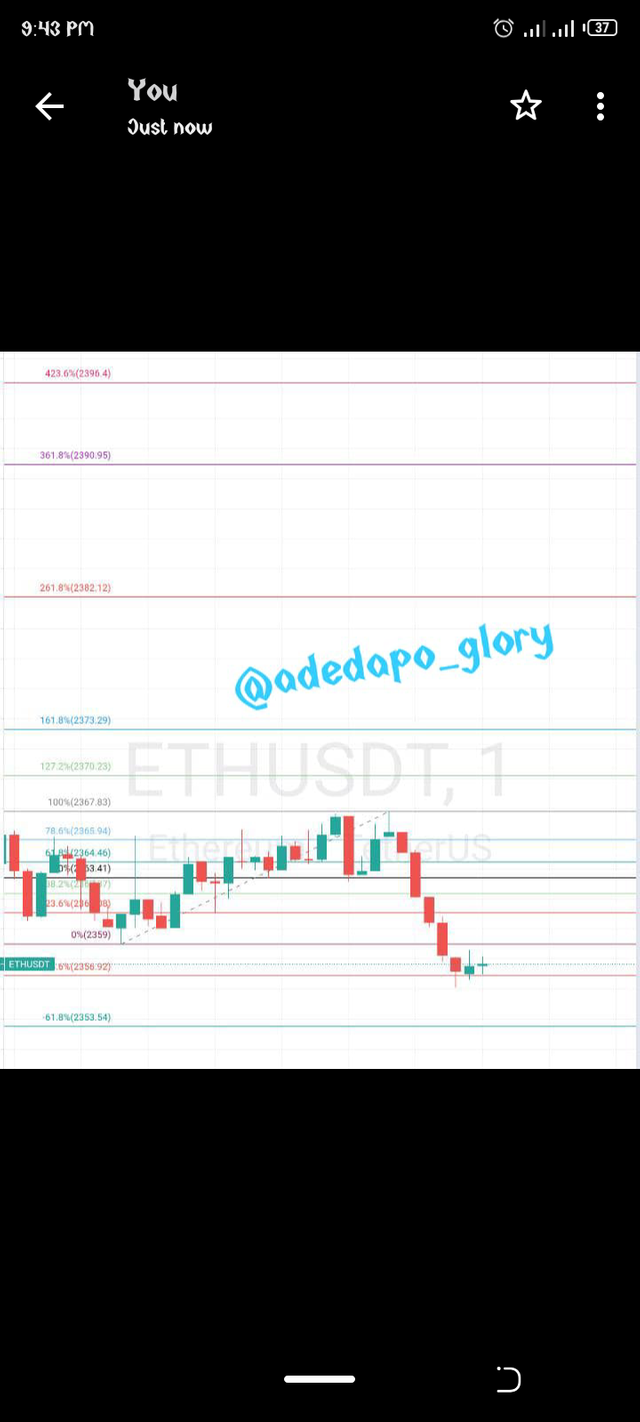
This chart is one for ETHUSDT, I will be making use of the trading view platform for this analysis. In traidng view to set up the Fibonacci retracement level is quite easy. It has been discussed above, all you need to do is open the platform get the pair you want to trade, then click indicator, search for the indicator Fibonacci then you select the preferred one.
According to this chart ETHUSDT is currently trading at $2356 as at the time of this analysis.
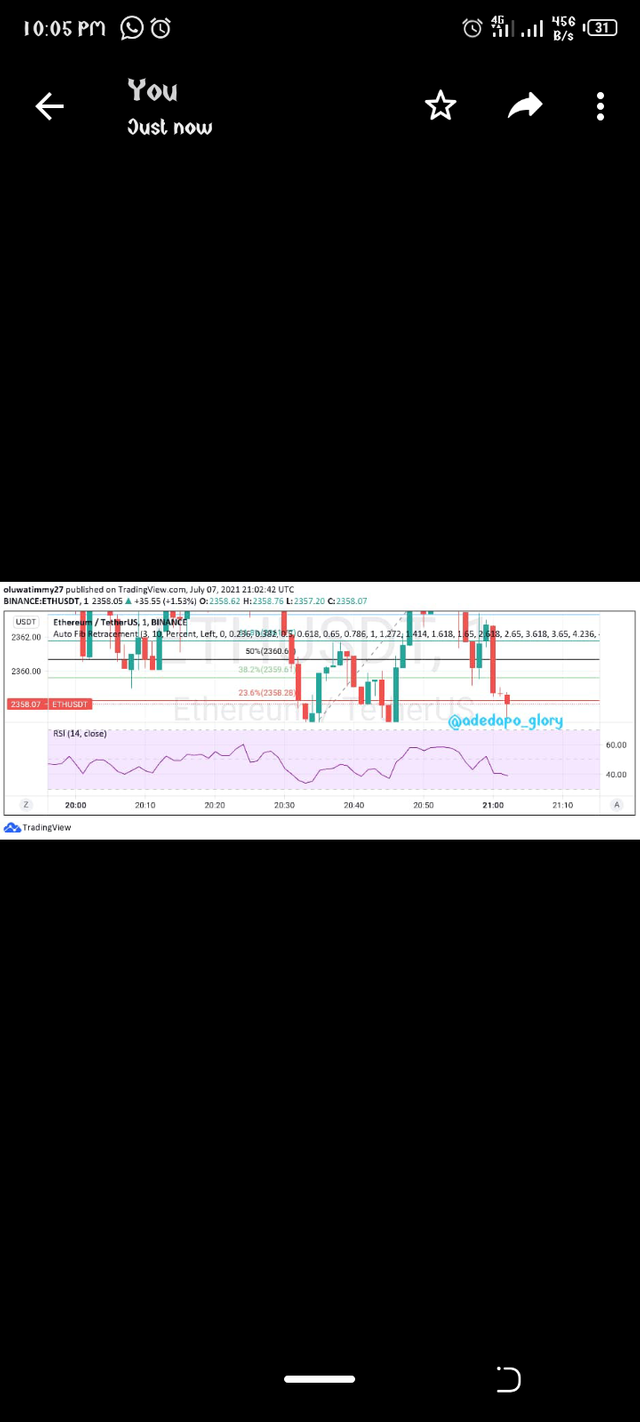
The market is currently undergoing a downtrend which is on the Fibonacci level of -23.6% after falling below the 50% level. There is a good chance for temporary reversal which can be a short profit for a trader.
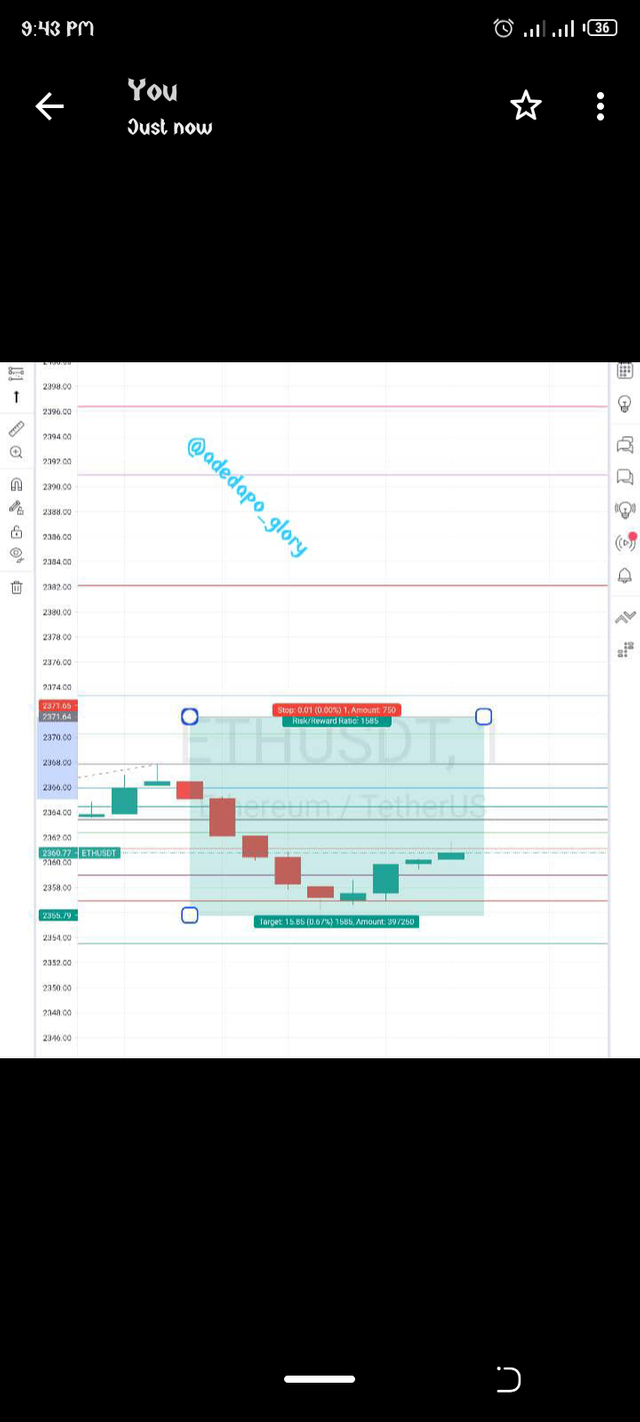
According to the chart there are two green candle which has indicated the reversal of the price and this is the perfect entry point for a trader. Once a trader enters at this price $2356
A trader can then set 3 multiple take profits points on the levels. The stop loss will be set a little below the last support, the stop loss will be at $2354. Then the first take profit will be at $2360 the 30% of the Fibonacci level and also sets another take profit on the 50% of the Fibonacci level, if there is a break out the final take profit can be at $2368 which is the 100% of the Fibonacci level.
If the price bounces back at 50% then the downward pattern will continue then a trader can sell or go short at this time.
According to the analysis made there was a breakout at 50% of the Fibonacci level which means the take profit at 100% might be triggered. There was a long wick at the 100% and this has made 100% Fibonacci level the new resistance level. The trader who set 100% as profit can still hold possition as it seems the order will be executed.
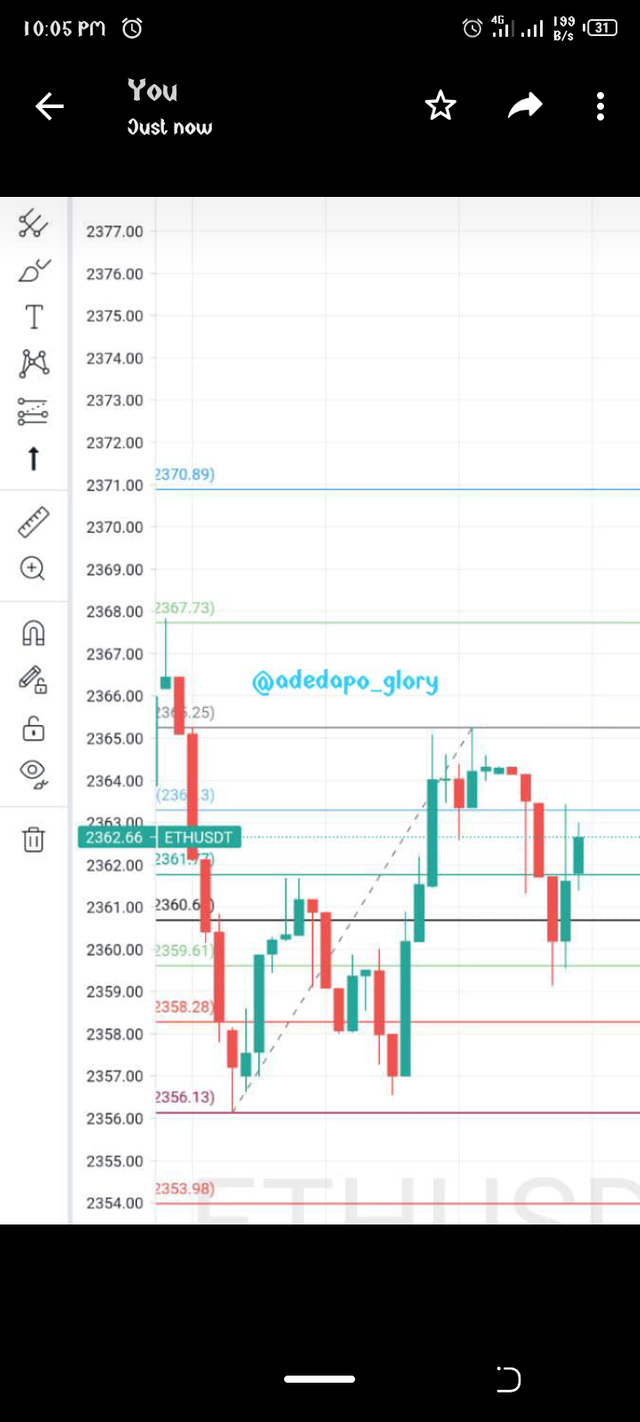
Using Relative strength index with the Fibonacci retracement level, we look out for a possible reversal signal from the RSI, which might occur when there is an overbought in the market. Overbought whereby the line falls towards or below 30 of the RSI chart.
If this is accomplished then a bullish movement is imminent. Right now the trend is in a zigzag movement and only little profits can be taken at this time.
As explained in the review my entry and exit strategy is quite easy taking profits little by little, this way I get my profits and can close the position if it's going against my prediction. Also setting the stop loss below the last support is a good trade management, until the price falls below the support, then there will be a little.loss for me due to the fact that I used a 1:2 loss and profit risk management.
In conclusion, Fibonacci retracement level is a good indicator for traders only after the principle has been well understood and it is quite neccessary to consider other tools while using the indicator.
Hi @adedapo-glory
Thanks for participating in the Steemit Crypto Academy
Feedback
This was more of a practical task. You did not correctly plot the Fibonacci retracement levels of the charts. You were meant to showcase your understanding of trading with the Fibonacci retracement levels on the charts. This is well applied in trending markets. You had to locate 2 points of the charts (For both the 0 and 100% levels)
For an Uptrend, the 0 Fibonacci retracement level is meant to be up and the 100% level is supposed to be down. You had to clearly indicate the price point where you were determining the retracement level for your trading.
Homework task
3
Downvoting a post can decrease pending rewards and make it less visible. Common reasons:
Submit