The Wycoff method
When we talk about technical analysis and don't discuss about Wyckoff method, it's just like leaving the salt out of a food. Wyckoff method was developed in 1930 by Richard Wyckoff Demille, it is a technical analysis tool that has alot of principles and strategy that was designed for trade lovers and investors.
It was initially developed for stock markets but has been modified by modern technical analyst to be able to use in any form of market.
This method shows that prices can be forecasted through analyzing of some data's like.the price, volume and so on. He talked about placing long orders when accumulation period( we will talk about this when we move on) is about to end and price begins to move up and take a short position when the supply is bigger than the demand.
The trading methods of successful traders like Jesse Livermore is what inspired Wyckoff method and this is what made his nthod unique.
Wyckoff research includes alot of theories and methods which we will discuss below.
This methods are called
The fundamental law of Wyckoff method.
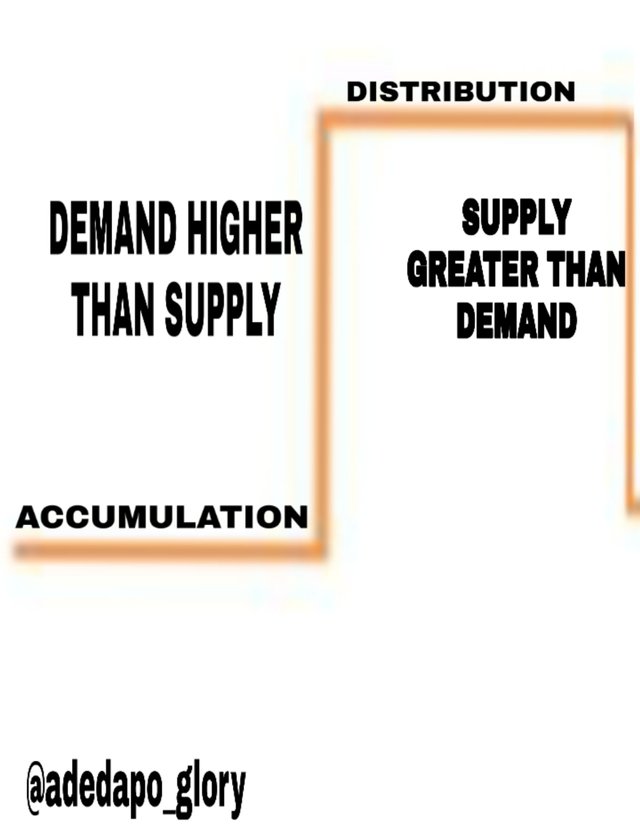
- Supply and demand: going back to economics, it was states that when the demand is greater than supply it always leads to an increase in price and when the supply is greater than the demand it leads to decrease in price. This supply and demand is very Paramount when it comes to price determination and this is also applied to charts.
Whenever demand is same with supply there is no change in the price of the market. In a nutshell, when there is more buy in the market there is always a increase in price and when there is more sell there is always a decrease in price.
- Cause and Effect: This law simply means that without any event there is no movement in price action. The events determines the effect on the price of the market. This is a bit related to the first law of demand and supply.
This law is based on 2 principles called the
a) Accumulation period: this is the cause in this sense and its effects is usually a rise in price while
b) Distribution period: this is the cause and its effect is a fall in price.
Wyckoff used this method to define trades and this enable him to know the trend in which the market will go after moving out from a stable range.

- EFFORT VS RESULTS: A change in price is as a result of an effort. When there is no significant change in the volume of an asset on the chart that means the effort is low and when there is a change in the volume that means the effort is high. When the price action is same as volume there is a high possibility that the trend will continue and when there is a difference it means a trend reversal is imminent.
Now that we know how the law works this lead us to what we call the composite man.
COMPOSITE MAN
The whole law is based on an imaginary entity that is believed to control the market as it is made known by Wyckoff, this entity is regarded to as a composite man.
Wyckoff said each trader and investor should look at the market like it's just a single man that is controlling the market not a group of investors or an organization.
From his method we have seen that a composite man will want other investors or traders to go into the project which he has gotten alot of it at a very low price.
For one to understand the market one need to read the chart and look for reasons behind any action the composite man will take. The composite man is a tricky player, he uses a predictable strategy and makes profit from investors who aren't very much knowledgeable about trading.
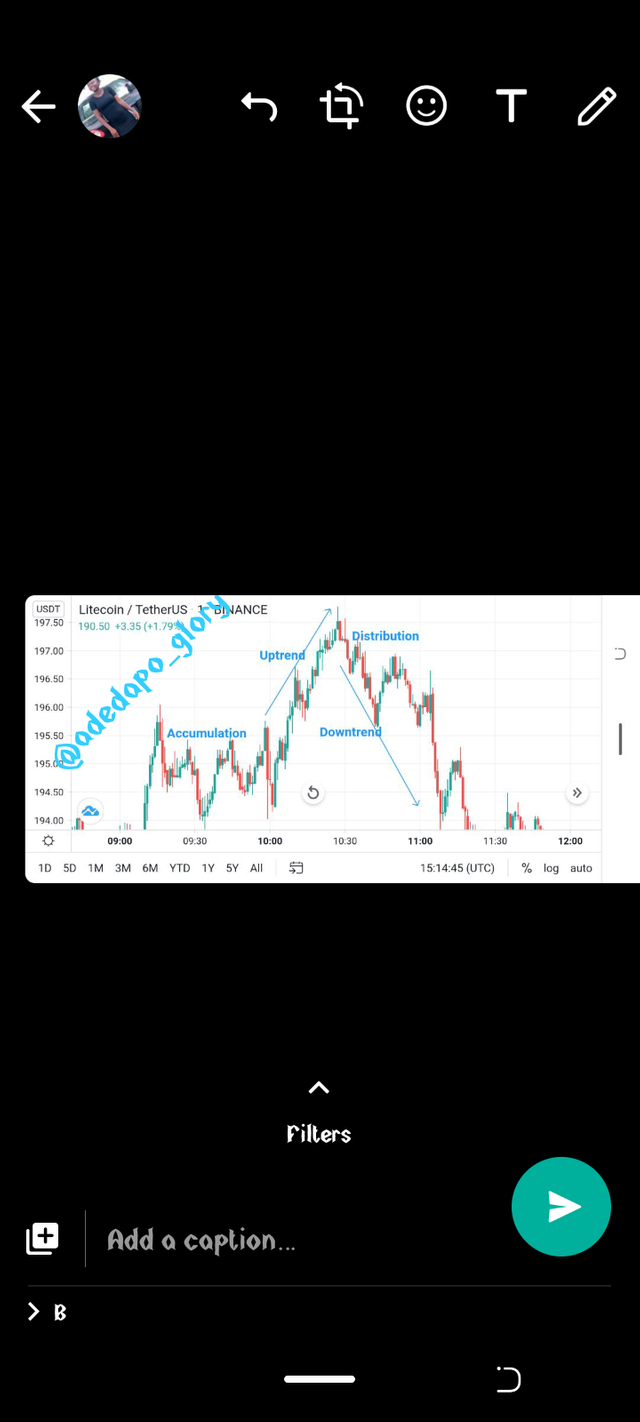
The composite man has a strategy he use which consists of 4 principle accumulation, upward movement, distribution and then downward movement.

Check out the screenshot above.
Accumulation: this is the period where there is no much movement in the market. The market is on a normal trend, it's at this period the composite man acquired a large amount of the token in a cheap price.
Upward movement: after the accumulation period there are more demand than supply and the asset gets scarce, the price of the assets then begin to rise and this will attract more investors.
The pressure on the assets causes it to move up faster and sometimes there is always a re accumulation period where the price comes stable and attracts more investors.
Distribution: this stage is where the composite man starts thinking of selling his assets, he might begin to sell it little by little and this will attract investors who will take it for a dip and tap into it. This movement is always a stable price movement.
Downward movement: the composite man sells part of his asset and this will cause a big reduction in the price of the asset, then out of fear the rest of investors will also begin to take profits and this makes the supply much more than the demand and the price will be extremely low again then the process starts over again.
As we have seen, there are many things to pay attention to when applying this method. It is somehow difficult at first, till you understand how it works.
HOW TO ANALYZE MARKET WITH WYCKOFF METHOD
To use the Wycoff method the first procedure is to study the market that you wish to trade on very well. Look out for the trend whether it's a bullish market or a bearish market.
You can use other technical analysis. Also do research about the asset check if it's moving against the trend or with the trend of the market. .
Then you use your chart to also check for the movement of the coin. If needed also try to compare the coin you want to trade with other CRYPTOCURRENCY and check the correlation between them.
Chart analysis of LITECOINUSDT PAIR Using Wycoff method

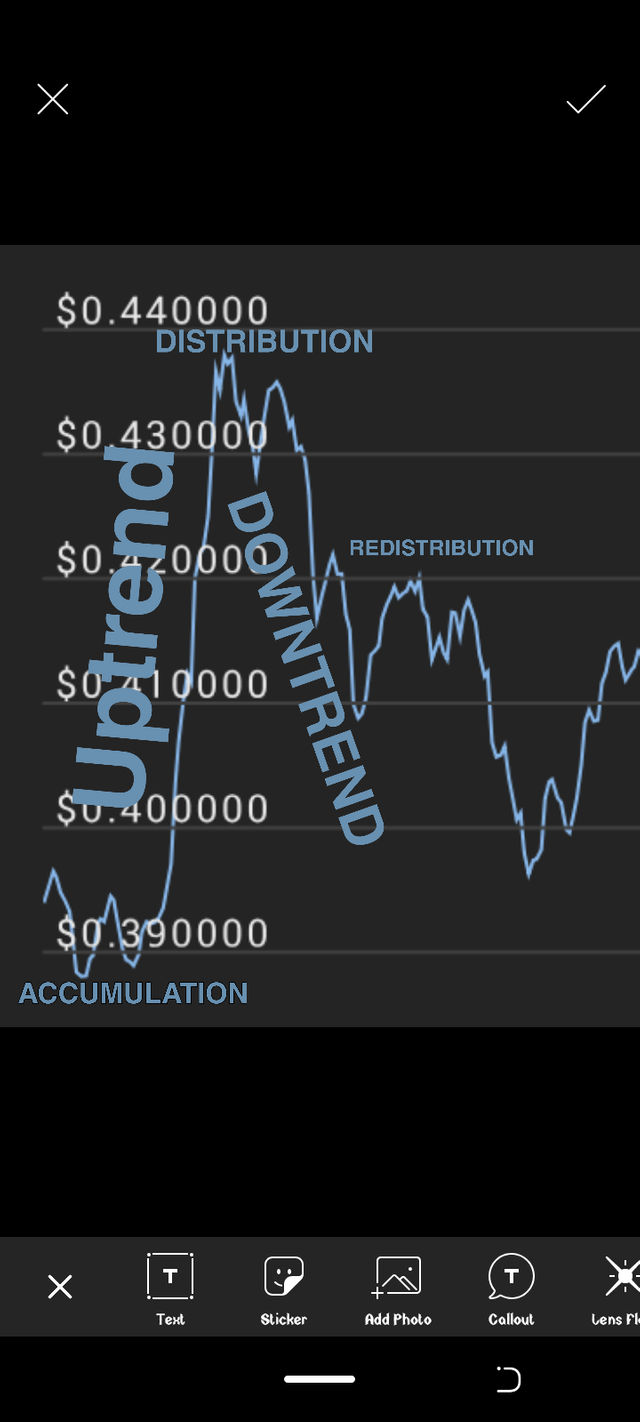
According to what we learnt in the lesson above, wyckoff method has to do with 4 cycle which we will try to locate in a chart and try to predict the next cycle by what we see. In this litecoinusdt pair we can see that the price of the coin has just finished a cycle where the accumulation period has a stable price before the uptrend movement and then the distribution came in shortly before the downtrend began.
Also we saw that there was a redistribution after the little downtrend. Then there was another sell off which lead to a dip. If a trader is to enter this trade, he has to check out for an accumulating period so as to tap into it as early as possible before the uptrend.
After the cycle we can see that an accumulation period is imminent.with the use of other technical analysis tool, once the trader confirms it's a good entry point he or she is good to go.
Conclusion
Wyckoff method is one of the best and most simple tool to use even when it has been in existence for several decades it is still useful in today's market trading. It is good for both investors and traders by showing them the entry and exit sign. It also helps to show the pattern at which the market will move.
This method also help not to trade or invest with emotions when market move against one trade.
Note: without the four cycle phase, there is no wyckoff method. Also, there is no technical analysis tool that is 100 percent sure, so always take caution while you trade.
Thank you for being part of my lecture and completing the task!
My comments:
Nice work on the explanations! They were really good! :)
Still, the chart looks a bit messy, I wish you had showed and identified it in a clearer way, cause in this print i really don't understand if you can prdict the path. Also, the volume is a really important part of this method, so that was missing as ewll.
Overall score:
5/10
Downvoting a post can decrease pending rewards and make it less visible. Common reasons:
Submit