Hi fellows today i am here to write my homework task that is given by @kouba01 which is related to oscillator index RSI. The lecture delivered by professor is very informative and comprehensive . let's start
What is the Relative Strength Index - RSI and How is it Calculated?
The relative strength index (RSI) is an options trading metric that calculates the extent of recent market movements to determine if a commodity or other asset is overbought or oversupplied. The RSI is described by an oscillator (a line graph that passes between two extremes) with a range of 0 to 100. J. Welles Wilder Jr. created the indicator and published it in his groundbreaking 1978 book "New Ideas in Technological Trading Systems."
The RSI was created to show whether a protection is overbought or oversold based on recent price levels. The RSI is determined by averaging price increases and decreases over a specified time frame. With values ranging from 0 to 100, the default time interval is 14 periods.
The Formula for RSI
The estimate uses the cumulative percentage benefit or loss over a look-back time as the mean gain or loss. The average loss is given a positive value in the formula.
RSI 1st step =100− [100/ [1+Average loss/Average gain]

The initial RSI value is calculated using 14 cycles as norm. Consider the case that the index has closed higher seven times in the last 14 days, with an average increase of 3%. The subsequent seven days all ended with a loss of 1.5 percent on average. The following extended estimate for the first component of the RSI will look like this:
55.55=100− [1001+3%/14 1.5%/14)⎦
The second component of the RSI formula may be determined until there are 14 cycles of data available. The effects are smoothed over in the second stage of the equation.
Step 2


Can we trust the RSI on cryptocurrency trading and why?

RSI is the most key culprit in crypto market.
The Relative Strength Index (RSI) is a strong metric that can be used in any market, including the cryptocurrency industry. It's a really basic predictor, but it's a great place to start studying technical research.
The key purpose of the RSI indicator is to determine the connection between price and actual offer/demand. This measure is particularly useful for detecting places where currencies are at the height of their power or at the depths of their weakness.

How do you configure the RSI indicator on the chart and what does the length parameter mean? Why is it equal to 14 by default? Can we change it?

.jpeg)
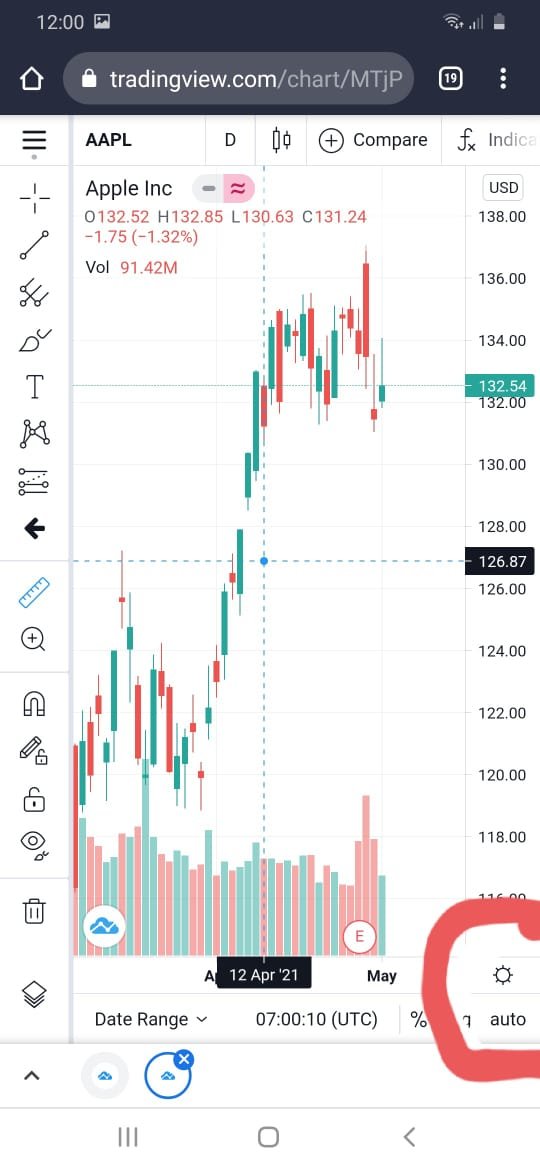
Length:
The number of bars that the indicator analyses to determine the average value is called the length (period). The time is set to 14 by design. This assumes that the price shift from the previous 14 days is factored in.
Here is the input section which carries the length, source and indicator time frame.


How do you interpret the overbought and oversold signals when trading cryptocurrencies? (Screen capture required)

With the aid of my trading app, I'll describe it. After you've logged into the app,
To find the properties you're searching for, click the top left corner.
Pick BTC/USD and tick all assets.
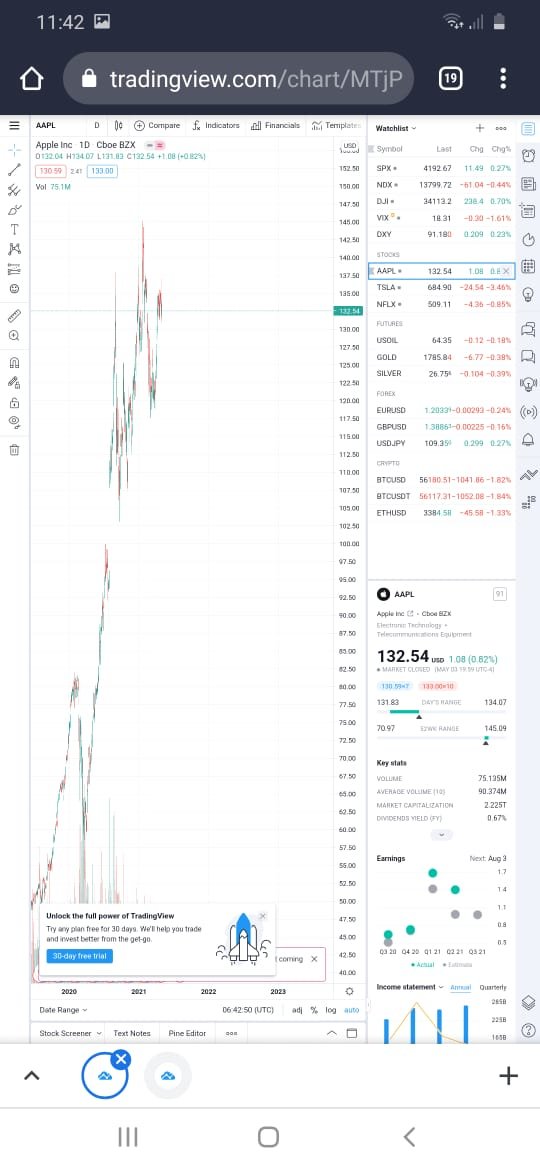
Then return to the main tab, where the map will be automatically mounted.
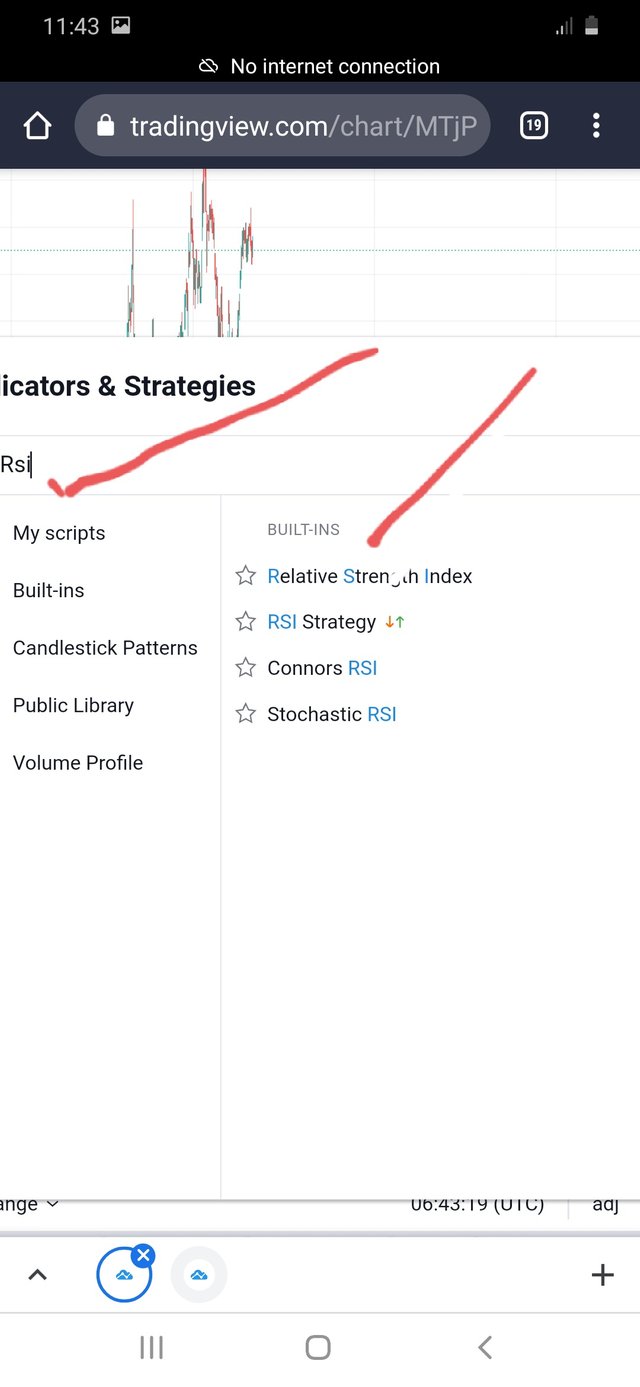
There is a heading by the name of signs just below the map. When you click on it, a list of indications will appear. You may also do a search. Let's call it RSI.
The RSI graph will appear below the price chart as soon as RSI is chosen
.jpeg)

How do we filter RSI signals to distinguish and recognize true signals from false signals. (Screen capture required)

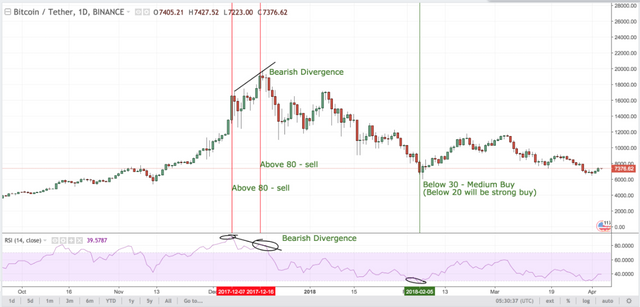
Values of 70 or higher on the RSI, according to traditional understanding and usage, mean that a protection is being overbought or overvalued, and could be poised for a pattern reversal or correction pullback in stock. A reading of 30 or less on the RSI means that the market is oversold or undervalued.
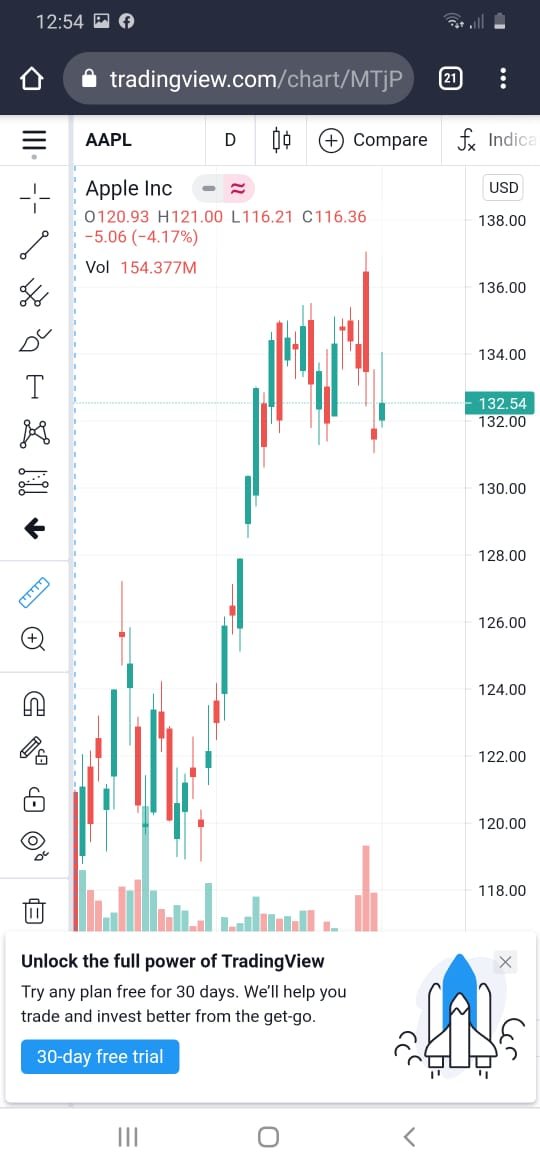
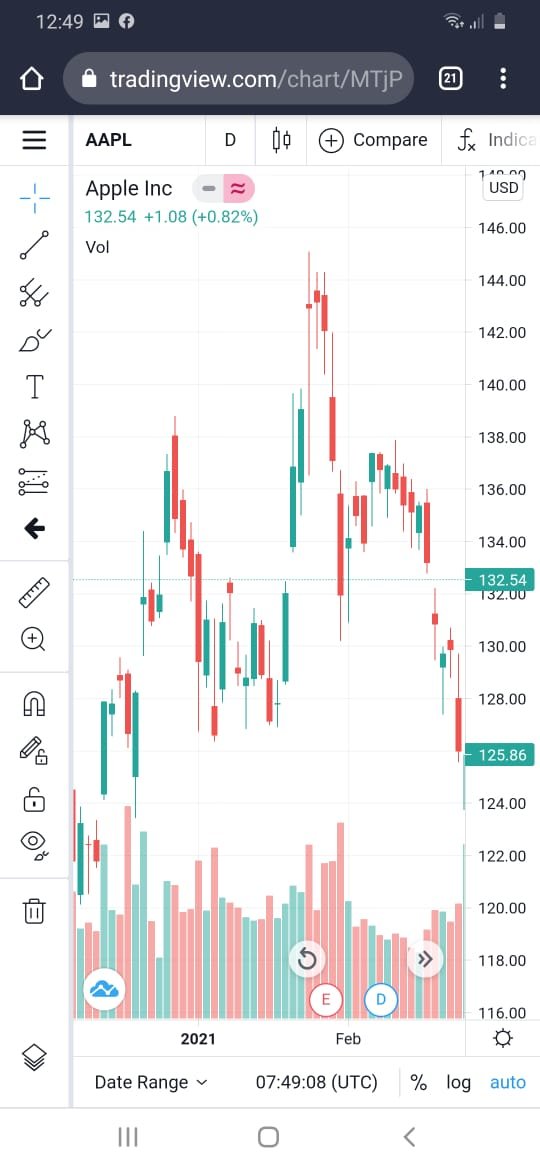

Review the chart of any pair (eg TRX / USD) and present the various signals from the RSI. (Screen capture required)

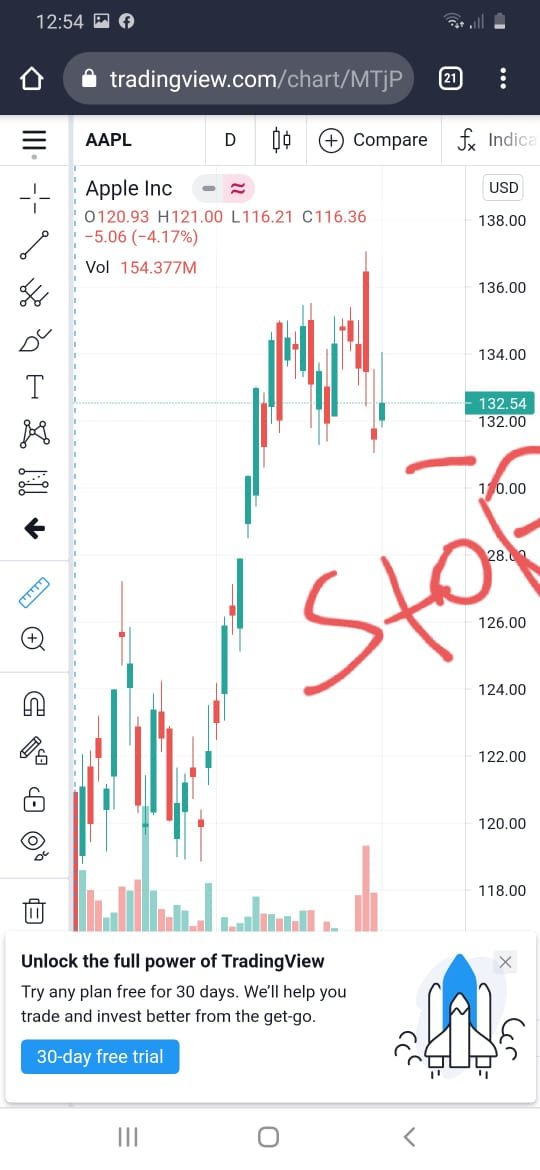.jpeg)
Above screenshot taken from trading account. so we can se that is valves going to be in negative -132.54.

Conclusion :

Experts also created metrics that help traders forecast trade timing and patterns. All of them is RSI. The RSI is a momentum oscillator that helps traders identify oversold and overbought signals and position buy/sell orders as a result. RSI may be a useful instrument in the possession of traders when used in conjunction with other metrics.

Hello @adnanyassin,
Thank you for participating in the 4th Week Crypto Course in its second season .
Unfortunately, your post will not be voted on, because you do not have at least 100 SP in your wallet.
Downvoting a post can decrease pending rewards and make it less visible. Common reasons:
Submit
hi sir i maintain my SP please check
Downvoting a post can decrease pending rewards and make it less visible. Common reasons:
Submit