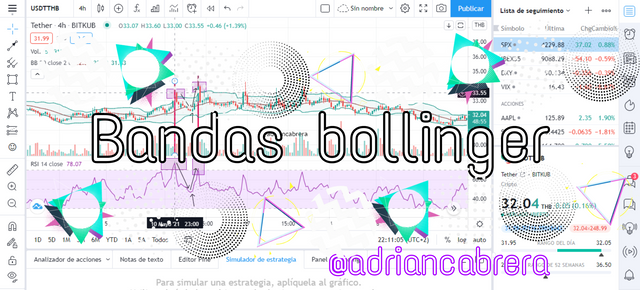
Es un placer estar nuevamente por aquí para cumplir con la asignación del profesor @kouba01 realmente su clase nos deja gran enseñanza y lo más importante es que gracias a esto se nos abren nuevos horizontes.
It is a pleasure to be here again to fulfill the assignment of the teacher @kouba01, his class really leaves us great teaching and the most important thing is that thanks to this new horizons are opened for us.
Defina el indicador Bandas de Bollinger explicando su método de cálculo, ¿cómo funciona? y ¿cuál es la mejor configuración de Bollinger Band?
En relación a las bandas Bollinger podemos comentar que son los indicadores más utilizados por los operadores del mercado, ya que su método ayuda a comparar la alta volatilidad de la cotización de cualquier criptomoneda o accion,y además el valor relativo del precio en tiempo determinado.
Antes de continuar hay que dar los méritos a su creador John Bollinger el cual baso su método en tres bandas, las cuales se dibujan por diferentes partes de un gráfico de precio, este método salió a la luz en la década de los 80.
La definición de las bandas son las siguientes;
Es una medía movil la cuál se aplica con una medía movil sencilla, y su estándar es de 20 periodos.
Esta banda basa su calculo en la suma del valor de la media móvil simple más dos veces la desviación común de la medía movil.
Y la banda inferior basa su calculo restando a la media móvil simple dos veces la desviación común de la media móvil.
Define the Bollinger Bands indicator by explaining its calculation method, how does it work? and what is the best Bollinger Band setting?
In relation to the Bollinger bands we can comment that they are the most used indicators by market operators, since their method helps to compare the high volatility of the price of any cryptocurrency or stock, and also the relative value of the price in a given time.
Before continuing, we must give credit to its creator John Bollinger who based his method on three bands, which are drawn by different parts of a price chart, this method came to light in the 80s.
The definition of the bands are as follows;
Center band
It is a moving average which is applied with a simple moving average, and its standard is 20 periods.
Upper band
This band bases its calculation on the sum of the value of the simple moving average plus twice the common deviation of the moving average.
Lower band
And the lower band bases its calculation by subtracting from the simple moving average twice the common deviation of the moving average.
4.png)
Para explicar detalladamente la desviación común les comento, que es un parámetro estadístico el cuál proporciona gran parte de la Volatilidad.
Su forma de emplear es calculando las bandas, tanto así que al aplicarlo, las bandas responderán de forma rápida a las diferentes variables del precio, indicando alguna tendencia de alta o baja Volatilidad.
De igual modo la franja englobada entre las bandas superior e inferior tiene de forma estadística aproximadamente un 90 % de las continuas variaciones del los precios en el mercado, significando que los movimientos de precios que se encuentren fuera de las bandas son de mayor importancia.
Ahora bien si buscamos un uso específico de las bandas de bollinger le cuento que comúnmente le usan para identificar lapsos de alta y baja Volatilidad, asi mismo identificar tendencia en los diferentes precios y por último lograr la identificación de la fortaleza o debilidad en las distintas tendencias de precios.
To explain the common deviation in detail, I will tell you that it is a statistical parameter which provides a large part of the volatility.
Its way of using it is calculating the bands, so much so that when applied, the bands will respond quickly to the different price variables, indicating a trend of high or low volatility.
Similarly, the band encompassed between the upper and lower bands statistically accounts for approximately 90% of the continuous price variations in the market, meaning that price movements outside the bands are of greater importance.
Now if we look for a specific use of Bollinger bands, I will tell you that they are commonly used to identify lapses of high and low volatility, as well as identify trends in different prices and finally identify strength or weakness in different trends. of prices.
Este se basa en el valor de la desviación común la cual se incrementa conforme aumenta la Volatilidad y de igual manera baja si la Volatilidad disminuye, por otra parte la anchura de las bandas está determinada por el valor de la desviación ocasionando que de manera automática se ensanchen producto a la Volatilidad del precio solo cuando aumenta,y si es al contrario se estrechan acercando la bandas tanto superior como inferior.
Eso en relación a la más básico, pero cuando se produce un estrechamiento en las bandas de manera radical y sorpresiva anuncia, una alerta en cuanto a movimientos en los precios, es decir que es una fija, ahora lo que si es que hay que estar pendiente del sentido al cual se moverán ya que los precios estáran en una posición relacionada con la media móvil adentro del estrechamiento en las bandas.
volatility indicator
This is based on the value of the common deviation which increases as the Volatility increases and in the same way decreases if the Volatility decreases, on the other hand the width of the bands is determined by the value of the deviation causing that automatically they widen product to the volatility of the price only when it increases, and if it is the opposite they narrow approaching both the upper and lower bands.
That in relation to the most basic, but when there is a narrowing in the bands in a radical and surprising way, it announces an alert regarding movements in prices, that is, it is a fixed one, now what if you have to be pending of the direction to which they will move since prices will be in a position related to the moving average within the narrowing in the bands.
.png)
En este Gráfico pudimos apreciar el estrechamiento del precio de la criptomoneda Theter el día 1ero de abril para luego tener una ruptura y provocar una alta Volatilidad que llevo los precios a más de 35$.
In this Chart we could see the narrowing of the price of the cryptocurrency Theter on April 1, and then have a break and cause a high volatility that took prices to more than $ 35.
Este identificador comúnmente se utilizan para el análisis técnico complementando el estudio en figuras de giros de tendencias.
Esa figuras se pueden ver reflejadas de la siguiente manera.
W o doble suelo, está figura indica cambio de tendencia bajista a alcista.
M o doble techo, en este caso la figura indica cambio de tendencia alcista a bajista.
Ahora bien si hay una Formación de una figura W o doble suelo,
en este análisis técnico, un doble suelo o W se forma en una tendencia bajista, y esta terminaría como una figura de cambio de tendencia.
Trend change identifier
This identifier is commonly used for technical analysis complementing the study in figures of trend turns.
These figures can be seen reflected in the following way.
W or double bottom, this figure indicates a change from a downtrend to an uptrend.
M or double top, in this case the figure indicates change from upward to downward trend.
Now if there is a Formation of a W figure or double bottom,
In this technical analysis, a double bottom or W forms in a downtrend, and this would end up as a trend reversal figure.
Hay que decir que los precios se conceptuan altos en el momento en que tocan la banda superior y en contraste será bajo al momento que toque la banda inferior
Desde un punto de vista técnico, por la propia definición de las bandas, los precios se consideran relativamente altos cuando tocan la banda superior y relativamente bajo cuando tocan la banda inferior. Ahora en el caso que estén por fuera de las bandas no serán determinantes ya que se tomará como refuerzo de la tendencia en curso.
identifiers of strength or weakness
It must be said that prices are considered high when they touch the upper band and in contrast they will be low when they touch the lower band
From a technical point of view, by the very definition of the bands, prices are considered relatively high when they touch the upper band and relatively low when they touch the lower band. Now, in the case that they are outside the bands, they will not be decisive since it will be taken as a reinforcement of the current trend.
Cuando hablamos de sobrecompra es por qué se entiende que algún activo está sobrecomprado al momento de negociar con un precio excesivamente alto,para ello las bandas bollinger en su método identifican en el preciso instante que el precio le alcanza en su banda superior.
Ahora bien si hablamos de estimaciones está descartado que el precio suba más allá de la línea ya que en muy pocas ocasiones sucede, y es cuando los tráider y comerciantes en el criptomercado aprovechan para obtener ganancias ya que lo más seguro es que caiga a la banda central.
En relacion a la sobreventa podemos decir que es todo lo contrario de la sobrecompra definiendo su accion dónde el precio del Activo toca la banda inferior, convirtiéndose en sobrevendido esto después que el precio estuvo excesivamente bajo.
Pudiendo los inversores comprar a un buen precio para luego obtener ganancias al momento que toque la banda media o la superior.
Overbought
When we talk about overbought, it is because it is understood that an asset is overbought when trading with an excessively high price, for this the Bollinger bands in their method identify at the precise moment that the price reaches its upper band.
Now, if we talk about estimates, it is ruled out that the price rises beyond the line since it rarely happens, and that is when traders and traders in the crypto market take advantage of it to obtain profits since it is most likely to fall to the band central.
Oversold
In relation to oversold we can say that it is the opposite of overbought defining its action where the Asset price touches the lower band, becoming oversold after the price was excessively low.
Investors being able to buy at a good price and then obtain profits when it hits the middle or upper band.
.png)
En resumen, las diferentes circunstancias no dan garantía que los precios cambien por que sean altos o bajos, cuestión que nos deja la duda, pero que le vamos hacer si en el criptomercado todo es un riesgo,y ya queda a consideración nuestra y realizamos el movimiento indicado es por ello que es recomendable que se utilicen otros indicadores en compañía de las bandas que de bollinger para tener mejor probabilidad de acierto.
In summary, the different circumstances do not guarantee that prices will change because they are high or low, an issue that leaves us in doubt, but what are we going to do if everything is a risk in the crypto market, and it is up to us and we make the The indicated movement is for this reason that it is recommended that other indicators be used in the company of the Bollinger bands to have a better probability of success.
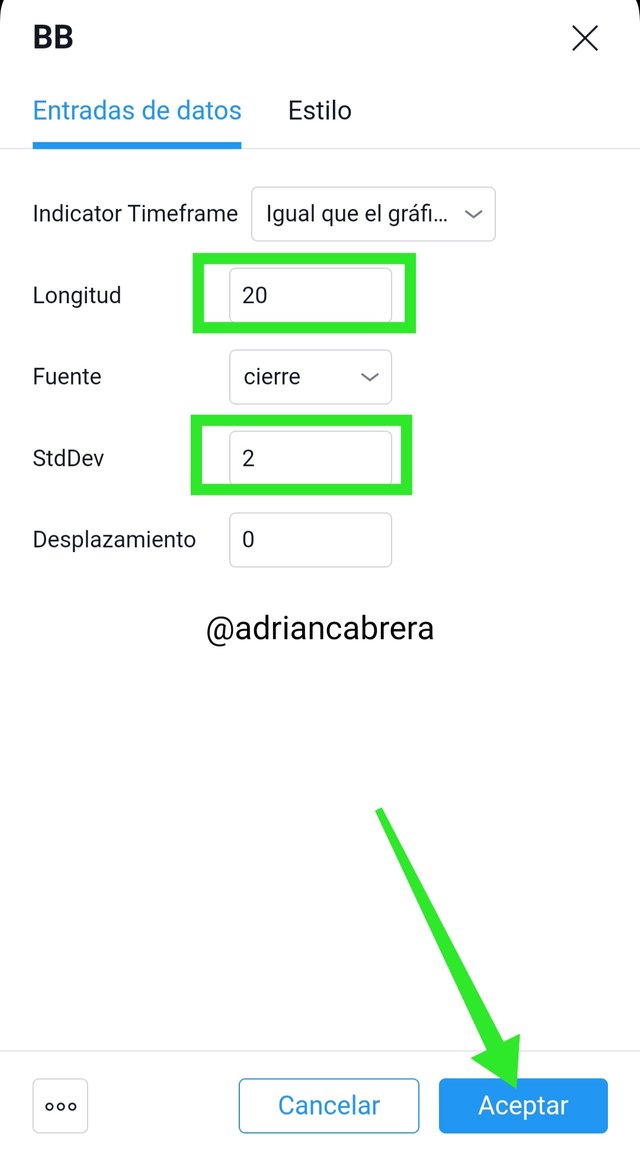
Cuando hablamos de la mejor configuración tenemos que hacer la salvedad que los parámetros estándar son 20 períodos de media móvil y 2 desviaciones es decir que esa sería la configuración universal lo que si no sabemos es si es las mejor ya que desde mi punto de vista todo va a depender de la operación que busque el comerciante la cual se adaptará a sus circunstancias, todo es cuestión de ir experimentando y luego cada quien definirá su mejor configuración de bandas de bollinger.
When we talk about the best configuration we have to make the exception that the standard parameters are 20 periods of moving average and 2 deviations, that is to say that this would be the universal configuration, what if we do not know is if it is the best since from my point of view everything It will depend on the operation that the trader is looking for, which will adapt to his circumstances, it is all a matter of experimenting and then each one will define his best Bollinger band configuration.

¿Qué es una ruptura y cómo se determina?
En relación a la ruptura de las bandas bollinger podemos decir que eso es universal ya que en los diferentes indicadores se habla igual de ruptura, las cuales juegan un papel fundamental para que se den los cambios de tendencia, en el caso de las bandas de bollinger se manifiesta al momento que se produce una separación, y luego de la ruptura las diferentes velas se ubican por fuera de las bandas, esto presagiando un cambio de tendencia, el enigma es saber para donde será!
What is a breakup and how is it determined?
In relation to the breakdown of the Bollinger bands, we can say that this is universal since the different indicators speak of the same breakdown, which play a fundamental role for the trend changes to occur, in the case of the Bollinger bands. it manifests itself at the moment that a separation occurs, and after the break the different candles are located outside the bands, this heralding a change in trend, the enigma is to know where it will be!
.png)
En este Gráfico podemos apreciar que las rupturas se producen al momento de rebasar tanto la resistencia comoel soporte.
Ahora en cuanto a su determinación vamos a ver el siguiente Gráfico como luego de superar los soportes se produce una tendencia la cuál dispara la Volatilidad y crea oportunidad para que los tráider aprovechen de obtener ganancias y luego se mantiene en una prolongación hasta llegar a la próxima ruptura dónde se produce la tendencia bajista.
In this Chart we can see that breakouts occur when both resistance and support are exceeded.
Now in terms of its determination we are going to see the following Chart as after exceeding the supports a trend occurs which triggers the Volatility and creates an opportunity for the traders to take advantage of obtaining profits and then remains in an extension until reaching the next break where the downtrend occurs.
.png)
Cómo utilizar las bandas de Bollinger con un mercado en tendencia?
Para responder está pregunta tomaré un gráfico dónde la entrada será el 2 de abril con un precio de 31.39 momento en el que las bandas vienen de una ruptura y se recojen para dejar la mesa servida a una tendencia y por suerte es Alcista, la cual se pudo aprovechar según mi análisis en 5 ocaciones claves hasta llegar hasta lo más alto de la tendencia, pero de igual manera los que jugaban a la inversa pudieron ir aprovechando en lapso cortos para comprar y sacar algunas ganancias con todo y que la tendencia era en alta.
How to use Bollinger Bands with a trending market?
To answer this question I will take a chart where the entry will be on April 2 with a price of 31.39, moment in which the bands come from a break and are collected to leave the table served to a trend and luckily it is Bullish, which is According to my analysis, he was able to take advantage of 5 key occasions until he reached the top of the trend, but in the same way, those who played in reverse could take advantage of short periods to buy and get some profits with everything and that the trend was high .
.png)
Cuál es el mejor indicador para usar con las Bandas de Bollinger para que su operación sea más significativa
Si vamos a hablar de indicador hay muchos como por ejemplo el MACD el RSI los puntos de pivote por nombrar algunos, pero a mí manera de ver las cosas considero que el RSI es el más fácil de interpretar y considero que pudiera coincidir más con las indicaciones de las bandas de bollinger, vamos a comprobarlo con el gráfico de Tether.
What is the best indicator to use with Bollinger Bands to make your trade more meaningful
If we are going to talk about an indicator there are many such as the MACD, the RSI, the pivot points to name a few, but in my view, I consider that the RSI is the easiest to interpret and I believe that it could coincide more with the indications. bollinger bands, let's check it with the Tether chart.
.png)
Cómo pueden ver tome en el gráfico los momentos más significativos dónde luego de una ruptura se producen movimientos de tendencia tanto baja como alta, pero lo más importante es que el indicador RSI coincidió con las bandas de bollinger a la perfección comprobando que es el mejor indicador para trabajar con las bandas y que de esta manera los tráider tendrán más confianza a la hora de operar.
How can you see the most significant moments on the chart where, after a break, both low and high trend movements occur, but the most important thing is that the RSI indicator coincided with the bollinger bands perfectly, proving that it is the best indicator to work with the gangs and that in this way the traders will have more confidence when operating.
¿En qué período de tiempo funcionan mejor las Bandas de Bollinger y por qué?
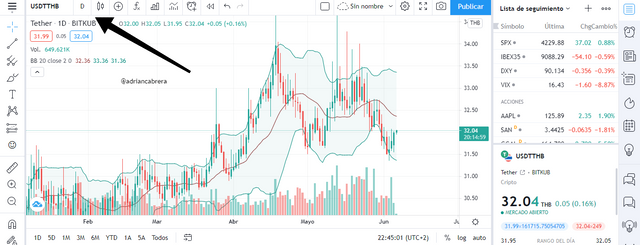
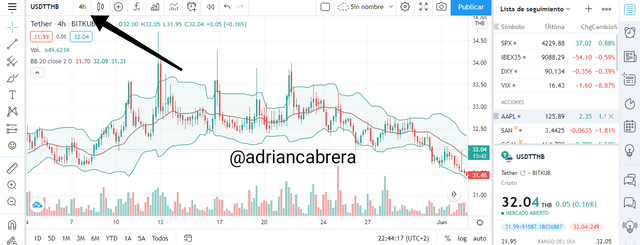
Durante la tarea lo he utilizado en diferentes tiempos y aunque el de 4 horas pareciera el mejor, considero que todo dependerá de lo que quiera el inversor, si me preguntan jejeje, en tiempo cortos se acerca más a su objetivo, aquí pondré varias capturas con tiempos diferentes para que puedan apreciar la diferencia.
In what time frame do Bollinger Bands work best and why?
During the task I have used it at different times and although the 4 hour one seems the best, I consider that everything will depend on what the investor wants, if you ask me lol, in short time it is closer to its objective, here I will put several captures with different times so they can appreciate the difference.


Revise el gráfico de cualquier par y presente las diversas señales que da el indicador Bandas de Bollinger.
Ya para finalizar las preguntas vamos a indicar las diversas señales a través del gráfico de Tether.
Review the chart of any pair and present the various signals that the Bollinger Bands indicator gives.
To finish the questions we are going to indicate the various signals through the Tether graph.
.png)
Comenzamos revisando e interpretando las bandas bollinger el día 06 de mayo al momento que aprietan y como ya es costumbre se viene una ruptura la cual es ratificada por el indicador RSI, en ese momento se presenta otra señal que es las velas fuera de la línea superior, lo que indica que se viene un alta Volatilidad y en este caso fue con la tendencia Alcista, posteriormente a la tendencia se presenta nuevamente otra ruptura pero en este caso se ensanchan las bandas para dar paso a la tendencia bajistas.
Es pocas palabras es momento para que los inversores compren a precio de gallina flaca.
We begin by reviewing and interpreting the bollinger bands on May 6 at the moment they tighten and as usual there is a break which is ratified by the RSI indicator, at that time another signal is presented which is the candles outside the upper line , which indicates that a high volatility is coming and in this case it was with the upward trend, after the trend another break is presented again but in this case the bands are widened to give way to the downward trend.
In short, it is time for investors to buy at the price of a skinny hen.
Si complementamos las bandas bollinger con otro indicador como el RSI tendremos un porcentaje significativo de acierto ya que en diferentes oportunidades coincidieron y la realidad es que cuando se habla de Prediccion las bandas bollinger llevan ventaja, su fácil interpretación además de su fuerza al momento de pasar por una ruptura da garantía de éxito en una óperacion.
Conclusion
If we complement the bollinger bands with another indicator such as the RSI we will have a significant percentage of success since on different occasions they coincided and the reality is that when it comes to Prediction, the bollinger bands have an advantage, their easy interpretation in addition to their strength at the time of passing for a break gives a guarantee of success in an opera.
De esta manera manera me despido esperando ser evaluado y que la tarea sea del agrado de los profesores.
Todos las capturas fueron tomadas del la plataforma https://es.tradingview.com/
In this way I say goodbye hoping to be evaluated and that the task is to the liking of the teachers.
All the captures were taken from the platform https://es.tradingview.com/
Buenas noches Prof @kouba01 tengo la duda si hoy no me califica ya mañana no lo hará, es por qué como en la indicaciones habla de hoy hasta las 11.59 pm por favor si es tan amable y me aclara la duda y muchas gracias de antemano.
Good evening Prof @kouba01 I have the doubt if today he does not qualify me and tomorrow he will not do it, it is because as in the indication he speaks of today until 11:59 pm, please if you are so kind and clarify the doubt and thank you very much in advance.
Downvoting a post can decrease pending rewards and make it less visible. Common reasons:
Submit
Buenos días Prof @kouba01 por favor si es tan amable de corregir mi tarea yo envié en los lapsos establecidos.
Downvoting a post can decrease pending rewards and make it less visible. Common reasons:
Submit
Prof @kouba01 gracias por el voto pero no me ha calificado, me parece raro que haya votado la tarea y no me haya corregido.
Downvoting a post can decrease pending rewards and make it less visible. Common reasons:
Submit
Hello @adriancabrera,
Thank you for participating in the 8th Week Crypto Course in its second season and for your efforts to complete the suggested tasks, you deserve a 10/10 rating, according to the following scale:
My review :
Work with excellent content, good answer to all questions with good analysis of most of the points raised. The result of your following a clear methodology and a set of accurate information.
Thanks again for your effort, and we look forward to reading your next work.
Sincerely,@kouba01
Downvoting a post can decrease pending rewards and make it less visible. Common reasons:
Submit
Mil gracias profesor y disculpe tanta molestia, y le soy sincero todo lo que he aprendido es gracias a ustedes aquí en la criptoacademia y claro que seguiremos..
Downvoting a post can decrease pending rewards and make it less visible. Common reasons:
Submit