QUESTION 1. What are the differences between Fundamental Analysis and Technical Analysis? Which one is used most often?
There are two major approaches used in the analysis of a cryptocurrency assets in order to take decision to trade and invest in them. These are fundamental analysis and technical analysis. Before I talk about the difference between this two analytical methods, let me highlight their meanings briefly.
FUNDAMENTAL ANALYSIS.
Fundamental analysis can be described as a method of analyzing cryptocurrency assets that involves an indepth study of everything that has to do with the asset in question. This includes the project behind the cryptocurrency, the developers, the blockchain under which the cryptocurrency was developed, the utility and future prospects of the project, and the market metrics of the cryptocurrency. It is an analysis which involves looking into all the factors that have the capability to affect or influence the value of a cryptocurrency asset.
TECHNICAL ANALYSIS.
Technical analysis can be described as a way of analyzing the market of a cryptocurrency asset using available market statistical tools to predict the future price of a cryptocurrency asset. It a method which studies the interaction between buyers and sellers using chart, and the action of the price. It is also the use of indicators to study the movement pattern of a cryptocurrency asset.
THE DIFFERENCES BETWEEN FUNDAMENTAL ANALYSIS AND TECHNICAL ANALYSIS
| FUNDAMENTAL ANALYSIS | TECHNICAL ANALYSIS |
|---|---|
| Fundamental analysis involves an understanding of a cryptocurrency basics through its performance, management and overall market conditions. | Technical analysis involves the determination of a cryptocurrency movement patterns by analysing historical price movements and volumes of trade. |
| It is conducted to know the in-built value of a particular cryptocurrency asset. | It is conducted to know the perfect time to invest or withdraw from the market |
| It is majorly used by investors and traders who are interested in long-term investment. | It is majorly used for short-term trading by scalp traders. |
| Decisions to buy or sell a cryptocurrency asset using this method of analysis involves seeking to know whether an asset is undervalued or overvalued. | Buy and sell signals come from support, resistance, trend lines and the and reading from indicators. |
| External news on cryptocurrency assets does not have affect fundamental analysis. | External news on cryptocurrency assets affects fundamental analysis. |
| Fundamental analysis uses both the previous and present data. | Technical analysis use solely the past data. |
| It is used for investment related functions. | It is used for trading related functions. |
It is apparently clear that technical analysis is more used as many individuals are after immediate gratification in trading. Not too many traders or investors wants to read a long note or make a wide research about digital assets before purchasing them. Many traders are after what would give them signals at the shortest period to make decisions about trades that would be profitable.
QUESTION 2. Choose one of the following crypto assets and perform a Fundamental Analysis indicating the objective of the Project, Financial Metrics and On-Chain Metrics. Cardano (ADA), Solana (SOL), Terra (MOON), Chiliz (CHZ), Polkadot (DOT)
For this question, I am going to be doing a fundamental analysis on Cardano (ADA).
CARDANO (ADA)
Charles Hoskinson started the creation of Cardano in 2015 and in 2017 he completed it and launched it. Cardano is an alternative to Ethereum as it is used in the running of smart contract just like Ethereum. It is an updated version of Ethereum and it is considered as a third generation platform with the aim of developing a decentralized interconnected system and also provide banking services to area of the world that operates without banks.
Majorly, Identity management and traceability are two of Cardano's most important uses. The former program can be used to streamline and simplify operations that involve data collection from numerous sources. The latter use can be used to follow and audit a product's manufacturing processes from raw materials to final goods, potentially eliminating the counterfeit market.
Cardano is also working on a smart contract platform that will provide a reliable and secure environment for the development of enterprise-level decentralized apps. Cardano's team wants to employ Project Catalyst, a democratic on-chain governance framework, to supervise the creation and execution of projects in the near future. They will also use Project Catalyst to overhaul its treasury management system in order to cover future charges.
FINANCIAL METRICS
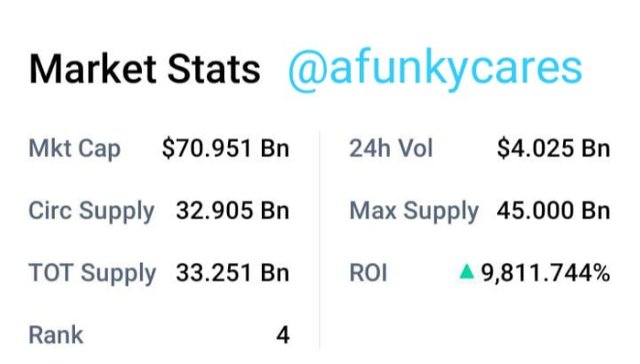
The native token of the cardano platform is ADA. It is ranked 4th in the coinmarketcap. As at the time of writing this post, it was trading at $2.15. It has a market capitalization of $70, 816,904,323B, a circulating supply of 32.90B ADA and a Total supply of 33.251B ADA.
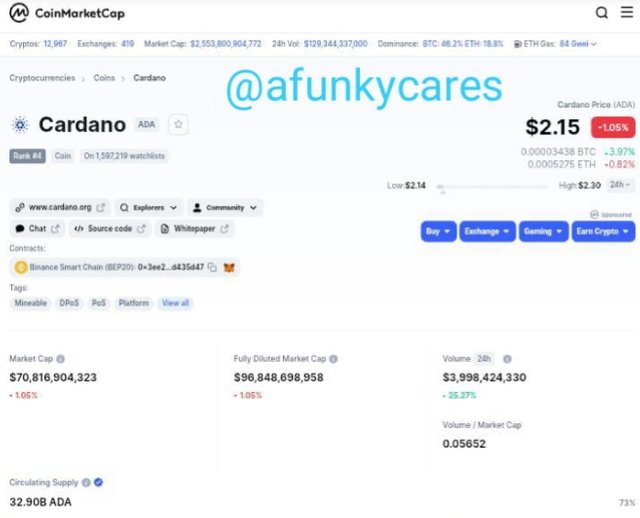
Coinmarketcap Site
ON-CHAIN METRICS
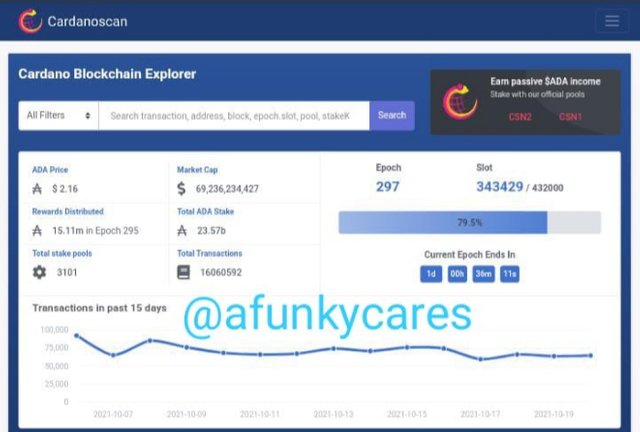
I visited Cardano explorer to get the on-chain metrics for cardano.
The following information on on-chain metrics were gotten.
Total Number transactions: 16060592
Market Capitalization: $69,236,234,427
Total Stake Pools: 3101
Volumes locked in Staking: 23.57B ADA
QUESTION 3. Make a purchase from your verified account of at least 10 USD of the currency selected in the previous point. Describe the process. (Show Screenshots).
The procedure taken to purchase the coin.
First of all, I analyzed the market using the stochastic oscillator, a technical indicator. At the point I wanted to buy, the price was still in a downtrend and the indicator was still in the oversold zone. I waited until the indicator started showing that the price was returning from oversold. At this time a second bill candle appeared in the chart. I was sure it's right to make a purchase.
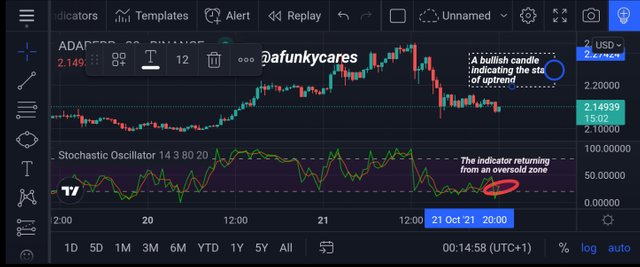
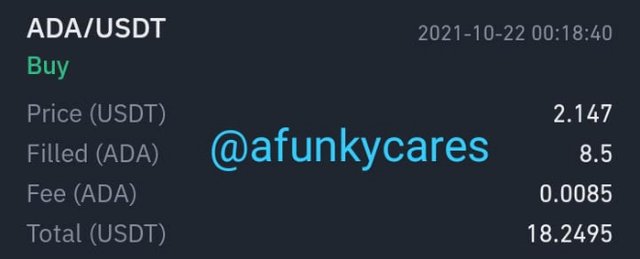
I switched to my binance app with which I I was to make the purchase. I placed a buy limit order at one of the high bid prices $2.147. In a short time, the order executed.
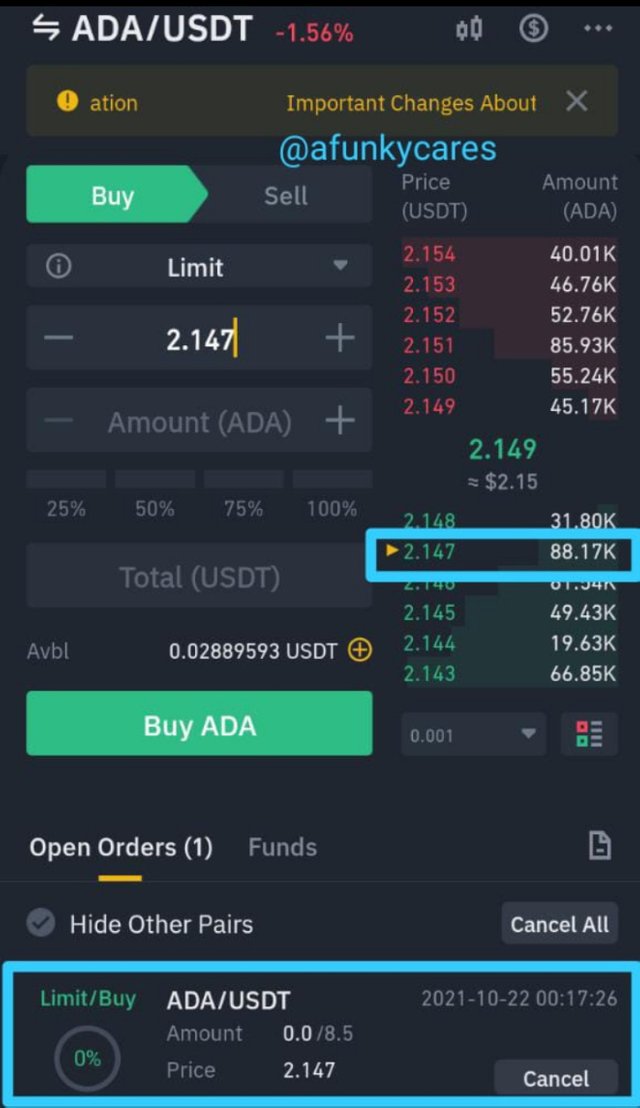
This is the detail of the order.
With 18.24 USDT, I purchased 8.5 ADA.
QUESTION 4. Apply Fibonacci retracements to the previously selected asset with a 4 hour time frame on the platform of your choice. Observe the evolution of the price at 24 and 48 hours, did it go up or down in value? Look to identify resistance and support levels. (Show Screenshots at 0, 24 and 48 hours of purchase where the date and time are observed).
To apply Fibonacci retracements, I observed the chart to ascertain the trend of the asset. After confirmation that the asset was in an uptrend, I drew the fibbonacci retracements from the bottom.
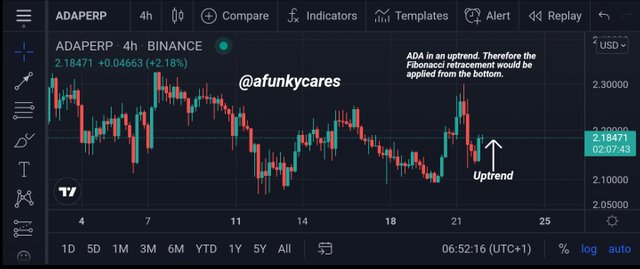
Screenshot from tradingview
Fibonacci Retracement At 0 Hour
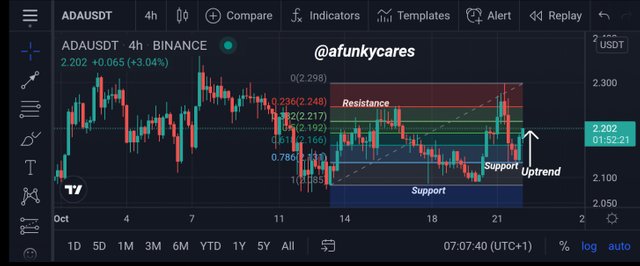
Screenshot from tradingview
As can be seen, the support and resistance points are indicated in the chart. The asset still continues in the uptrend.
QUESTION 5. What are Bollinger Bands? How do they apply to Crypto Technical Analysis? With which other tool or indicator do you combine Bollinger Bands to analyze a Crypto? Justify your answer.
Bollinger band is a technical indicator that is usually applied on a chart comprising of three lines. The line envelopes the chart to give signals at specific points. The three lines are called the upper band, middle band and lower band. The position of the price on the indicator determines what the price is doing. This means that the highs and lows formed as the price of an asset fluctuates are interpreted with the help of the indicator. The indicator gives signal when an asset is overbought or oversold.
An overbought signal is given when the price of an asset in a bull goes past the upper band. Similarly, an oversold signal is given when the price of an asset in a bear goes past the lower and.
A weak or weakening uptrend is seen when the price of an asset is found between the upper band and middle band. Also a weak or weakening downtrend is seen when the price of an asset is found between the lower band and middle band.
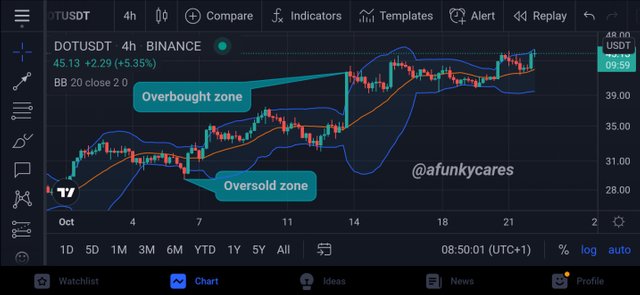
Screenshot from tradingview
Oversold and overbought signals can be given pretty quick by the Bollinger band indicator. To avoid trading with wrong signals, it is best to combine the Bollinger band indicator with indicator like Stochastic indicator to establish confluence before taking a decision on trades.
The Stochastic Oscillator just like the Bollinger Bands tells when an asset is overbought or oversold. This it does giving reading on a calibrated numbers on which the indicator points. The numbers calibrated on the indicator are between 0 - 100. The asset is overbought when the indicator is between the 100 and 80 points and between 20 and 0, the indicator reads oversold. At the point between 80 and 20, the price can be returning from a downtrend or uptrend as the case may be. Because of the overbought and oversold signals that the Bollinger band and Stochastic Oscillator show, they can be combined to make a successful trade.
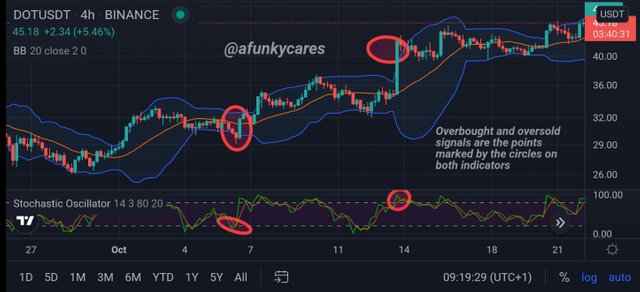
Screenshot from tradingview
From the screenshot above, it is clearly shown that Bollinger Bands and Stochastic Oscillator gave same signals at the same time as the asset was overbought and oversold.
Conclusions
Fundamental and technical analysis are two important analysis that a trader or investors should make before deciding to trade or invest in any cryptocurrency asset. This to avoid unnecessary losses.
While Fundamental analysis gives the information on the overall asset with which investors see future prospects, technical analysis gives past information about an asset with which one can take decision on immediate trade.
It has been a wonderful experience being a part of the course and participating in the homework. I look forward to other exciting topics from you and other professors. Thank You!
Gracias por participar en la Cuarta Temporada de la Steemit Crypto Academy.
Continua esforzandote, espero seguir corrigiendo tus asignaciones.
Downvoting a post can decrease pending rewards and make it less visible. Common reasons:
Submit
Correction noted. Thanks for the review professor.
Downvoting a post can decrease pending rewards and make it less visible. Common reasons:
Submit