
Rating: 6.5/10

Hello Professor @lenonmc21. Thank you for the insightful lecture. Here is my submission.
Define in your own words what Harmonic Trading is?
Before I explain what Harmonic Trading is, I would love to discuss Harmonic patterns.
WHAT ARE HARMONIC PATTERNS?
Harmonic patterns geometric shapes that uses Fibonacci numbers. Each part of a structured is based on the particular Fibonacci level. This makes the shape to take the most recent price action with the aim of predicting the direction price is to move
Harmonic pattern is often times used by long term or swing traders as it is usually on high time frames. The high time frame makes it difficult to use for day and Scalp traders.
It takes a long time for these patterns to be formed in a chart as they have quiet a number of procedures that must be completed. Daily and weekly time frame happens to be the most suitable time frame for trading with harmonic patterns.
Based in this premise, harmonic patterns are the shapes continuously and repeatedly formed on the chart of assets as the price moves up and down in the market. These patterns have been formed and repeated over time and are now useful in taking trading decisions.
Though many individuals are known for the different harmonic patterns known today, H.M Gartley is more popular as the pattern discovered by him is used the most by traders.
The patterns and their founders are listed below.
| Patterns | Founders |
|---|---|
| ABCD | H.M. Gartley |
| Crab | Scott Carney |
| Bat | Scott Carney |
| Butterfly | Bryce Gilmore |
| Shark | Scott Carney |
| Cypher | Darren Oglesbee |
Therefore, Harmonic Trading is a method of technical analysis that uses the movement patterns formed by a chart to predict the direction and length of movement of price in trading. These movements patterns are formed for both bullish and bearish market.
It should be noted that these movement patterns used to take trades decisions in the harmonic trading strategy only look alike but do not behave in the same manner all the time. This means that the patterns can be repeated some times and can also break at other times.
Define and Explain what the pattern AB = CD is and how can we identify it?
AB = BC pattern was developed by H.M Hartley. It is also called ABCD pattern. It is the most used pattern by traders. Many traders learns first to trade with this pattern before adopting others because it servers as the basics for others which are more complex and complicated.
In this pattern, AB and CD moves equal length while BC movement is used for correction. There are three guidelines that should be followed in the use of this pattern.
- AB is the point where the price starts to move. The movement must not go beyond the two points
- BC is a representation of 61.8% of the retracement of movement made by AB
- CD is a representation of 127.2% extension of the correction made by BC.
The guidelines given above are useful for a bullish AB=CD. The are carried out to know the point D where a buy signal is generated. This same steps are followed in a bearish AB=BC only that AB moves in the reverse direction that produces a buy signal at point D. Point D is the point of imminent change in price direction.
These guidelines used for these explanations will help identify both bullish and bearish using the AB = CD.
To explain this better,
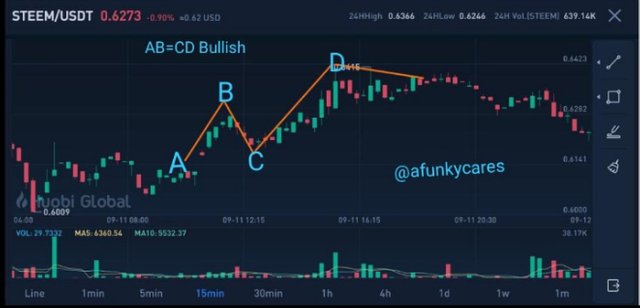
Screenshot from houbi.com
For AB = BC Bullish, the price of the asset must be in a downtrend. This is the way to locate the four positions. Once this have been done, the next thing to do is confirm the validity using Fibonacci retracement.
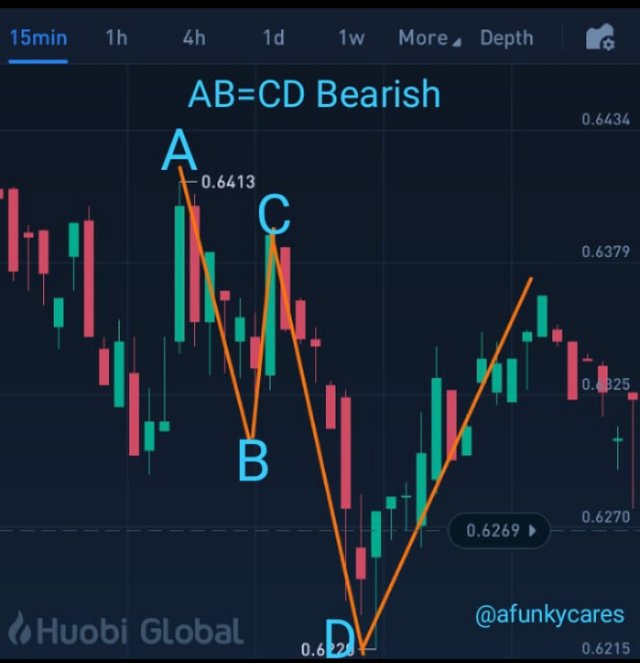
Screenshot from houbi.com
Also for AB = BC bearish, the price of the asset must be in an uptrend. This is the way to locate the four positions on the chart. Once this have been done, the next thing to do is confirm the validity using Fibonacci retracement.
Clearly describe the entry and exit criteria for both buying and selling using the AB = CD pattern?
Entry criteria for buy and sell with AB = CD Pattern
Mark points A, B, C and D in the chart of the asset.
Validate if C is found between 61.8% & 78.6% in the Fibonacci retracement and D is found somewhere at the middle of 127.2% and 161.8% for the 4 points to be valid. Do this by looking out for two parallel swings in the price which have in size (length and time)
If point D comes together with the Fibonacci level somewhere at the middle of 127.2% and 161.8% and the price begins in a downtrend candle, an entry into the market. This means that the market is entered when the price during CD movement retracts to 127.2% extention of the BC movement.
Exit Criteria for buy and sell with AB = CD Pattern pattern
- Set stop loss 2% above or below point of entry which is the point D in the area marked. In the same vain, set take profit with a profit ratio of 1 to 1 should be 2% away from the point of entry
Practice (Only Use your own images)
Make 2 entries (Up and Down) on any cryptocurrency pair using the AB = CD pattern confirming it with Fibonacci.
I am going to use screenshots of chats to explain how to make entries using the AB=CD harmonic pattern as I would not be able to do neither a demo trade or live one this time.
For the sell entry, the screenshot can also be used to explain when to sell. If a trader miscalculated and the market went down when he thought it was still going up, he or she can use the screenshot to stop loss.
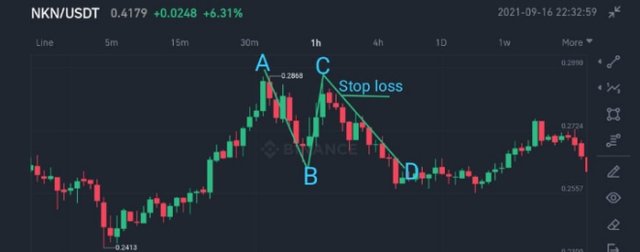
Screenshot from binance
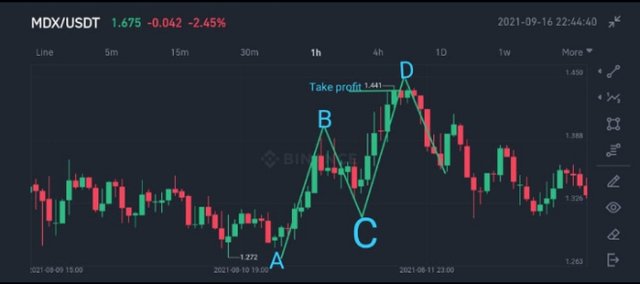
Screenshot from binance
This screenshot can be used by day trader. Buy entry can be made at two points. Somewhere above point A and point C. Also take profit can be taken below point B and point D.
CONCLUSION
AB=CD trading strategy is one of the different harmonic patterns that can be used to make bụy and sell trading decisions. It is the most simplest one among the harmonic pattern. For one to understand the others better, one has to understand the AB=CD pattern first.
AB=CD pattern is used by long term traders or intra day traders as the patterns may take a long time to form. It is reliable but it gives better results buy confirming its signals with Fibonacci retracement levels.
.jpeg)
@lenonmc21 I have done the corrections as informed. Thank you professor.
Downvoting a post can decrease pending rewards and make it less visible. Common reasons:
Submit
Greetings @afunkycares
I think you misunderstood, you must place below the grade that I place you, all the content of the original post that expired. It was not only to place the rating, but below it, all the content of the original post. Also place the correct tags please, according to the rules of each task. Remember that the correct tag is #lenonmc21-s4week2.
Please place the content of the original post. In order to move on to the curators of the post.
Steemit Cryptography Professor.
@lenonmc21
Downvoting a post can decrease pending rewards and make it less visible. Common reasons:
Submit
Noted professor. Thank you.
Downvoting a post can decrease pending rewards and make it less visible. Common reasons:
Submit
I have corrected that. Thank you.
Downvoting a post can decrease pending rewards and make it less visible. Common reasons:
Submit