Hello everyone. I welcome you all in the last week of season 5. This week, professor @reddileep has taught us " Technical Analysis Using Fractals ". Let's start the homework task for this week.
.png)
Question 1- Define Fractals in your own words
The crypto world is very versatile because of which the market can move in unexpected direction any time. The traders analyze the market first before entering into the market to reduce the risk factors. There are a lot of the patterns (like head and shoulder pattern) and the indicators( like RSI, William %R, MACD etc) to analyze the market.
There are a lot of the candlestick patterns and chart patterns. The chart patterns are those which are formed by a lot of the candles. The candlestick pattern are those which are formed only by a few number of candles. Today we are going to learn about a Fractals pattern
There are some traders in the market who believe that the price patterns are repeat in the market. What happened in past will happen again in future. They use the past data and the past market price pattern to predict the future price pattern.
The Fractals helps alot to identify the future price pattern on the base of the past data. They are the reversal patterns which help to identify the upcoming trend on the base of the previous data. The fractals pattern are the 5 candles price pattern. There should be atleast 5 candles to form the fractal. These five bars are candles help to identify the fractal accurately. If the number of the bar is less than the five, it is not considered as fractal because its accuracy and efficiency is very low.
The fractals help to perform the trades very successfully. They help to identify the future market reversal and thus the traders can take the trading decisions accordingly. But here one thing to be notice is that the fractals cannot be traded on their own but we need to use the fractals with some other indicators in order to get the trading signals.
There are a lot of the fractal based indicators which are growing and getting popularity very rapidly in the crypto market. There are two type of the trend reversal in the fractal identification;
- Bearish Trend
- Bullish Trend
The fractals are identified by focusing on the five consistent candles. When the middle candle is formed as the higher high and the lower highs candles are formed on the both side, it is said be the the bearish reversal.
When the middle candle form the lower low and the higher lows are formed on the both side of the middle candle, it is said be the bullish reversal.
- Trading on the base of bearish Fractals
The bearish fractal is formed when the middle candle form the lower low and the candles on the both sides form the high low. This indicate that soon the bullish trend will be reversed into the bearish trend. This produced the signals which indicate that there will be the Bullish trend has been end in market.
.png)
This is the best to exit from the market. The traders find it a good spot to sell the coin to earn the profit and to safe from lose because price is expected to decline in future.
- Trading on the base of Bullish Fractal
The bullish fractal is formed when the middle candle form the higher high and the candles on the both sides form the lower high. This indicate that soon the bearish rend will be reversed into the bullish trend. This produce the signals which indicate that there will be the Bullish trend in market in the near future.
.png)
This is the best to enter into the market. The traders find it a good spot to buy the coin to earn the profit.
Question 2- Explain major rules for identifying fractals
In order to get the benefit from the fractal, it is first of all necessary to find out the fractal on the chart. There are actually a lot of the fractals on a chart at the different time period but it is not easy to identify those fractal patterns. There are some rules which we need to keep in our consideration to spot the fractals in order to get benefit from them.
- There are two type of the fractals which are the bearish fractals and the bullish fractals. To spot the fractals of both types, there should be five candles or bars. The five bars show that the fractal is accurate. The candles less than the five indicate the less accuracy and t is not consider a fractal. If the number increase more than five, it will also not be a fractal.
- For the bearish fractal, there should be the higher high at the middle and the lower high on the both side of the middle candle.
- When we see the middle candle form the lower low and the candles on the both side form the lower high, then we can say that the bearish fractal is form here.
- The price is expected to decline after the bearish fractal. This is good spot to exit from the market. The bearish fractal look like the below.
.png)
.png)
- For the bullish fractal, there should be the lower low at the middle and the high low on the both side of the middle candle.
- When we see the middle candle form the lower low and the candles on the both side form the lower high, then we can say that the bullish fractal is form here.
- The price is expected to rise after the bullish fractal. This is good spot to enter into the market. The bullish fractal look like the below.
.png)
.png)
Question 3- What are the different Indicators that we can use for identifying Fractals easily?
As i said earlier, Identifying the fractals is not easy task. We should be very focused and a good observer in order to spot the fractal. There are some fractal based indicators which we can use for identifying the fractal easily, The William's Fractal indicator, Fractal support and resistance, fractal breakout are some among those indicator which helps the traders to find out the fractals.
The William's Fractals
This fractal is named after its inventor, "Bill Williams". This is very useful indicator which help to identifying the fractals on the chart. This is very popular fractal based indicator and the traders from all across the world use this indicator.
This indicator is very efficient and produce very accurate results. In short time frame, its accuracy get enhanced and we get only few signals. But in short time frames, it produced a lot of signals and thus its accuracy get disturbed in short time period.
This indicate thus consider more profitable to use in long time frames. This indicator use the previous fractals with the current fractals and generate the breakout signals. When the price start moving above the previous upward fractal, it is considered the bullish breakout . The market is expected to be in uptrend after this breakout.
When the price start moving below the the previous downward fractal, it is considered the bearish breakout . The market is expected to be in downtrend after this breakout.
This is very easy to perceive and understand. This indicator is shown in the form of the red and green arrows.
The red arrows are formed at the bottom side of the price chart. The red arrows represent the bullish fractals and indicate that the price will move upward in near future. The red arrows shows that the price will rise up and there will be the bullish trend in future.
.png)
The green arrows are formed at the upper side of the price chart. The green arrows represent the bearish fractals and indicate that the price will move downward in near future. The green arrows shows that the price will decline and there will be the bearish trend in future.
Fractal Support and Resistance
This is another very easy and simple indicator. Many traders in the market use this indicator to bring the clarity on the chart. As we know that The support level is the level where the decreasing price stop falling more and push upward. The resistance level is define as the level at which the increasing price stop rising more and push back downward.
The same rules are applied in the fractal support and resistance indicator. This indicator is represented as the red and the green line. The red line indicate the support level. This is the level where the falling price is usually expected to stop falling more and push in upward direction.
The resistance level is represented as the green line. The green line is the level where the rising price usually is expected stop to rise more and push downward.
In the fractal breakout strategy., when the price of the asset break the resistance level while moving upward, it is expected that the price will rise more. This is best point for the traders to enter into the market.
When the price of the asset break the support level while moving downward, it is expected that the price will decline more. This is best point for the traders to exit from the market.
.png)
Question 4- Graphically explore Fractals through charts. (Screenshots required)
We use this phenomenon in the fractals. Here the past data is use to determine the next moves in the market. The fractals helps a lot to get the trend reversal points and identify the market direction. We use the signals produced by the fractals to enter or exit from the market at the appropriate time. But identifying the fractals is not an easy task. For this, we can use the Bar pattern on the tradingview.com
We know that the market repeat its behavior time to time. What happened in past is expected to happen again in future.
Here we can copy past the previous graph on the moving chart and can determine what will be the next market behavior on the base of the previous data. Let discuss it in detail.
First of all open the chart section of tradingview and then click on the Prediction and measurable tool icon.
A drop down list will be appear. Choose the Bar patterns from there.
.png)
Then draw the lines from the left to right to select any chart section on the past chart pattern.
Then we will get the below moveable chart
.png)
We can copy paste this pattern to any point on the chart to predict where the market will move next. We have copy pasted this moveable chart at another point. We can see that there is similarity on the both cases. So we can predict the next market behavior on the base of previous data.
.png)
We can identify what will be the next trend reversal on the base of the past data. SO we can analyze the market and identify the trend reversal easily. This produce the accurate result but in some cases, we may get the false results. So we should be very careful while using these tools.
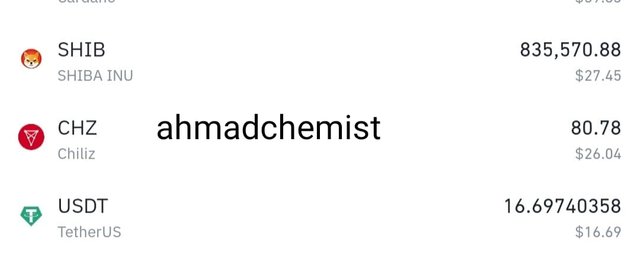
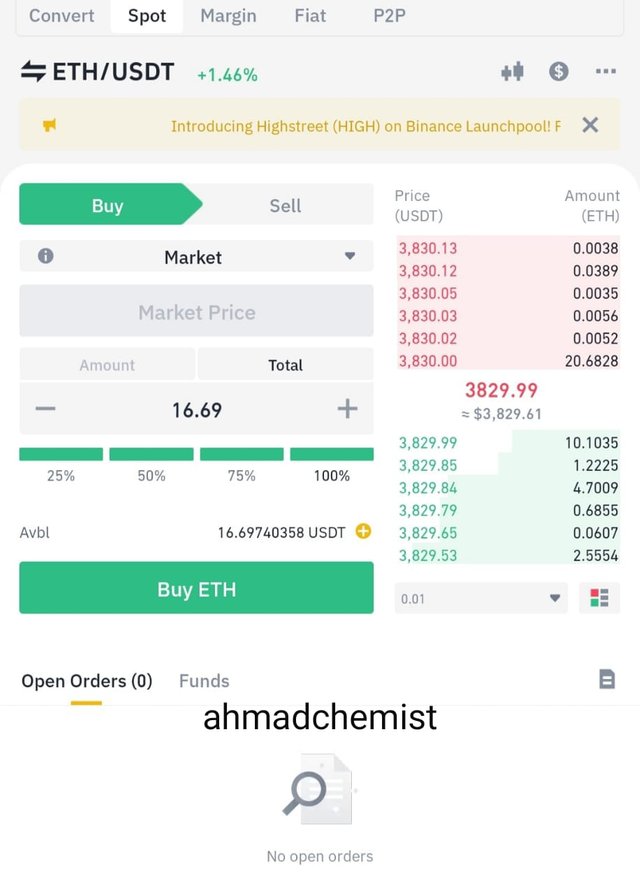
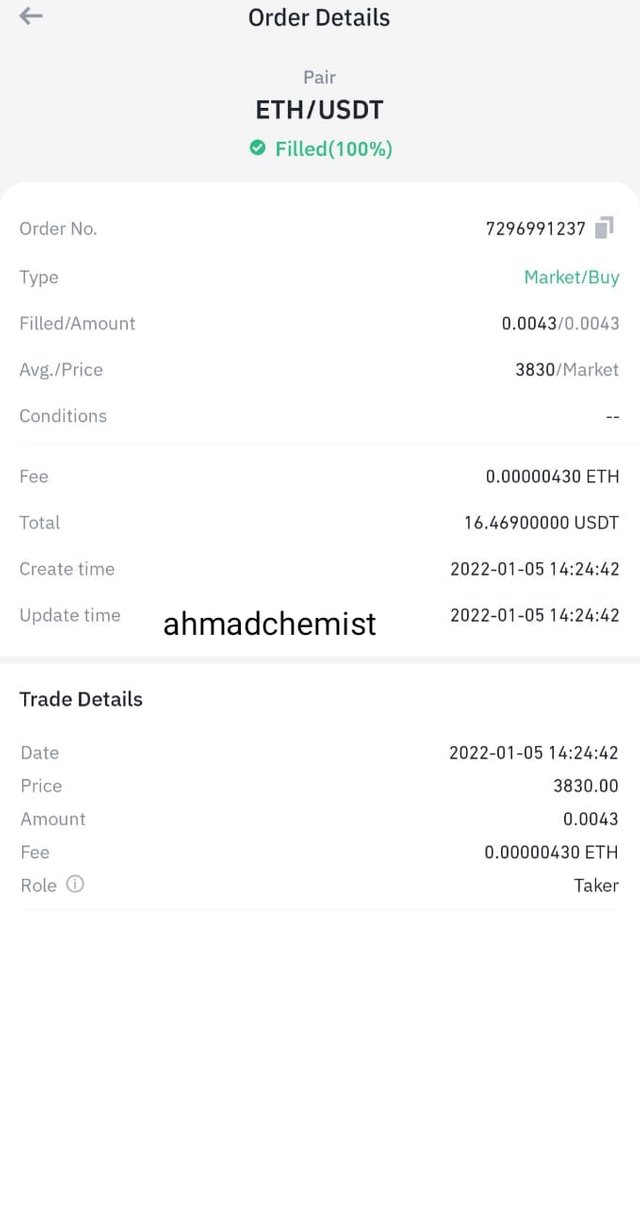
Practical - Do a better Technical Analysis identifying Fractals and make a real purchase of a coin at a suitable entry point. Then sell that purchased coin before the next resistance line. Here you can use any other suitable indicator to find the correct entry point in addition to the fractal. (Usually, You should demonstrate all the relevant details including entry point, exit point, resistance lines, support lines or any other trading patter
I have selected the ETH/USDT to answer this question. I am going to perform the demo trade using the tradingview.com.
I first added the William's fractal and then EMA-20 and EMA-50
When the EMA-20 cross the EMA-50 and move upward, it indicate that the price is rising upward. So we should enter into the market. When the EMA_20 cross the EMA-50 and move below, it show that the price is declining and there is downtrend in the market. So traders should exit from the market.
Next we have added the William's fractal. This indicator is shown in the form of the red and green arrows.
The red arrows are formed at the bottom side of the price chart. The red arrows give the buy signals. The red arrows represent the bullish fractals and indicate that the price will move upward in near future. The red arrows shows that the price will rise up and there will be the bullish trend in future.
The green arrows are formed at the upper side of the price chart. The green arrow give the sell signals. The green arrows represent the bearish fractals and indicate that the price will move downward in near future. The green arrows shows that the price will decline and there will be the bearish trend in future.
.png)
I changed the color of EMA-50 as red. I didn't change the default setting of fractal. I found the sell entry.
I can see that the EMA_20 is below the EMA-50. There is green arrow which give the sell signals.
I set the stop lose or support level at the previous support level. As we know that price repeat its action on the chart. I set the support level there because the price of the asset may push back when it reached to that level and may decline more. So i set the support level at the previous support level.
My Trade History

.jpeg)


Conclusion
The fractal is very useful and helpful technical indicator which is use in the crypto market to get the best entry spots, exit spots, trend reversal and many other signals.
The fractals are identified by focusing on the five consistent candles. When the middle candle is formed as the higher high and the lower highs candles are formed on the both side, it is said be the the bearish reversal.
When the middle candle form the lower low and the higher lows are formed on the both side of the middle candle, it is said be the bullish reversal.
We can use this indicator in trending market to trade successfully. But some time, this indicator produce the wrong or false signals. So the best approach is to use the Fractal indicator combining with some other indicator.
Regard
@ahmadchemist