.png)
Explain in your own words what you mean by Fibonacci retracement. Show an example with screenshot.
So this sequence start with zero and one it made by adding the previous two numbers together to get the next number in the sequence. As 0+1=1, 1+1=2 then 2+1=3 ,3+2=5 and so on... It was first described in india many years ago but was made more popular in the west by a chap called Leonard Fibonacci bonacci . The name Fibonacci comes from the shortening of philius bonacci meaning son of bonacci. This sequence of numbers in seen a lot in the nature.
This sequence present in number of petals on the flowers,to the number of spirals on a pine cone , and even the shape of the ear when plotted as a curve. Fibonacci ratio can be determined by dividing number from the sequence by other number from the sequence are thought to have significance when plotted on a price chart. Treader uses these ratio to find the strong move in the market.
After the division of these numbers from the previous one or by skipping one and then devide with that number and so moves on to previous numbers. The rato that we obtained are 0.236, 0.382, 0.50, 0.618, 0.786. All these numbers are called golden ratio. Fibonacci sequence are just the number or the ratio and retracement is the reversal of the trend from previous way.
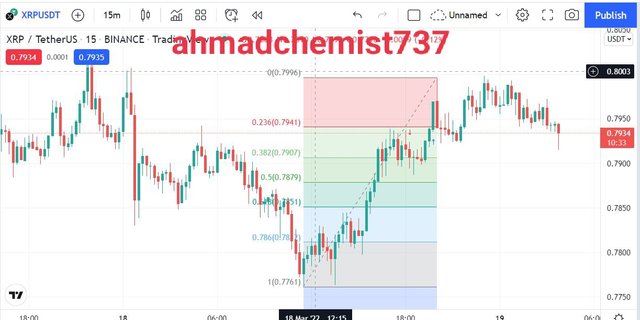
In the above screenshot we can see that as we apply Fibonacci retracement on chart ,there are different ratio and price along with that ratio. If market is moving up than it will go up to next golden ratio where we should put our take profit. Supposed market is moving up from 0.236 level and we enter the trade at this point so we should keep our profit at 0.38 level. Market may also go up from here but we are not sure about it.
Explain in your own words what you mean by Fibonacci extension. Show an example with screenshot.
Fibonacci extension tool is used to look for the points on the chart where the trend is likely to go up even after the retracement level or it will ends up on this point and will start its reversal. In order to determine the Fibonacci extension tool we need to have knowledge about three thing in the chart which are start of the impulse, end of the impulse and end of retracement level.
In Fibonacci extension tool each point is considered a profitable point so we can get huge profit and also good exit points from the market by knowing the Fibonacci extension tool. Fibonacci extension tool point are also consider as the support and resistance zone for trader.
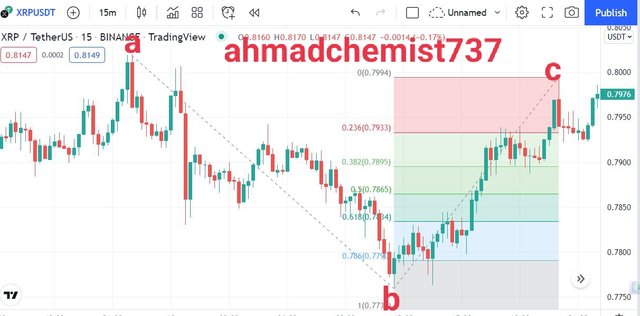
Here in above screenshot you can see that thwre are 3 points that are mentioned. From this point we can also determine to what extent the trend will go further in bearish way. So in short the combination of Fibonacci retracement tool and extension tool can be used to determine the market trends as well as to gain profit from the crypto currency market.
Perform the calculation of the Fibonacci retracement, for the levels of: 0.618 and 0.236. Pick a crypto pair of your choice. Show screenshot and explain the calculation you made.
After discussing about the Fibonacci retracement tool now we will calculate of Fibonacci retracement for the level 0.618 and 0.236. As we know that in order to calculate the Fibonacci retracement tool we only need two points one is low from where retracement start and the other where Fibonacci retracement stop. There are different golden ratio that are discussed above including
- % Fibonacci Retracement 1= 23.6%
- % Fibonacci retracement 2= 38.2%
- % Fibonacci retracement 3= 50%
- % Fibonacci retracement 4= 61.8%
- % Fibonacci retracement 5= 78.6%
So we will do calculation for 0.236 value

RX= X+ [(1-%Retracement/100) * (Y-X)]
- X= from where Fibonacci retracement start= 0.7761
- Y= from where Fibonacci retracement stop= 0.7996
RX= 0.7761+[(1- 23.6/100) * (0.7996 - 0.7761)]
RX= 0.7761+ ( 0.764) *(0.0235)
RX= 0.7761+ 0.017954
RX= 0.7941
The value that we obtained is 0.7941 and this can also confirm from the chart where the value at Fibonacci retracement.236 is also .7941.
Calculation for 0.618 value

R2= X + [(1- %retracement/100) * (Y-X)
R2= 0.7761+ [(1- 61.8/100) *(0.7996- 0.7761)
R2= 0.7761+ ( 0.382) *( 0.0235)
R2= 0.7761+ 0.008977
R2= 0.7851
The price value at 0.618 Fibonacci retracement ratio is calculated as 0.7851 and it can be matched with the value on the price chart which confirm that calculation is right.
On a Live account, trade using the Fibonacci retracement, screenshots are required.
In this question according to the requirements I will do real trade by using binnance exchange and I will do technical analysis on trading view.
Here is the screenshot you can see that candle is going down and I applied the Fibonacci retracement tool on the chart. As you can see that I made my entry.
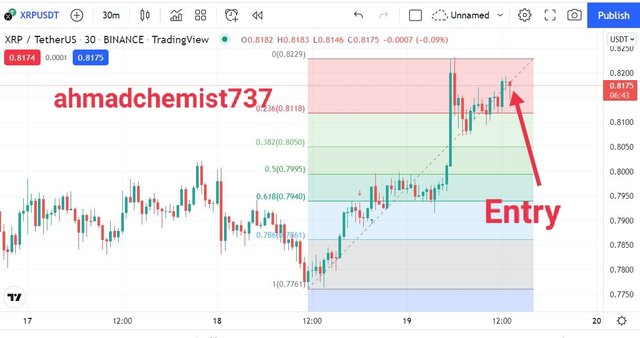
I made my trade my using XRP/usdt pair. As market is going down so I will do sell short trade and when market is going down I will buy that XRP/usdt pair and will take my profit.
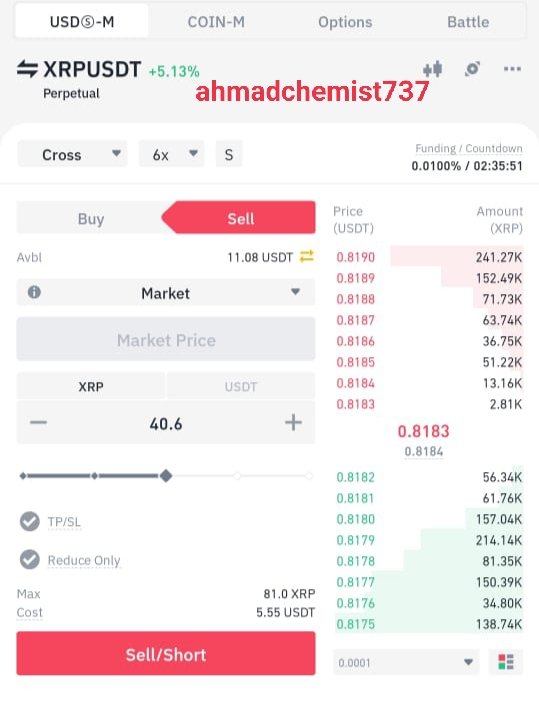
Here is the proof of my trade . As you can see that I do future trading on binnance and also set 6x leverage on binnance.
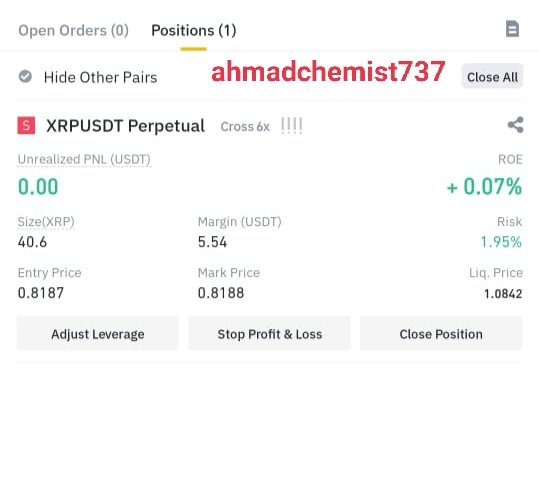
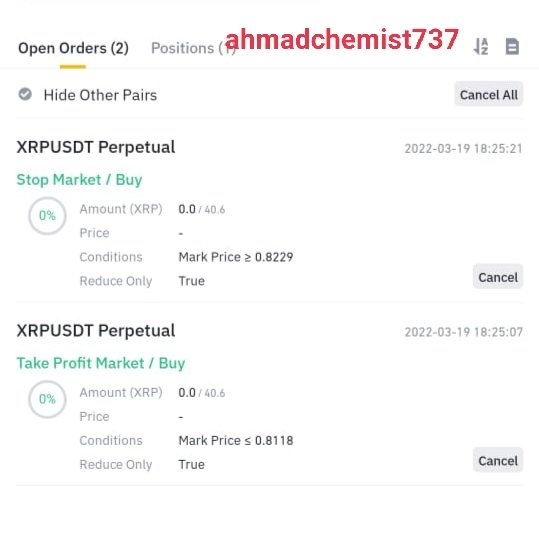
Here you can see that I set my stop loss and take profit in above and below the next golden ratio. So I will take my profit at 0.8118 and also set stop loss at 0.8229 as shown in below screenshot.
On a Demo account, make a trade operation using the Fibonacci extension. Screenshots are required.
According to the question requirements I opened my demo trade account of trading view and after that I applied the Fibonacci extension tool on the price chart.
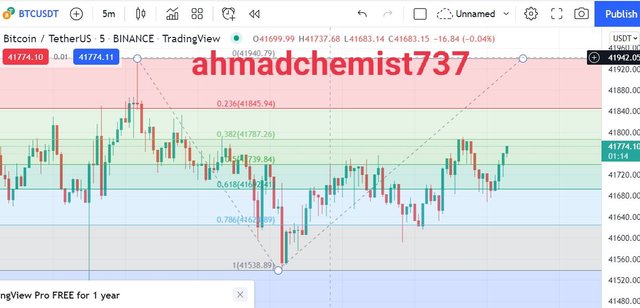
As you can see that market is moving in upward direction and it almost reaches to the golden ratio of 0.382 so I take a trade of buy long at that point. As you can see below. I also adjust my area of taking profit and stop loss in the zone as you can see in below screenshot. I put my profit slightly above the next golden ratio and also stop loss. As it is a demo trade so I can do some experiment to understand the trend weather it goes above from coming golden ratio or not. At that time while I am writing this assignment My trade is in profit of 💲24 dollar as price reaches to 41814 dollar which is above from that golden ratio.

Conclusion
In this lecture an important topic about the Fibonacci retracement and extension tool is discussed. Fibonacci sequence can be used to enter and exit from the market. After that I calculate the Fibonacci retracement at different golden ratio of 0.618 and also 0.238. These Fibonacci tools are even present in our nature. After that I do my trade by using Fibonacci retracement tool to do real trade on binnance and also do a demo trade on trading view demo account where I do trade with BTC/USDT pair