Hello people. A warm welcome to another week. The professor
@reddileep taught us the "trading strategy using the VuManChu Cipher B". This is my homework post.
.png)
Question 1. Define VuManChu Cipher B Indicator in your own words.
The trader analyze the market first before placing the buy or sell order. The analysis of the crypto market is most significant in trading world. The coins keep changing their prices because of which the market move up or downward. When the buyers are in control, the market rise upward. When the sellers have control in market, the market fall down. So we have to analyze the market before taking any trading decision. There are different tools and strategies which are used in the market by the traders to analyze the market. The VuManChu Cipher B is also a technical based indicator which is use to analyze the market. This is use in technical analysis of market and produce the signals which are very useful for the traders to trade in profit.
This indicator is a combination of multiple indicators which are comprised together and produce the trading signals for the traders. The traders buy and sell the coins using that signals and earn high profit. A trading strategy is created which generate more authentic and accurate output.
This indicator is use to predict the market movement of an asset and thus help the investors to decide whether to enter into the market or exit from the market. This indicator has been created from the Market Cipher B indicator and available for free to use on Tradingview.com. The traders can access this indicator using the library "VuManChu" and analyze the market. This indicator is considered more accurate way to analyze the market as there is a combination of the indicators in the VuManChu like RSI, Money Flow, Market Volume, etc.
These indicators are comprised together and then create a more successful trading strategy for the traders to trade with high profit. This indicator is use to analyze the multiple from multiple aspects like it confirm the market trend using the wave trends. The wave trends are the lines which are light blue and dark blue in color.
The intersection of these two lines indicate the trend reversal. When these two line cross each other, there is a dot representing the downtrend or uptrend of market. If there is red dot at the cross section of the lines, it indicate that there is downtrend. The price is going to fall. But if there is green dot at the intersection of the lines, it indicate that there is bullish trend. The price will rise up.
The money flow index is use to indicate the inflow and outflow of the capital of the traded assets. This indicator confirm the market trend, helps the traders to get more accurate entry and exit spots, predict the future, etc. This indicator also relate with the demand and supply rule where when the buying pressure increase, the demand also increase which pull the market upward. When the selling pressure increase, the supply decrease which push the market downward. The direction of the price is use to determine the market trend.
Question 2. How to customize the VuManChu Cipher B Indicator according to our requirements? (Screenshots required)
To add this indicator, go to the platform where this indicator is available. I will use the tradingview.com because this allow the users to use the VuManChu Cipher B indicator for free.
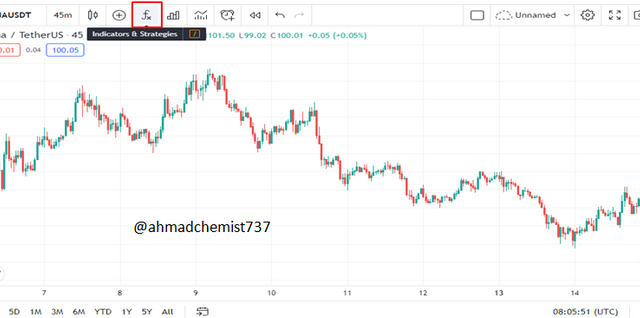
So Go to the Tradingview.com and open the chart section.
.png)
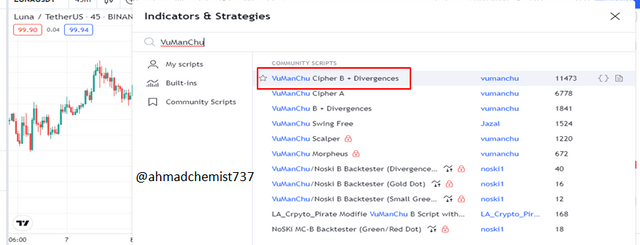
Now click on the Indicator icon and when it open, write the name of the VuManChu indicator on the search bar.
.png)
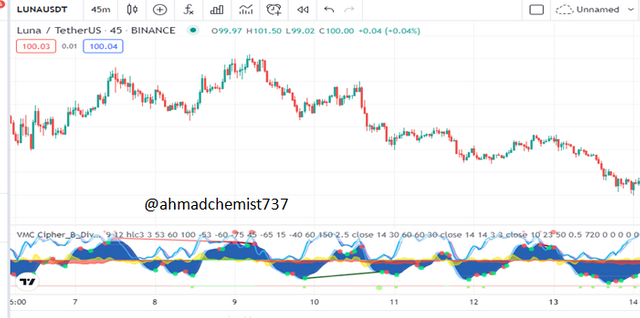
When you will click on the VuManChu which i marked below, this indicator will be added on your chart.
.png)
VuManChu Cipher B Indicator Settings
To change the setting of the indicator, click on the indicator on the top. The setting icon will be shown. Click on the setting Icon.
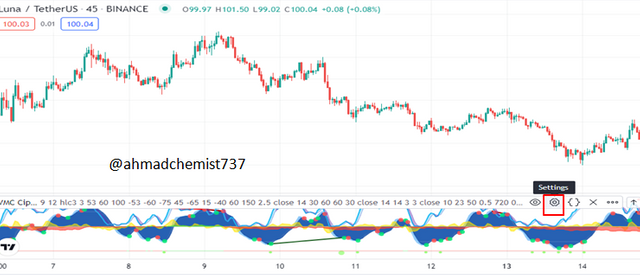.png)
1- Input Tab
From Input Tab, there are some bxes which are not relevant to our trading strategy. SO we need to unmark all those boxes. For this, first scroll down the Input Tab, and unmark the Show "WT Regular Divergences and Show 2nd WT Regular Divergences"
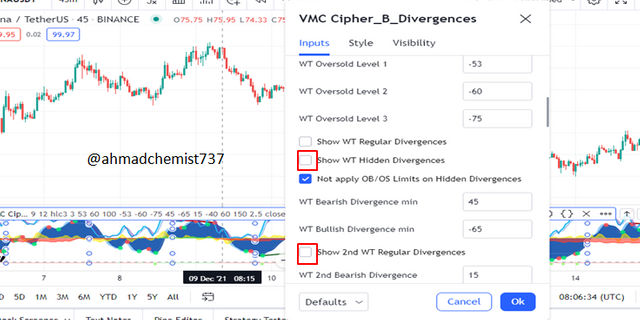.png)
Then again do the scrolling. Another box with name "Show Stochastic RSI" will be shown. Unmarked this too because it is also irrelevant for out trading strategy
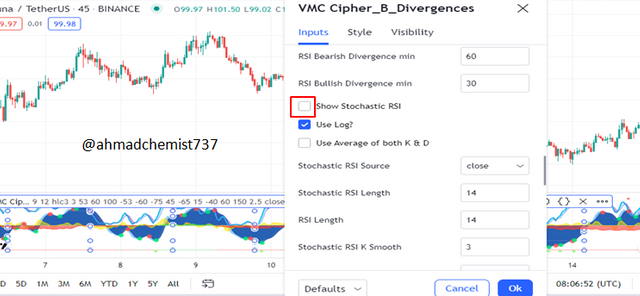.png)
2- Style Tab
Next is the style Tab. From this tab, we need to unmark some option again because they are also irrelevant to our trading strategy. For this, scroll down the tab. Unmarked the box with name "VWAP and MFI Bar Colors indicator".
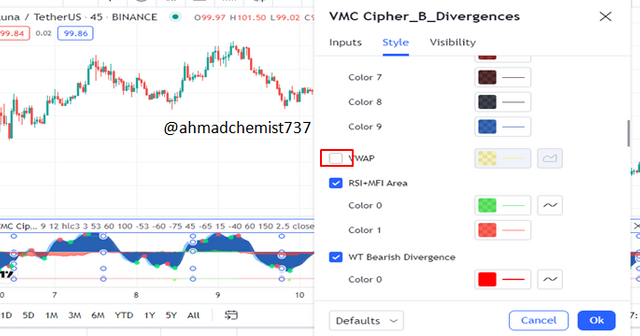.png)
.png)
When you have done this, your chart will be look like this. This is more clear view of the indicator.
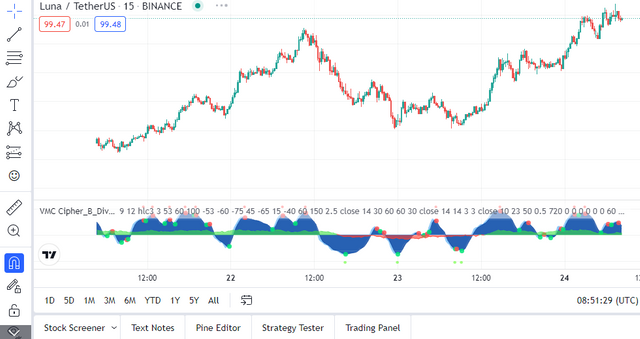.png)
Question 3. Explain the appearance of the VuManChu Cipher B Indicator through screenshots. (You should Highlight each important part of this indicator by explaining their purpose)
VuManChu Cipher B indicator Appearance
The VumanChu indicator is a combination of the multiple indicators which are added ogether on the chart to create a trading strategy. This indicator help to trade in more excellent way because there are low chance of the false signals. There are basic two parts of this indicators which make up the VuManChu Cipher B indicator.
Wave trend Indicator
The Wave rend Indicator is shown on the VuManChu Cipher B indicator in form of the blue color. This is filled with blue color and consist of two lines whose color is light blue and dark blue. When the light and dark blue line cross each other, a dot is formed there which indicate the movement of the coin. The color of the dot is either red or green. When the color of the dot is red, it indicate that there is bearish trend. The green dot indicate the bullish trend.
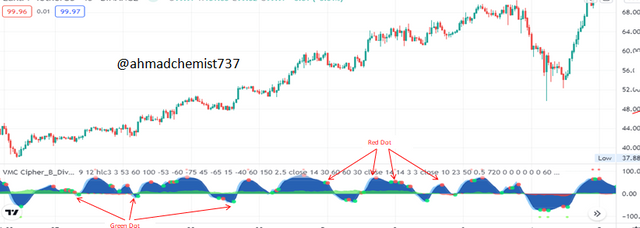.png)
Money Flow Indicator
is also very important as it is use to identify the money volume which can either be inflow or out flow. It is represented with two colors which are red and green. There are the clouds of these colors on the VuManChu cipher B indicator which indicate whether the it is inflow of capital of traded assets or outflow. When the color of cloud is green, it indicate the inflow of the capital of traded asset. When the color of the cloud is red, it indicate the out flow of the capital of traded asset
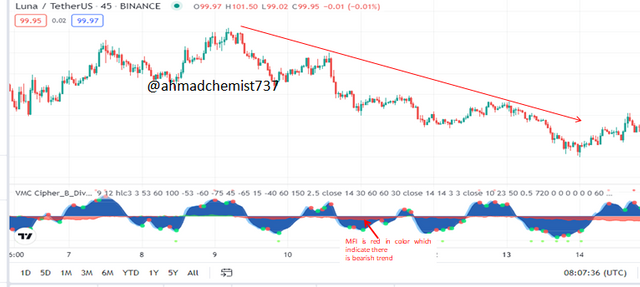.png)
.png)
Question 4. Demonstrate your preparation for the Trading Strategy by combining other indicators. (Instead of showing the addition of indicators to the chart, you should explain the purpose of each indicator for this trading strategy.)
VuManChu Cipher B indicator And EMA
The VuManChu Cipher B indicator is using world wide by the traders to analyze the market. This indicator has been combined with the EMA which will generate the more accurate results. This indicator is combined with EMA to filter out the false signals which misguide the traders and by using which, the traders face the lose. It is combined with EMA-55 and EMA-200
To add the EMA-55 and EMA-200. we again will use the tradingview.com platform and will click on the indicator icon.
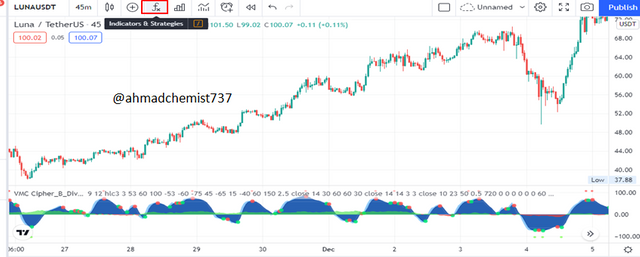.png)
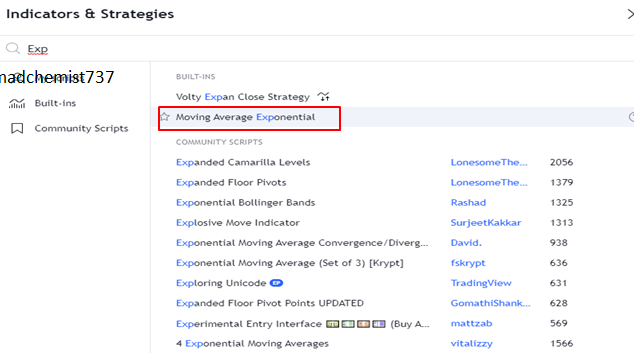
A search tab will be open where we will search for EMA and will add the 2 EMAs.
.png)
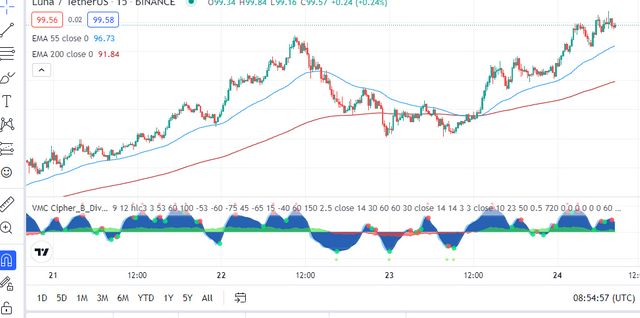
Then to set the length, click on the indicator on the top. The setting icon will be shown. Click on it and set the length for 55 and 200. Now the Chart will look like below.
.png)
Now this combination will be more accurate and more authentic signals will be produced. This help to filter out the false signals. The traders use this combination to enter into the market and to exit from the market at more appropriate spots. The traders get the best entry and exit spots and then trade using those signals.
When the moving average 200 cross over the EMA-55, it identify that there is downtrend in the market. This indicate that there is high buying pressure and low selling pressure. It generate the Sell signals. When the EMA-55 cross over the EMA-200, it identify that there is uptrend in the market. It generate the Buy signals. This indicate that there is high selling pressure and low buying pressure.
Question 5. Graphically explain how to use VuManChu Cipher B Indicator for Successful Trading. (Screenshots required)
Bullish Scenario
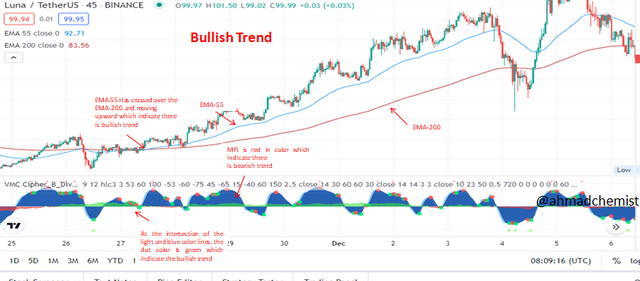
When the EMA-55 crossover the EMA_200 and move above, it indicate that there is high buying pressure and high demand of the asset. This will pull the market upward and price will rise. This indicate that there is bullish trend. This produce the buy signals. This is best spot to enter into the market. But to enter into the market, we need to check the buy signals from the VumanChu indicator for this, we need to check the following conditions.
First of all we will check the money flow indicator. This indicator will help to get the more appropriate buy and exit signals. This indicator is there in form of the red and green clouds. The green cloud indicate that there is bullish trend. The red cloud indicate that there is bearish trend. For bullish scenario, the cloud should be green. This indicate the inflow of the capital of the traded assets. The color of the MFI should be green. This happen when the demand is high and supply is low.
Then we will check the output of the trend wave. This is shown in the form of the blue filled lines. The color of these lines is either light blue or dark blue. When the trend wave lines, dark and light blue lines, cross over, there should be a green dot. The green dot indicate the high buying pressure and low selling pressure. For the bullish trend, when the lines cross each other, there should be a green color dot.
.png)
The EMA-200 has been crossed the EMA-55 and moving upward. The crossover of the light and dark blue lines is presented the red dot. And there is the MFI in blue color cloud. All these things collectively are indicating that there is bearish trend in market.
Bearish Scenario
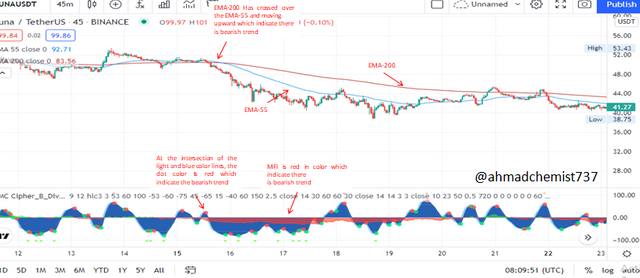
When the EMA-200 crossover the EMA_55 and move above, it indicate that there is bearish trend. This indicate high selling pressure with high supply. The demand is low. This is best spot to exit from the market. But to exit from the market, we need to check the sell signals from the VumanChu indicator for this, we need to check the following conditions.
First is Money Flow Indicator. The money flow indicator is shown in form of cloud but the color of the cloud has to ben red in bearish trend. This indicate the outflow of the capital of the traded assets. The color of the MFI should be red. This happen when the supply is high and demand is low.
The next condition to check is trend wave. When the trend wave lines, dark and light blue lines, cross over, there should be a red dot. The red dot indicate the high selling pressure and low buying pressure. For the bearish trend, when the lines cross each other, there should be a red color dot.
.png)
The EMA-200 has been crossed the EMA-55 and moving upward. The crossover of the light and dark blue lines is presented the red dot. And there is the MFI in blue color cloud. All these things collectively are indicating that there is bearish trend in market.
Question 6. Using the knowledge gained from previous lessons, do a better Technical Analysis combining this trading Strategy and make a real buy or sell order in a verified exchange. (You should demonstrate all the relevant details including entry point, exit point, resistance lines, support lines or any other trading pattern)
Sell LUNA/USDT
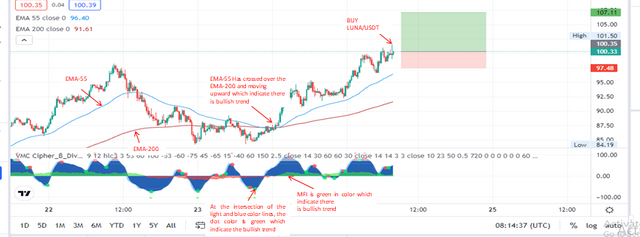
I visit the tradingview.com and then open chart of LUNA/USDT. The below is the chart where the uptrend is clear. The market is rising upward. The demand is increasing and supply is decreasing
.png)
First I will follow the strategy and will check whether the EMA-55 has cross over the EMA-200. The EMA-55 has crossed the EMA-200 and is moving upward. This mean that there is bullish trend. Price is rising. The buying pressure is high and buyers are in control.
Then I checked the MFI to see whether the money was flowing in or out of the traded capital. The money flow indicator is shown in form of cloud but the color of the cloud has to ben green in bullish trend. This indicate the inflow of the capital of the traded assets. The color of the MFI should be green. This happen when the demand is high and supply is low. The color is green, its mean that MFI has confirmed the uptrend.
The next condition to check is trend wave. When the trend wave lines, dark and light blue lines, cross over, there should be a green dot. The green dot indicate the high buying pressure and low selling pressure. For the bullish trend, when the lines cross each other, there should be a green color dot. We can see that at the crossover of the lines, there is a green dot which show that there is bullish trend in market. All the conditions have fulfilled. Now i Will place my Buy Order. I will purchase the ETH/USDT now.
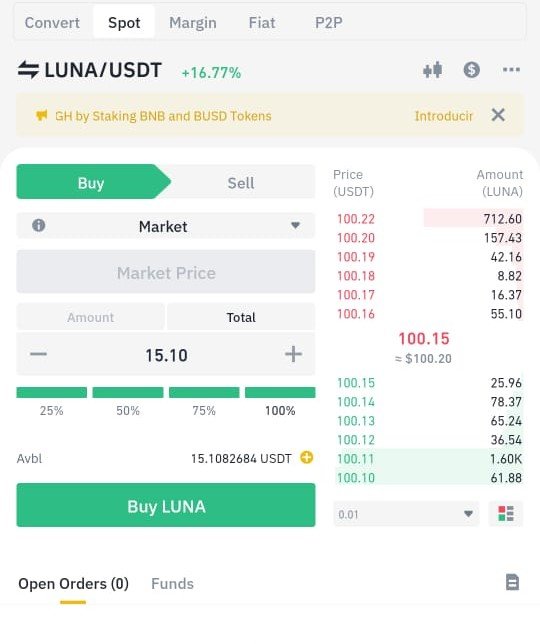
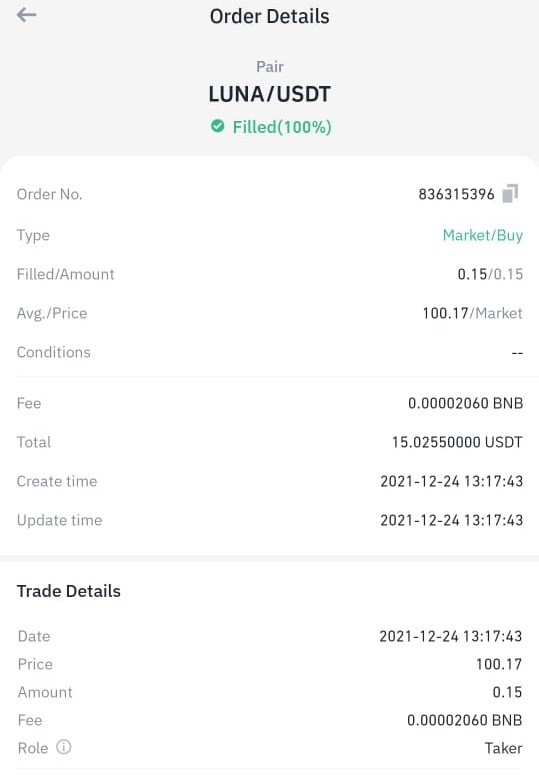
I set the stop loss at 97$, take profit at 107$ and Then the buy order was executed and i bough the LUNA/USDT. The below is the order detail
Conclusion
The VuManChu is an indicator in crypto world which comprise multiple indicators. This is combination of the RSI, Money flow , Market Volume, Market Momentum, etc. This indicator is available for free to use via the Tradingview.com. This indicator has been created from the Market Cipher B indicator and available for free to use on Tradingview.com. The traders can access this indicator using the library "VuManChu" and analyze the market. This indicator is considered more accurate way to analyze the market as there is a combination of the indicators in the VuManChu like RSI, Money Flow, Market Volume, etc. All these indicator comprised together and create an efficient trading strategy to earn more profit.
Cc:
@reddileep
.png)
.png)
.png)
.png)
.png)
.png)
.png)
.png)
.png)
.png)
.png)
.png)
.png)
.png)
.png)
.png)
.png)
.png)
.png)

