Hi Steemians, It's me Ahtisham Ghumman. I hope you are all good and doing great. This is my homework task for respected professor @lenonmc21..png)
WHAT IS TREND?
In the world
of crypto trend word use for prices to move in a specific direction. By
following trend we can get profit. In the world of crypto, Whales can change
trends if they want because they invest very heavy capital in currencies so they
have the power to change the trend.
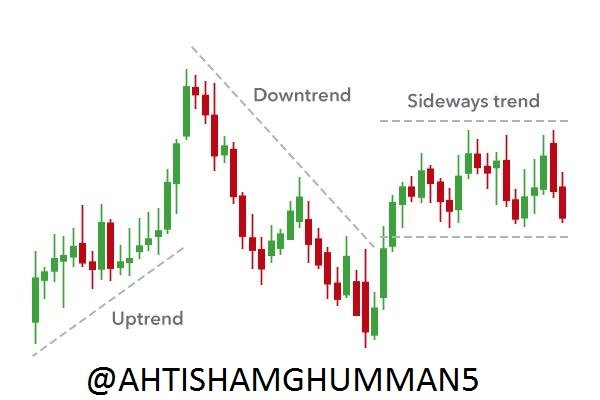
Trend divided into two trends Bullish (BULL)
Trend and Bearish Trend. The Bullish trend means the demand is more than supply and a
bearish trend means supply is more than demand. So bullish means when the price is
going high and bearish means when the price of any currency goes down.
WHAT IS TREND LINES?
Trend
lines are the simple and widely used lines with technical analysis while buying
or selling any currency or an asset. Trend lines are very easy to understand.
some trending tools are available on some websites are very helpful to
identify resistance levels on charts.
ROLE OF TREND AND TREND LINES:
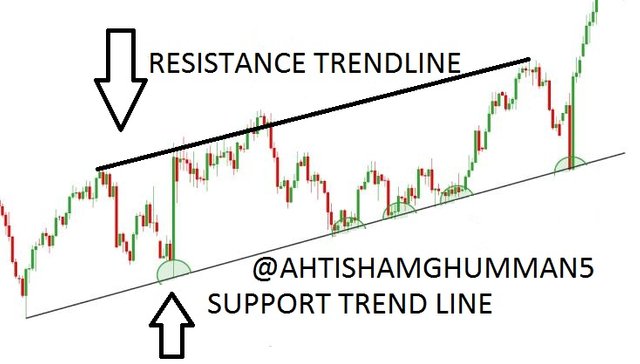
Trend lines are diagonal lines. These lines highlight the price of an asset. These trend lines help the traders and give them a general sense to identify the market trend. When the price rises the trend lines rise and when the price goes downtrend lines goes down.
By understanding these lines traders can predict the next moment of the market and if they want they can get very good profit.
2: HOW TO DRAW A BULL TREND LINE AND A BEAR TREND LINE?
UPTREND LINES
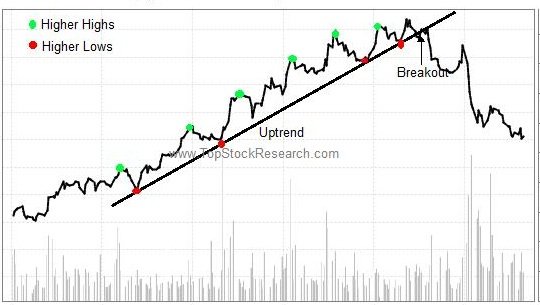
An uptrend line has a positive slope by connecting two or more low points. The second lower must be high than the first lower and the third one must be higher than the second one. This is a Bullish trend. These uptrend lines indicates that demand is less than supply.
DOWN TREND LINES
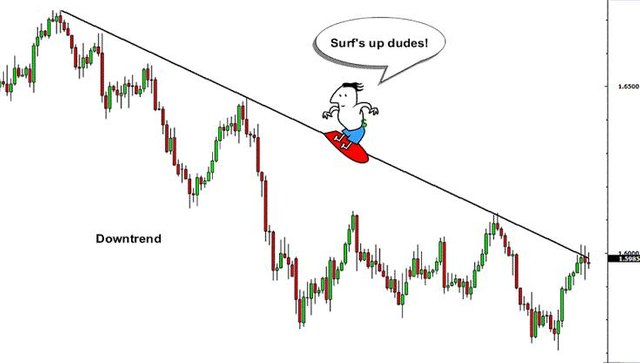
A downtrend has a negative slope by connecting two or more than two high points. Then second high must be lower than the first line to have a negative slope. This is a downtrend or a bearish trend. These downtrend lines show that supply is less than demand.
Q/3: Define
in your own words what "Supports and Resistances are and how we can
identify both zones (Show a screenshot of each one).
SUPPORT
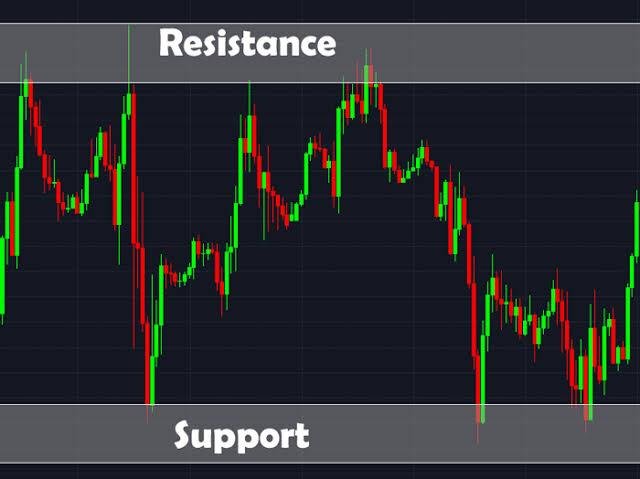
Support and resistance can come in various forms. It can be identified by a horizontal line. Support occurs where a downtrend is expected to pause due to a concentration of demand. Support levels can be visualized using different technical indicators or simply by drawing a line connecting the lowest lows for the period.
RESISTANCE
The resistance indicates the previous highest point. We can say if a trend line meets with the previous highest trend line it means the resistance is broken and now it’s the best time for traders to invest in this asset because it has a chance to increase the price. If we apply the trending lines in our chart I can give us the more intense view.

Q/4: Explain
in your own words at least 2 simple chart patterns with screenshots.
I would like to discuss
here double top or double roof chart pattern and double bottom or double floor
chart pattern.
DOUBLE TOP OR DOUBLE ROOF
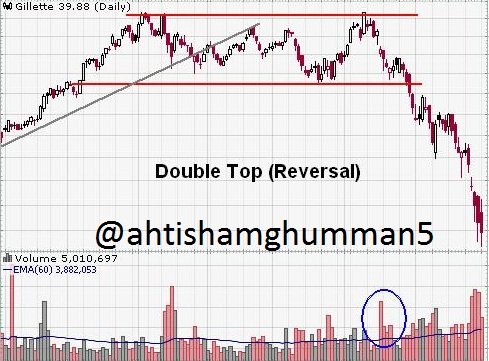
In double chart pattern two high appears at the same time. The previous highest high trend lines and the recent highest trend lines at the same level. You can see it looks like a roof and it’s called the Double Top and Double Roof. It shows that the next higher cannot be higher than the previous higher. It shows it has chances to price decrease.
DOUBLE BOTTOM
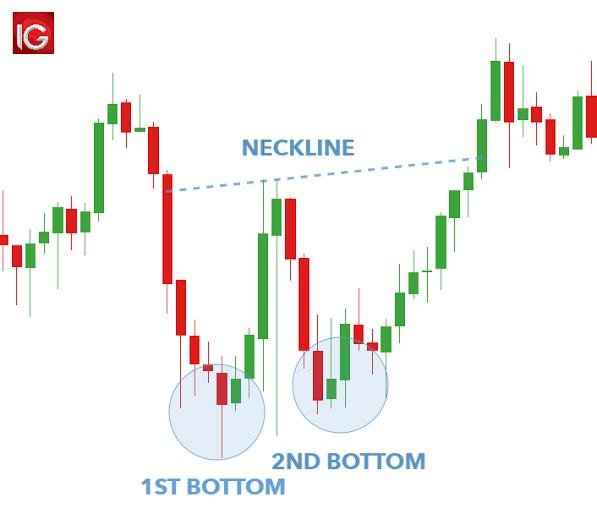
In the double bottom chart pattern two lowers appear at the same time.
Double bottom pattern is opposite the double top chart pattern. You can see in
the downtrend recent lowest low is formed at the
same level at the previous lowest low. It’s called a double bottom chart pattern.
The second lower shows it has a chance to the higher price.
CONCLUSION
It’s
very important to follow the trends. Trends are very important in technical
analysis. Mostly traders do their trade by following market trends because they
know which time is best for investing and which time is best for getting profit.
Hi Respected Professor @lenonmc21 kindly check my homework task the date of this post is about to end.
Thank You 😊
Downvoting a post can decrease pending rewards and make it less visible. Common reasons:
Submit
Greetings, @ahtishamghumman5, your assignment was submitted well after the deadline, so it will not be reviewed. Please note that you have 6 days to submit your assignment within the deadline.
Remember that plagiarism is not allowed is one of the main rules.
Steemit Cryptography Professor
@lenonmc21
Downvoting a post can decrease pending rewards and make it less visible. Common reasons:
Submit