This is the eighth week of the Crypto Academy season 3 and I am thrilled to take part in this week's task by Respected Professor @asaj on Crypto Assets and the Random Index.

In your own words define the random index and explain how it is calculated
The random index is known as the KDJ indicator it uses to predict the price of any crypto asset and also for the market at a certain time. KDJ indicator has three lines K LINE D LINE and J LINE. IF we talk about K and D Line it shows us the selling and buying and the J line is quite a new divergence the value of D from the value of K.
It is a technical indicator and it uses for the prediction of the price. many traders use this indicator to predict the market price for making a profit. The KDJ is similar to Stochastic Oscillator just the difference is the J LINE is added to this indicator.
Select a period say 14 days then the KDJ can be calculated as
%K Line = (the latest Closing asset price – the minimum price of the asset within 14 days) / (the current highest asset
price - the minimum price of the asset within 14 days)
%D Line = SMA of 3 Periods of the %K line
%J Line = 3 %K - 2 %D


As we know the indicators cannot give us 100% accurate information and the random index indicator also cannot tell us the correct information. if you want to invest don't rely on only one indicator I suggest you use some other indicators too and then invest or sell something.
Random index indicator is a well-known indicator but if we talk about flat markets it shows the wrong signal that is why I said above don't rely on only one indicator combine two or three indicators and then do your next step.

How is the random index added to a chart and what are the recommended parameters? (Screenshot required)

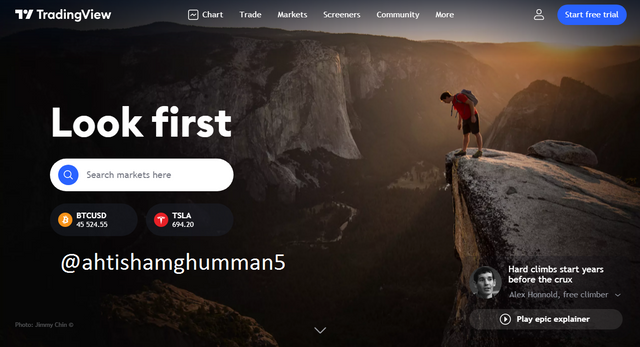
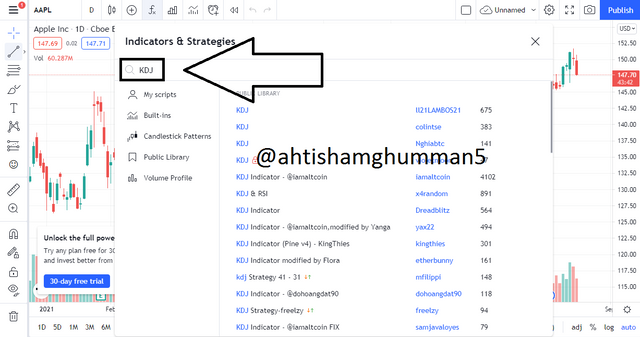
- Go To Trading view.
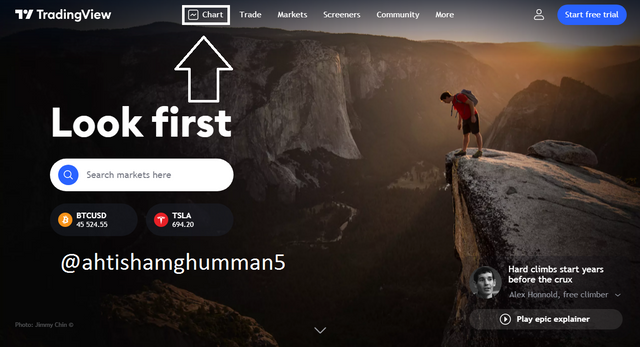
- Cick on chart.
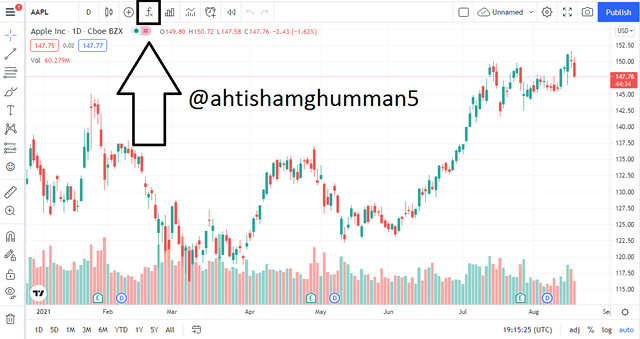
- Click on FX.
- You can see a search bar is open
- Search KDJ and click on it
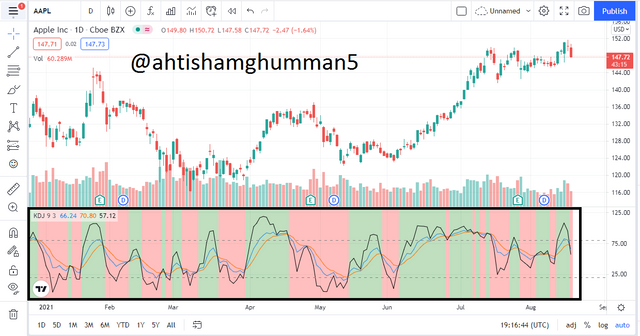
- Now you can see indicator is applied on chart.


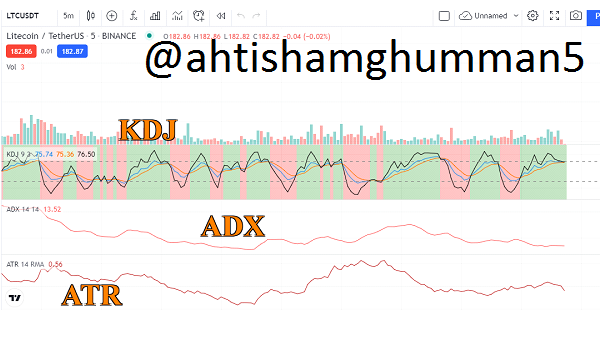
KDJ
KDJ indicator shows the asset is oversold or overbought. when the K line or this K indicator is greater than 80 it means the asset is overbought and when the K line or K indicator is lower than 20 it means the asset is oversold. KDJ indicator shows us the direction of price.
ADX
ADX indicator has only one line. This indicator is mostly used with MA (Moving Average) and it shows the strength of price direction and it used to show the strength of the market trend. when the periods are not given it uses 14 periods for the calculation
ATR
It also has only one line like the ADX indicator. It is used to show the market volatility in a certain period. It doesn't indicate the price direction. it determines the market and shows the highest and lowest value.

Use the signals of the random index to buy and sell any two cryptocurrencies. (Screenshot required)
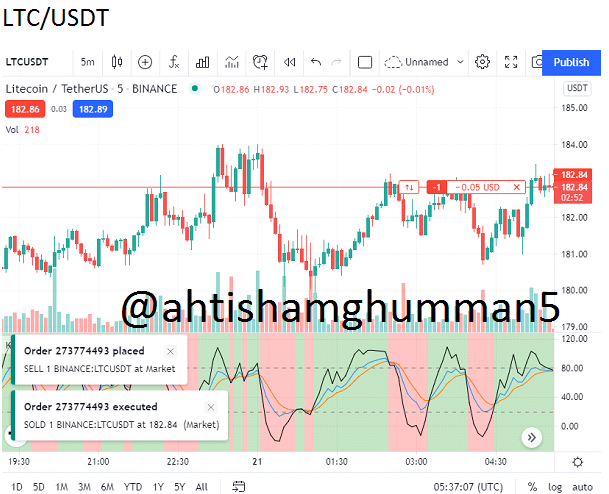
LTC/USDT
SELL ORDER
The blue line was crossing the yellow line to move below it and the market was the J line was coming back after touching the 80 line I placed the sell order.
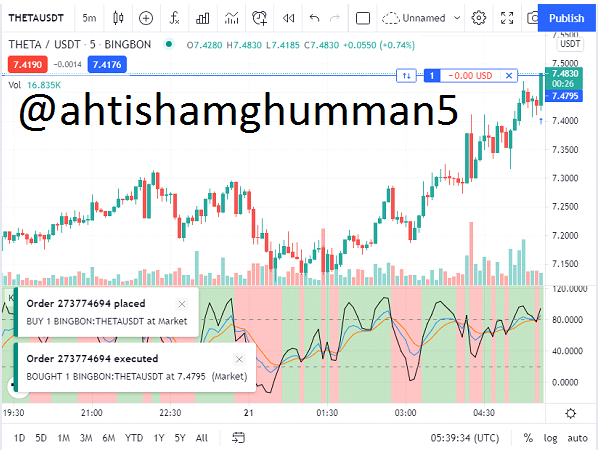
THETA/ USDT
BUY ORDER
The blue line was crossing the yellow line to move above an intersection was achieved near the 80 line indicating a strong uptrend reversal. I placed the buy order.
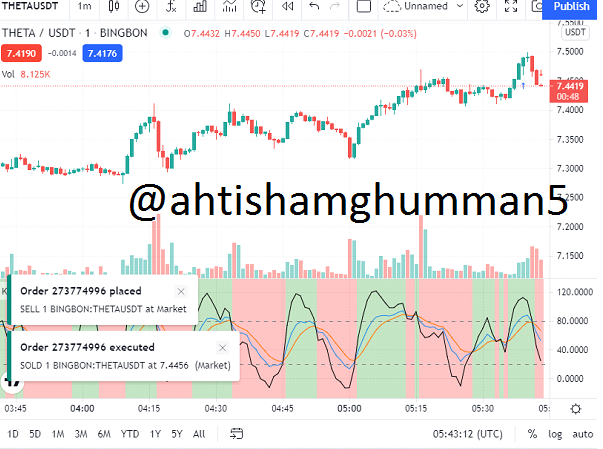
SELL ORDER
Opening the one minute chart I saw that the market was falling I closed the trade with no profit loss so that I can be protected from major loss
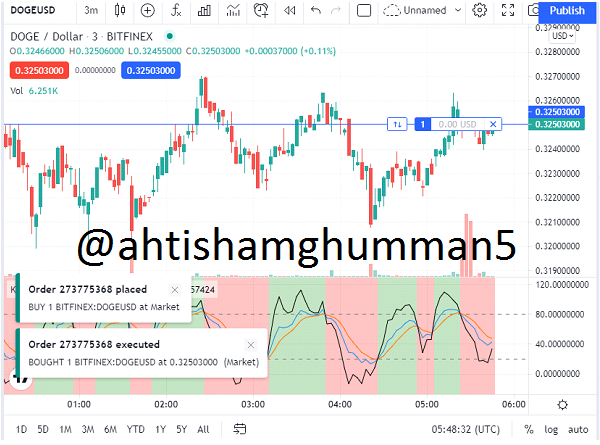
DOGE/USDT
BUY ORDER
Both the lines were nearing the point of intersaction indicating an uptrend reversal. After the formation of three bullish candles I placed the buy order

Hi @ahtishamghumman5, thanks for performing the above task the eighth week of Steemit Crypto Academy Season 3. The time and effort put into this work is appreciated. Hence, you have scored 5.5 out of 10. Here are the details:
Remarks
You have demonstrated a good understanding of the topic. You have performed the assigned task excellently. However, your answer to task 5 could have been better if you had analysed two coins with clears charts providing the buy and sell signals as well as a screenshot of your demo account summary. Also, you did not provide the level of details we look out for in the academy.
Downvoting a post can decrease pending rewards and make it less visible. Common reasons:
Submit