This is @aizazghumman, here I am going to share my homework post on the topic " Trading with Contractile Diagonals" given by respected professor @allbert
.jpg)

1- Define in your own words what a contractile diagonal is and why it is important to study it. Explain what happens in the market for this chart pattern to occur. (screenshot required / Bitcoin not allowed)

The bullish contractions when converge they predict a bearish reversal and when bearish contractions converge they predict a bullish reversal. The 1,3,5 pivot points are located on one trend line and the 2, and 4 pivot points are located on the other trend lines. These trend lines behave as support or resistance lines in the chart depending again on the situation of the market.
In the chart above we see a contractile diagonal in a bearish trend which predicted a bullish reversal. Though the market showed a consolidated structure for some time it is mainly due to corresponding buying and selling pressure but it soon moved high confirming our analysis.
The convergence of the diagonals denotes a decrease in the volume of the asset in favor of the ongoing trend which is shown by the decreasing wavelength of the wedges such the successive wedges are smaller than their predecessors. This then shows lesser market execution in the current market direction and the market explodes to the opposite trend.
The pattern is widely used by traders as it is easy to pick and if used with the right TP and SP levels it guarantees large margins.

2- Give an example of a Contractile Diagonal that meets the criteria of operability and an example of a Contractile Diagonal that does NOT meet the criteria. (screenshot required / Bitcoin not allowed)
Visually as well as graphically the right contractile diagonal always moves forward to converge indicating a decrease in the volume in the favor of trend. In addition to that it is followed by a trend reversal. This may be true but not always. There is a set criterion that deems a contractile diagonal pattern to be ideal. Patterns fulfilling that criteria re called operative whole those that do not are called non-operative. The set criterion is as under:
Wave 1 should be longer than wave 3
Wave 5 should be shorter than wave 3
Wave 2 should be longer than wave 4
The first support or resistance/ trend line should join the pivots 1, 3, and 5.
The other support or resistance/ trend line should join the pivots 2 and 4.
In short, the pattern should be such that the successive waves should be smaller than the previous such that the two diagonals meet not far away from pivot 5.
Contractile Diagonal that meets the criteria

In the chart above we see that the price action, waves, and diagonals met the set criteria. Wave 1 and 3 may be comparable if we consider the wicks in the candles of wave 3 but inaccuracy, it is shorter. In addition to that wave, 2 is longer than wave 4, and the diagonals also joining the corresponding points. The diagonals converge indicating a bullish reversal.
Contractile Diagonal that does NOT meet the criteria

In the chart of LINK/USDT, we see that the trend line acting as support failed to meet the required 1,3, 5 pivots. It does not converge at the end. It is because wave4 is shorter than wave 2 which is not true in this case. After these bullish contractions we, therefore, do not see a significant price reversal. Although there was a short-term dip in the price trading a non-operative diagonal pattern especially without TP and SP is quite dangerous.

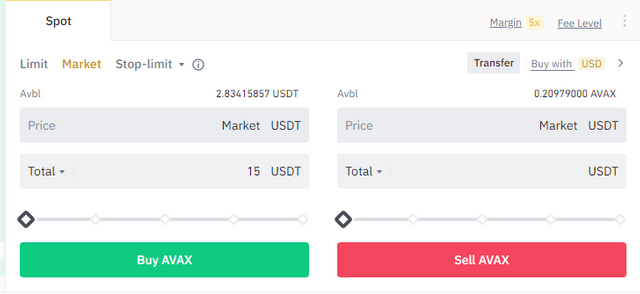
Through your Verified exchange account, perform one REAL buy operation (15 USD minimum), through the Contractile Diagonal method. Explain the process and demonstrate the results and graphical analysis through screenshots. Your purchase data must match your analysis data: such as cryptocurrency and entry price.

I was able to get an accurate contractile diagonal pattern. I traced this pattern on tradingview platform and executed the trade on my Binance account. The market was moving in a bearish direction. I recognized bearish contractions and to my eyes it was appearing accurate but still I traced it on the chart Wave 1 was longer than 3 and wave 2 was longer than wave 4. ( the above resistance line mistakenly misses point 5 but if it had touched the diagonal pattern would still be correct). I looked for a breakout and as soon as it was spotted I placed the buying order. The TP to SP was set to 2:1. (the pattern was recorded later to the performance of the trade).
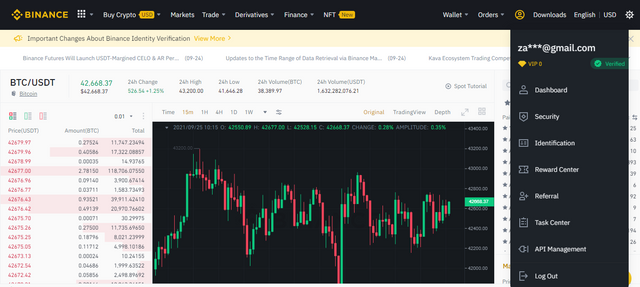
I executed the order through my verified Binance Account
.png)
.png)
.png)

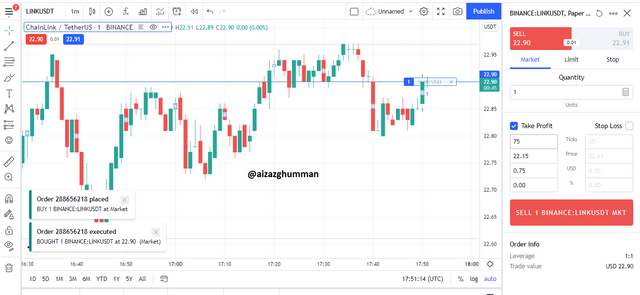
4- Through a DEMO account, perform one sell operation, through the Contractile Diagonal method. Explain the process and demonstrate the results and graphical analysis through screenshots. Bitcoin is not allowed.

For this order to I performed a real trade since it was an ideal setup and later my prediction proved right and the trade was successful. The chart above is recorded after the trade was taken.
It is just for the demonstration of the strategy. In the LINK/USDT chart the trend was currently bullish I located an ideal diagonal pattern. Wave 1 was fairly longer than wave 3 and the points 13,5 and 2,4 were joining with the help of the trend lines. I waited for a breakout then a retest and then placed the sell order. The TP to SP was set to 2:1.
.png)

5- Explain and develop why not all contractile diagonals are operative from a practical point of view. (screenshot required / Bitcoin not allowed)
All those diagonals that do not follow the above criterion are termed as non-operative. Not all diagonals are operative and that is for certain reasons. In a valid setup, the wavelengths of 1, 3, and 5 have to be in descending order and the same applies for 2 and 4. For the trend lines on one side, they must join 1,3, and 5, and on the other side, they must join 2, and 4.
In the chart below we see a pattern in which the points aren’t meeting and the diagonals are converging. Here the trend reversal is not suggesting a good pattern.

In the chart below we see a reversal but the points are not meeting. Wave 1 was too smaller than wave 2. After the momentary uptrend shift, the trend began to move down.

Sometimes the diagonals do not converge. They also indicate a weak reversal

Here we have a problem with wave 4 being too longer than wave 2.
In other cases, all the requirements of the diagonal pattern are met but the trend do not reverse. It is mainly due to a support or demand pressure at the time. For example In the EGLD/USDT chart below.

Although the waves and diagonals followed the pattern the trend did not follow suit. Traders who go themselves entangled waiting to take profit at the point 2 levels often face a lot of trouble here.

Conclusion
Traders often look for strategies that are easy to identify and comprehend. The contractile diagonal is one of those. But it may give false signals there it needs to be traded with the right stop loss and take profit levels. It is important to make sure that the pattern is according to the set criteria to prevent oneself from placing wrong orders.
Regard
@aizazghumman