INTRODUCTION.
Education is expensive, so said an adage but in steemit, education is a big business or a good source of income to all diligent and good writers. For me, it is a never to miss opportunity even though it is not always that easy. Like some of us who do not have advance knowledge on crypto, it takes us days to read, understand and put together what we learn from the class in the form of homework task.

Having read this week's lecture on Psychology and Market Cycle, I am happy to present the homework task as required by the professor.


Psychology.
Psychology as a word has a broad meaning that involves both human behavior and the mind as well. In this contest, I will be using the word to denote just the behavioral pattern not of human life but, of market trend or cycle.

Market Cycle.
Market cycle is a process that a market trend usually follows from beginning to end which is often being repeated and it comprises of the following:
- Accumulation Phase this is the first phase that begins a new cycle after the the completion of the former cycle. At this point, experienced investors start to buy, making valuations very attractive because the price is at its lowest point.
- Mark-Up Phase in this second phase, the market has been stable and the price is beginning to move higher than before. As time passes, more investors begin to join seeing that it is going high. Having advance close to its peak, the late majority of investors that joined makes the market volumes to increase rapidly. While the late investors are joining, the first experienced investors that invested earlier on will start to sell. The Price makes its last move, hitting the selling climax.
- Distribution Phase
In this third phase of the cycle, primarily known as a period the bullish or increased sentiment of the second phase turns into a mixed reaction, whether the price will remain like this or not. The prices may remain like that for a few weeks or months. After this phase, the market takes a reverse direction. - Mark-Down Phase this is the fourth and final phase in the market cycle. This is the most painful part for those late investors. Most of them maintain position because their investment at this point is below what they bought. When the market trend must have gone way down, most of them will give up thereby causing a drastic fall in price.

Accumulation, Mark-up and early part of Distribution constitute the positive attitudes found in “Psychology of a market cycle chart” while the later part of Distribution and the Mark-down constitute the negative attitudes in the “Psychology of a market cycle chart”.

FOMO.

What is FOMO? This is an acronym that stands for “Fear Of Missing Out.” It is a feeling developed as a result of one’s present condition. This feeling is based on a perceived better condition that one is to enjoy but not enjoying it. This feeling happens in all aspect of life at various stages. For example, some people pass their answer script during exams, not because they have finished but because most of their friends have passed theirs. Even in marriage, some marry not because they are ready in all aspect but because others are getting married.
The cycle it occurs? In crypto market, FOMO drive so many traders/investors to make wrong decision. It occurs toward the end of the bull phase. When market price keeps appreciating, long bullish candle stick is form, one will start fearing that he/she is missing out on the promising indication. From the Psychology of a Market Cycle chart FOMO usually occur between Thrill and Euphoria cycle stage.
Why does it occur? This occurred because of huge green percentage growth that is formed on a market chart, the next candle stick follows the same bullish pattern. Most times trading is driven not by valuation but by emotions. As the price near it’s highest level -the apex, some who have not made any investment in the asset will feel that they are missing out. At that point they will not consider other factors to ascertain if it will still go up, but will jump into conclusion that it will.
It is the fear of missing the train, which in turn results in you getting on the wrong carriage.
Like my Professor said above, getting on the wrong carriage is making investment is about taking a down turn trend.

From the above screenshot, we can see the cycle where FOMO takes place and the investor/trader risk losing some money because the bullish trend will soon get to the highest level and then turn to bearish trend. Any purchase or investment done at this point is very very risky as the market price will soon depreciate.

FUD.

What is FUD? Like FOMO, this too is an acronym that stands for Fear, Uncertainty, and Doubt. It is one of the fear-based factors that drive trading in most cases. This entails Fear of losing money, Uncertainty of not losing more money, Doubt of not losing all including the capital.
The cycle it occurs? This feeling can occur either at the middle or at the end of a bearish trend, usually when the depreciation in price has become evident in several candle sticks.
Why does it occur? This occurred because the price have gone down, fear of losing money sets in. As the price depreciate more and more, the uncertainty of not losing more money becomes the thought. Yet the bearish trend keeps going down, doubt of not losing all the money becomes the overwhelming thought.
when you are riding on the train and it doesn't seem to be going to your destination, which causes you to decide to jump out of the train at a speed of 100km/h.
As the above statement indicates, FUD can make one to take a very drastic decision. Such a decision may either deprive the person an excellent opportunity to get something or may safe the person from losing more -including the capital.

From the above screenshot, we can see various red/bearish candle stick, that shows the cycle where FUD takes place. Either selling or buying of any stock is risky as well because the trend may maintain the bearish/downward pattern or may change to bullish/upward pattern. If the bearish trend has gone downward to the minimal, then investing might be a good option.

The two (2) crypto assets I want to discuss their position in the emotional phase of the cycle and my reason for saying so are as follows:

SHIB.
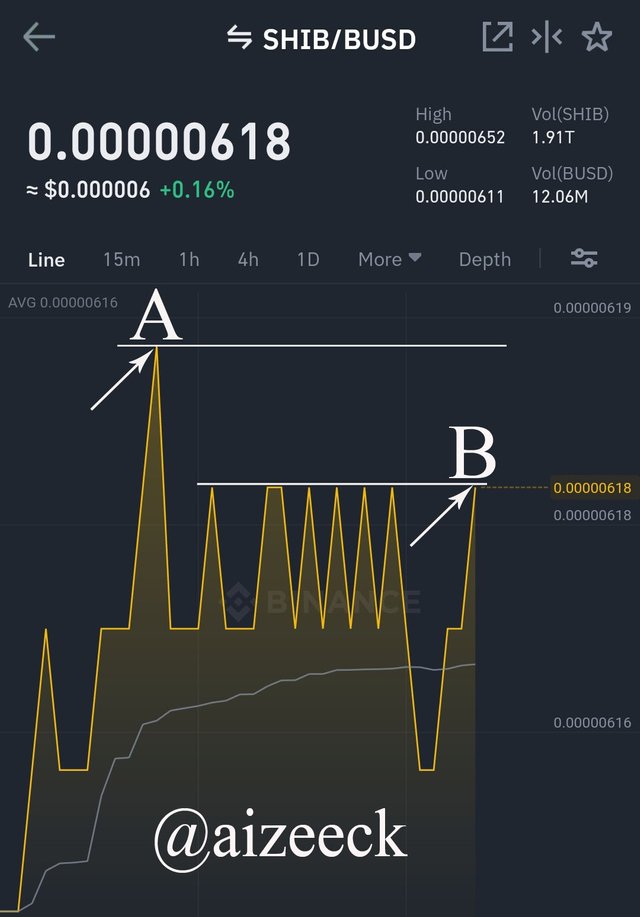
From the above screenshot, there are two different points tagged A and B. The trend/pattern shows positivism. It is a bullish trend that moves upward which comprises the emotional phase of Hope, Optimism, Belief, Thrill, and Euphoria for point A. It’s clear that point A, marks the end of such positive feeling, thereby setting pattern for the downward trend.
Close to point A is usually when one will have FOMO, which leads to wrong conclusion of investing. Point B gives room for those with FOMO to “jump in” which might be a wrong decision. The trend at point B could either continue upward or turn downward. It is therefore important to consider other factors as long as point B is concern, before investing rather than just relying on emotional feeling.
The explanation given above does not encourage or discourage investing in the asset or any other assets that forms similar pattern. Making any investment is at the investor’s risk. The writer is not liable of any loss that may occur.

AXS.
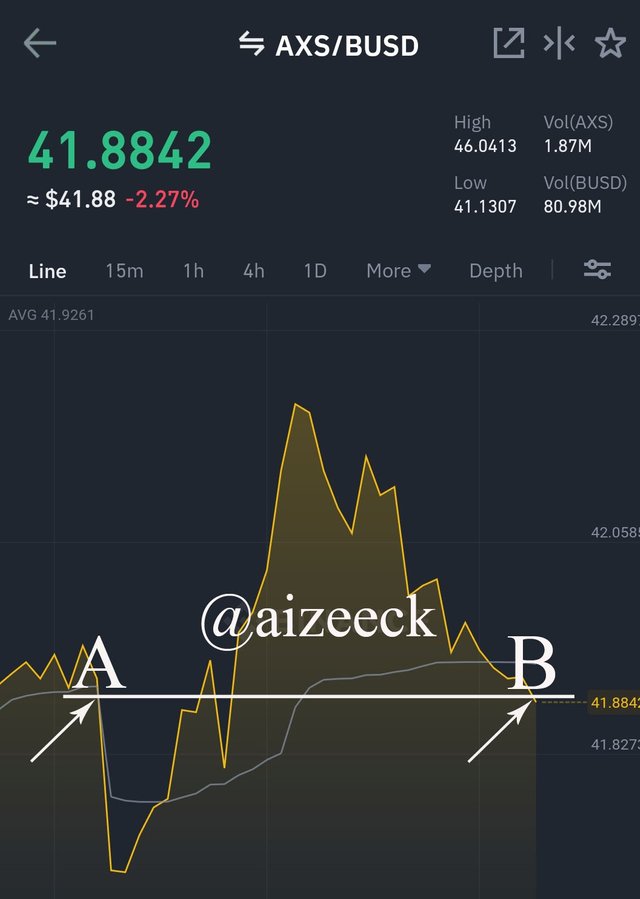
From the above screenshot, two different points A and B are of concern. Point A was a bearish downward trend that has it’s position at the negative side of emotional phase of the cycle which constitute Complacency, Anxiety, Denial, Panic, and Anger.
Although point B is a downward trend yet its next pattern is uncertain. For those who invested few minutes before it gets that position, FUD is the sure feeling they will be having. If the trend continued downward, they may “jump out,” sell their assets. But the fact is that the movement is unpredictable by just looking alone. Consideration of other factors is what will make the next pattern predictable.
The above explanation does not encourage or discourage investing in the asset or any other assets that forms similar pattern. Any investment is at the investor’s risk. The writer is not responsible of any loss that may occur.

Based on the knowledge I acquired from the class, I made a purchase of cryptocurrency.
I downloaded a Binance App, created an account and verify it. Please note that all the screenshots were taken from my Binance App.
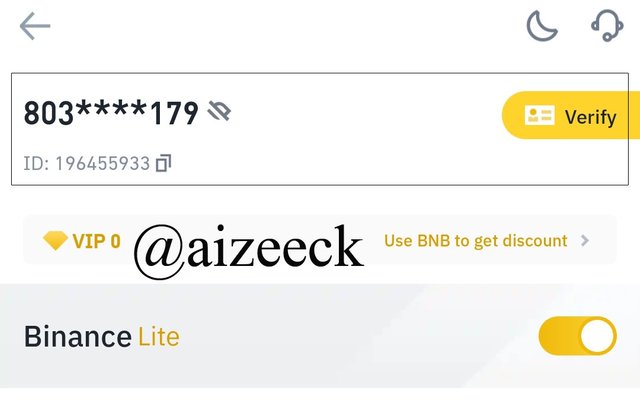
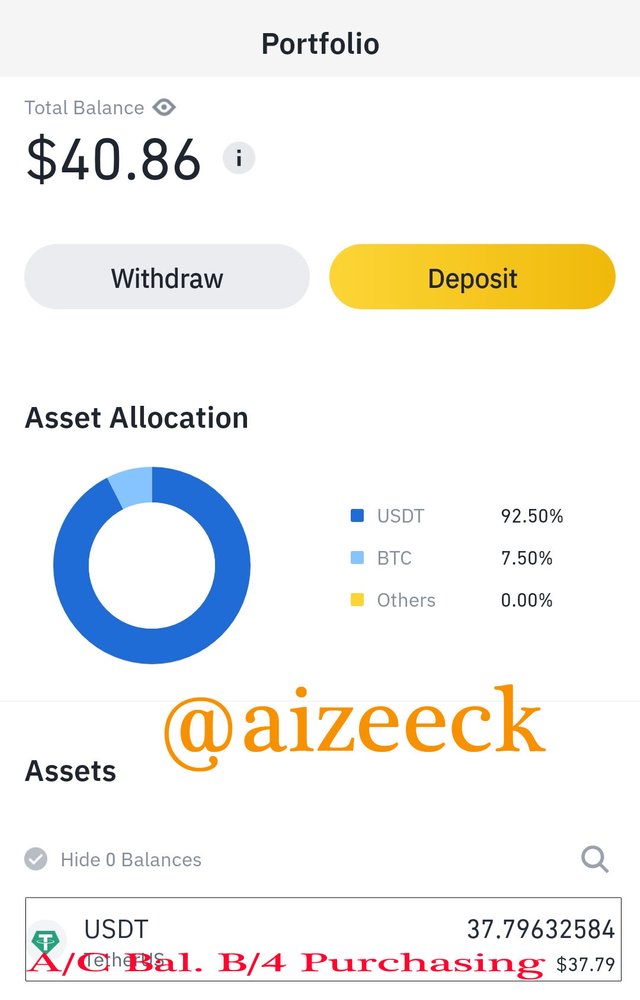
I was thought on how to fund the account with my SBD. The above screenshot shows the amount in my Binance account which was used as an example for me on how to convert SBD to steem and move the steem to my Binance account. I later followed the process and further fund my Binance account.
I used the steem in my Binance account to get USDT which I use to make my first purchase. The following screenshots shows the different purchases done.
The first purchasing was bitcoin (btc) with the USDT, though I didn't take much screenshot.
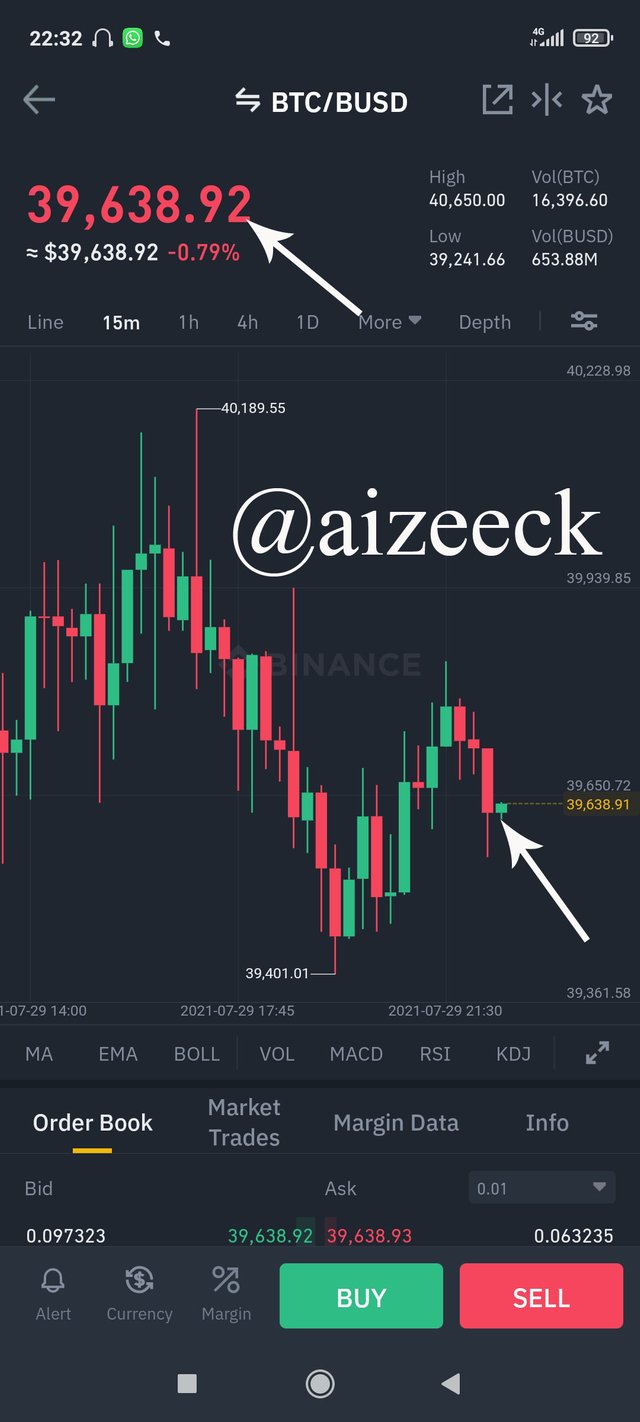
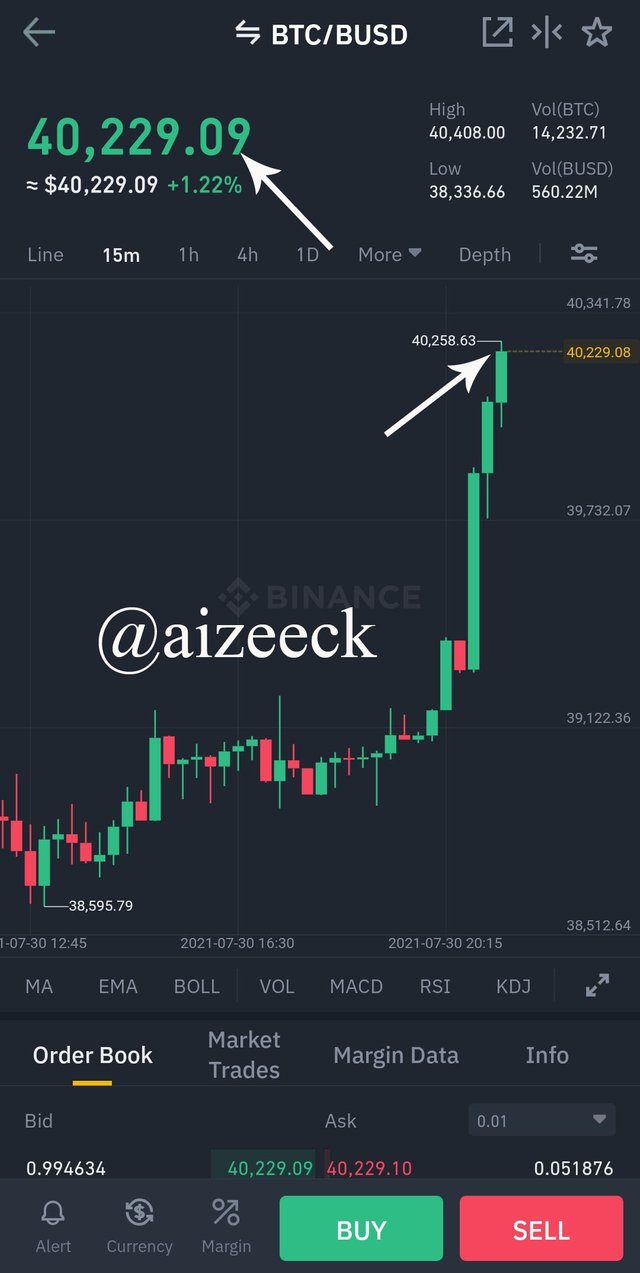
I bought the crypto when it was going down as pointed by the arrow and as at today, the price have gone up as in the next screenshot
The second transaction I did was the purchasing of Naira (ngn) with USDT.
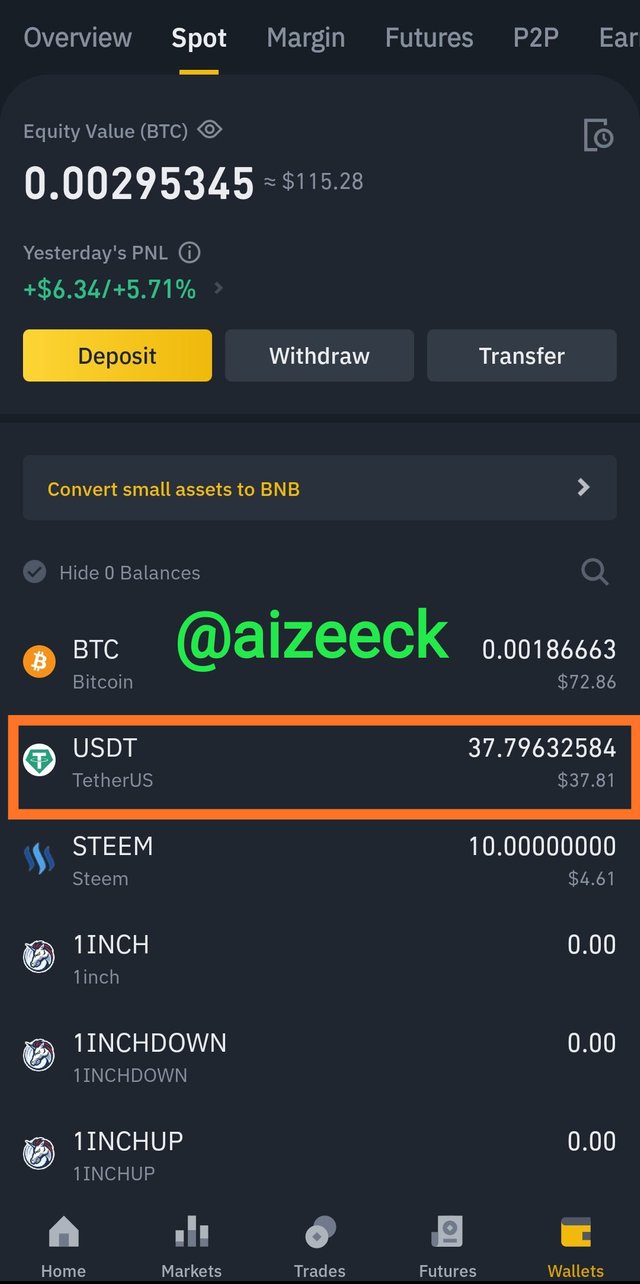
This screenshot shows the amount of USDT in my Binance account before making the second purchase.
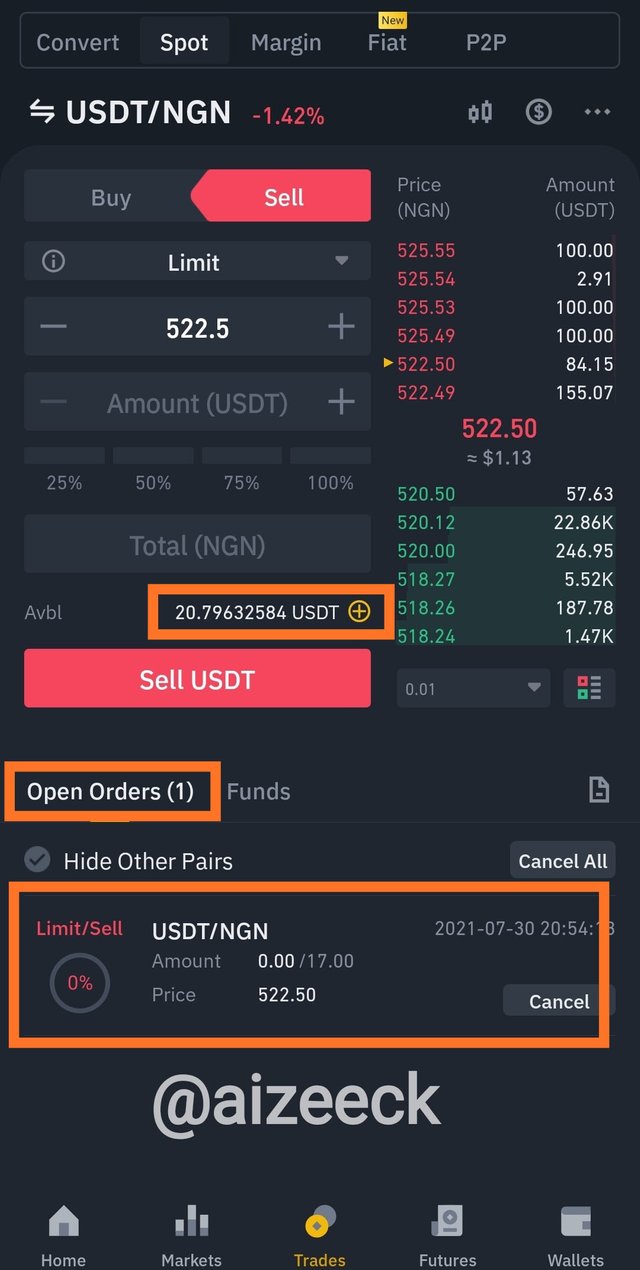
I used 17 USDT to purchase the Naira (ngn). As shown in the screenshot, the balance of my USDT was reduced to 20. The purchase created one open order as shown in the screenshot above.
Although I did another purchase of 10 USDT but I didn't take any shot on that. My reason for saying it is because of my balance, 37-17=20. Then I did another one of 10 (20-10=10)
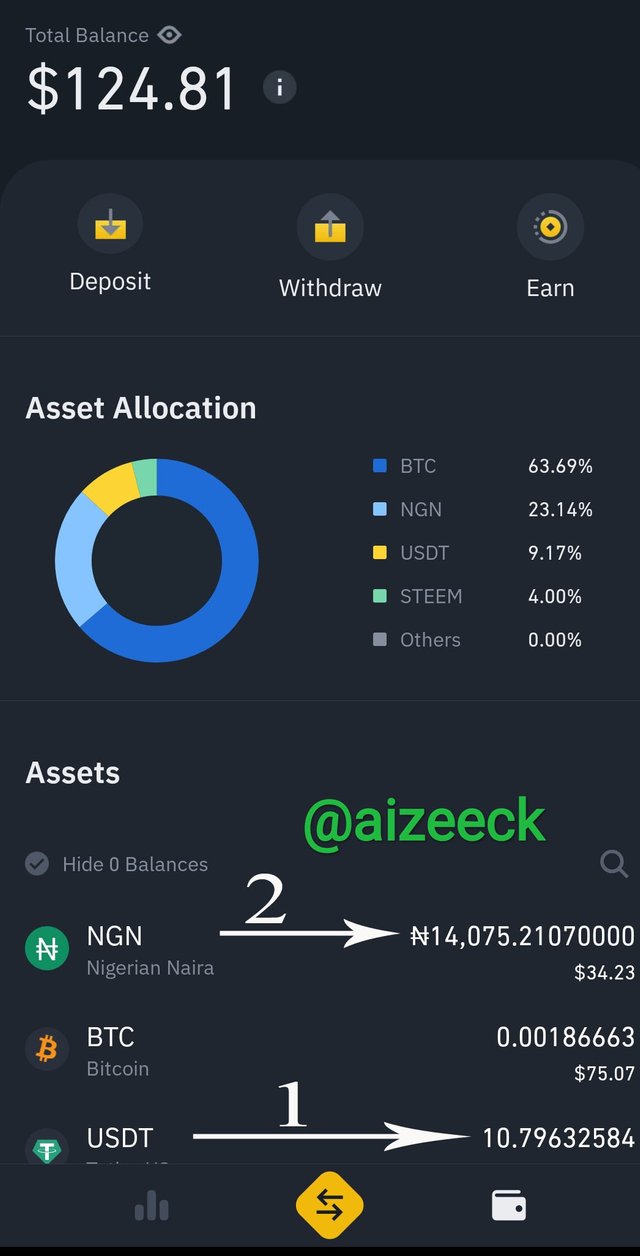
As indicated in the above screenshot, arrow 1 pointed to the balance of my USDT while arrow 2 pointed to the balance of my Naira (ngn).

CONCLUSION.
I really thank Professor @allbert for his simplicity in teaching. Such pattern of teaching makes it easier for people like me to understand with a common illustration. Personally, I learnt the need not to zig while other zag which will form a zigzag pattern.
It is good to buy when others are buying and sell when others are selling too, that is the entire concept of the class.
Thanks to all involved in making this week's class a success both the Professors and their Assistants.
Written By: @aizeeck
c:@allbert