
The crytopcurrency industry has some very vital components. At present, one of such is the Japanese candlestick chart. There are a number is other charts that can be used to represent the cryptocurrency market indices.
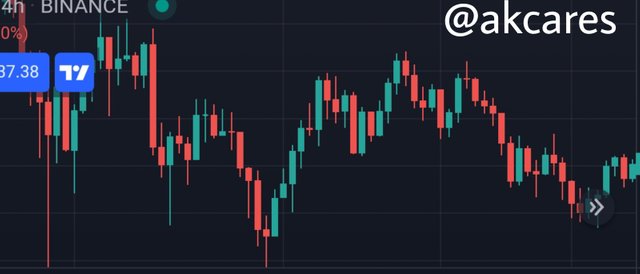
However, this has taken the top spot at the go-to chart for many traders. It has become the default chart used by most people. This chart type has some really important features about it such as the various patterns which gives it much attention and usage. I will be tackling questions about these pattern in the sections to follow.

In your own words, explain the candlestick patterns and their importance in carrying out effective technical analysis. In your own words, explain the psychology behind the formation of the following candlestick patterns. - Bullish engulfing Candlestick pattern - Doji Candlestick pattern - The Hammer candlestick pattern - The morning and evening Star candlestick pattern. - The Harami Candlestick pattern.

Candlestick patterns and their importance in carrying out effective technical analysis.
Candlestick Patterns
All due regards and reference need to be paid to Munehisa Homma for his ingenuity and intiative in creating something as useful and important as the Japanese candlestick chart. This chart has been a very viable tool used by traders as guide for their trading schedules.
The different patterns and structures found on this chart can be very revealing and informative. While analysing a market for entry, traders employ these patterns as technical guides.
Some of these candlestick patterns include:
Engulfing Patterns
There is a popular phenomena with a class of microorganisms where one completely covers another organism or food material and digests it as a feeding process. This is actually the idea about the tag given to this pattern.
Engulfing candlestick pattern is creates with two candlesticks where a succeeding candlestick forms bigger and overwhelms the preceding one. For an engulfing pattern to occur, the succeeding candlestick has its body much larger than the previous one.
There can be bullish and bearish engulfing patterns.
A bullish engulfing candlestick pattern is when in a bearish trend, a candle is formed which opens at or below the close of a previous candlestick and closes higher and above its open point.
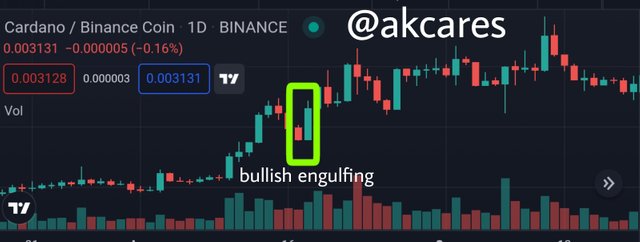
Here, the succeeding candlestick has its body open at or below the closing point of the last candlestick and growing up to surpass the opening point of that last candlestick and close above it.
As can be seen in the screenshot above, this usually indicates a reversal of the trend from bearish to bullish. When the bullish engulfing pattern is spotted in a downtrend, it means that the downtrend has reached its end and a new uptrend is beginning.
A bearish engulfing candlestick pattern is formed when in an uptrend, a candlestick forms with the open being at the same point or above the close of the penultimate bullish candlestick and the body growing to close below the open point of that candlestick.
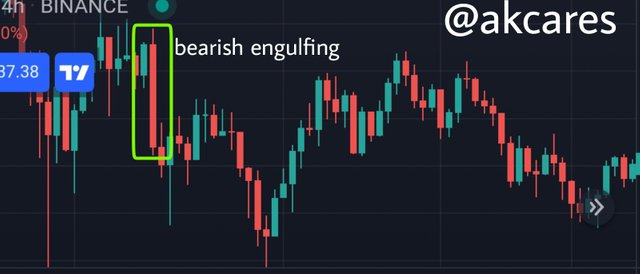
The body of this current candlestick begins at the close of the last bullish candlestick and ends at some pips lower than the open of the previous candlestick.
This is significant because it shows that the recent uptrend has reached its terminal point and a new trend which is most likely going to be a bearish movement is taking over as seen in the chart above.
Doji Patterns
This pattern is formed when the forces of demand and supply cancels out with neither being able to be greater than the other. Doji patterns are evidence that the purchasing power of buyers have is being equally matched by the volume of supply.
This is seen by there not being a candlestick with a body as the price opens and closes at the same point even after it had moved some distance. Here, neither buyers or sellers are having control of the market. The price direction is not certain.
The doji candlestick has some variations in shapes and these leads to the different kinds of doji candlestick patterns. There are the dragon fly, grave stone and long-legged doji candlestick patterns. These are differentiated based in which direction the price moved over during the time period before finally coming close at the same point it opened.
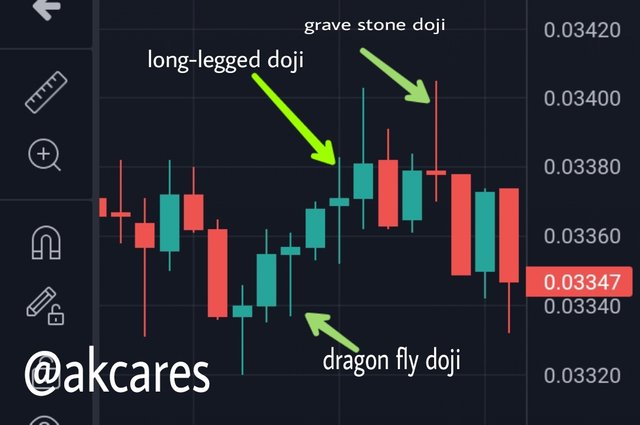
The dragon fly doji is simply as the natural dragon fly. It has the price up above with a long shadow or wick below. This shows that, sellers had probably tried to push the price down but their efforts were met with similar resistance from buyers.
The gravestone doji pattern also has some symbolism of a literal grave stone. Here, the price opens and closes at a point down below on the candlestick which has a rather long upper wick. This implies that buyers has exerted buying pressure after the price opened, but this pressure was countered by sellers thus returning the price to its original position
The long-legged doji pattern shows a rally from both buyers and sellers which was opposed adequately. Here, there is a wick of almost equal length on both ends of the price. It means the price had been pushed up by buyers but was repelled by sellers and it was also pushed down by sellers but was repelled by buyers.
Morning Star Pattern
This pattern is formed using three candlesticks, the first being a strong bearish candlestick. This shows that the price is going down and there is selling pressures. The second is a doji candlestick indicating a period of lowered strenght from sellers. It shows that the supply power of sellers is down and weakened and as such, the trend faces potential reversal.
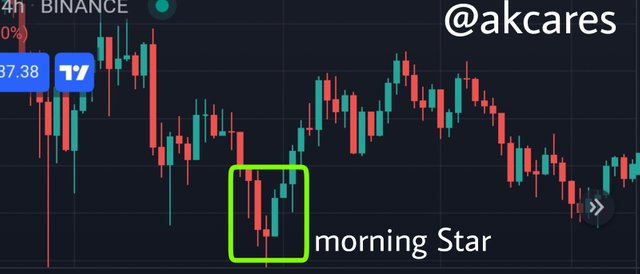
Here, sellers become unable to surpass the purchasing power of buyers. There is a third candlestick in this configuration which is usually a bullish candlestick. It grows quite larger and covers the penultimate doji candlestick.
The formation of this candlestick indicates that buyers has exploited the weakness in selling strenght and have taken over control of the market with their purchasing power. The morning star is a bullish reversal candlestick pattern.
Evening Star Pattern
This is a contrasting pattern to the one above. It is the direct opposite of the morning star. Evening Star pattern also has in its configuration three candlesticks. The first is a strong bullish candlestick which means that at that point, there was strong buying pressures and the bulls were in control of the market.
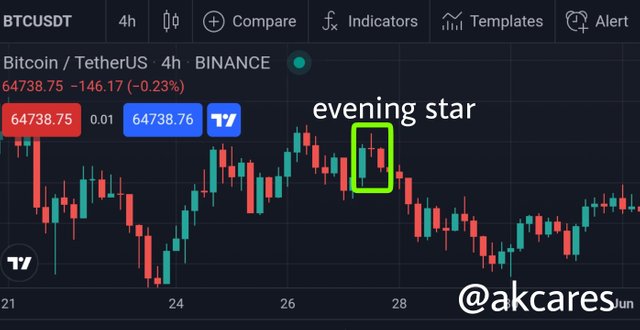
This bullish candlestick is succeeded by a doji candlestick which is a sign of wakening power of buyers. Price stalls at this point with buyers unable to keep it rallying upwards. Then there is the third candlestick, a bearish one which is quite strong and well formed. It shows that sellers have taken advantage of the weakness from buyers and are now in control of the market.
When this is spotted, it is a strong indication that the recent uptrend will be reversed to downtrend.
Hammer Pattern
This candlestick pattern occurs when the price opens and closes at very close distance. It comprise a very small candlestick body with a long shadow. The shape is just like that of a hammer. The small body is up above on the candlestick while the long wick is under it.
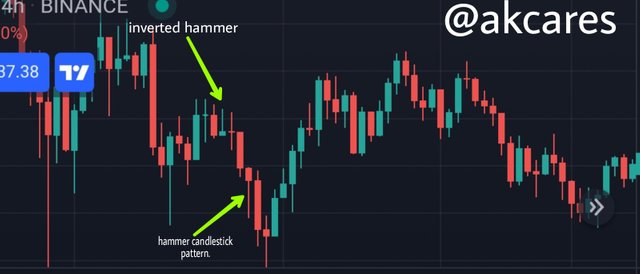
There is no much difference in points from the open of the candlestick to the close even though the price had moved over some distance.
The hammer pattern is gotten from sellers initially pushing price of an asset down with selling pressures but later, buyers step into the market and utilize their purchasing power to push the price back up towards the open point.
This signifies price rejection by buyers and when this occurs in a downtrend towards a support level, it indicators potential reversal. The hammer pattern is a bullish signal when at support levels.
The hammer pattern can also occur in the opposite orientation and it is tagged inverted hammer. This has similar stature as the hammer only that in this case, the small body is not on the upper end of the candlestick but on the lower end with the shadow being above it.
This inverted hammer has great significance when it is formed close to or at a resistance level. It shows price rejection by sellers. It means that after opening, buyers had tried to push the price up but Sellers began to oppose this push and were able to drag the price down towards the open point.
If in a uptrend, close to a resistance level this pattern occurs, it entails a strong possible reversal towards a down trend. This means that the inverted hammer can serve as a bearish signal at such points.
Harami Pattern
This pattern is made up of two candlesticks, the first one a larger bullish or bearish candlestick and the second a smaller bearish or bullish candlestick respectively depending on which one comes first. This pattern also signals a potential reversal or continuation.
However, when it occurs after a period of the market trending in a particular direction at the top of bottom of the trend, it usually entails an impending reversal.
The pattern indicates indecision on the part of the market players. It shows and tussle to gain control of the maker by buyers and sellers. This pattern can also be either bearish or bullish.
If the large preceding candlestick is a bullish one and the small succeeding candlestick is a bearish one, this is called a bearish harami Pattern. This serves as a strong signal especially when it is at a resistance level.
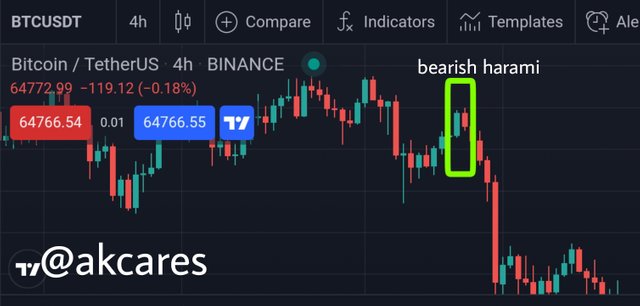
If the preceding candlestick is bearish and the succeeding candlestick is bullish, this constitutes a bullish harami candlestick pattern*. This gives a strong bullish signal if it appears at or close to a support level.
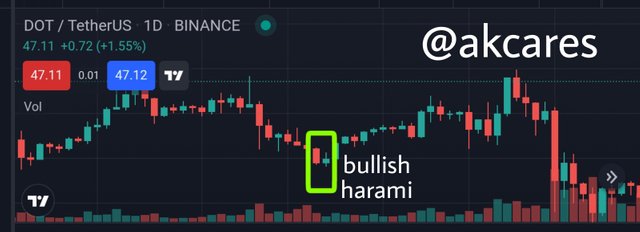

Importance of Candlestick Patterns for Effective Technical Analysis
Candlestick Patterns have some real significance and are very important for conducting technical analysis.
Showing Market Conditions
From the chart, a trader who pays close attention can be able to deduce the existing forces of demand and supply and how they evidently affect the asset's price. The big players as well as the emotions and prevailing sentiments in the market can be predicted using the candlestkck chart.
The Volume of sell or buy orders can even be seen. Candlestick patterns help a trader to know what is happening in the market at the moment.
Showing those in Control of the Market
From the anatomy of the candlestkcks and price movement, one can tell if there is a bearish or bullish control in the market. It is easier to tell whether buyers or sellers are those dominating at any point. A continuous line of more bearish candlesticks indicates large volume.of supply and selling pressures. Consecutive bullish candlestkcks show high purchasing power and buying opportunities.
Showing Price Fluctuations, Reactions and Behaviors
From observing the formation of candlestkcks, their anatomy, patterns and orientation or direction, it is easy to tell how rapidly the price of an asset changes and how unstable or volatile the asset is.
Indicating Possible Price Direction
From the patterns and anatomy of candlestkcks, an estimation of potential price movement can be made with some degree of accuracy especially when in combination with other technical analysis tools. Some candlestkcks patterns give indication of possible trend reversal or continuation depending on what pattern is formed.
Guiding Trading Decisions
All the information gleaned from the candlestkck charts are functional as bases for taking trading decisions.

Psychology behind the formation of the following candlestick patterns. - Bullish engulfing Candlestick pattern - Doji Candlestick pattern - The Hammer candlestick pattern - The morning and evening Star candlestick pattern. - The Harami Candlestick pattern.
Bullish engulfing Candlestick Pattern
The psychology behind the bullish engulfing candlestick pattern is that initially sellers were dominating the market but then lost the momentum and and buyers took over the control of the market with their high phpurchasing power.
Doji Candlestick Pattern
The psychology of this pattern is that neither buyers nor sellers are able to exert significant influence on the price. The buyers have no power to drag the price downwards and buyers' purchasing power is not sufficient to pull the price up.
Here, there is no dominance by buyers or sellers and the forces of demand and supply and equally matched thus cancelling out themselves to keep the price at the same spot.
The Hammer Candlestick Pattern
The underlying psychology for the hammer candlestick pattern is that initially, there was great selling pressures and sellers had dragged the price of the asset down to some distance. However, later during the same timeframe, buyers threw in their purchasing power and pushed the price back up towards the top of the candlestick.
The Morning and Evening Star Candlestick Pattern
For the morning star, the operating psychology is that initially, the market was in a bearish state with sellers having dominance but afterwards, they lost control giving room for buyers to capitalize on their weakened strenght and acquire control of the market.
The evening star works with the psychology that the market transitioned from being dictated by buyers to being controlled by sellers. Its operations is based on the concept that the initial dominance by buyers has been broken by sellers who now control the price.
The Harami Candlestick Pattern
The working psychology of this pattern is that after a period of dominance, the power to sustain the momentum begins to wane and the opposition force start showcasing their own power.
The bullish harami candlestick pattern works on the principle that after rallying for some times, the downtrend begins to end as the sellers power is weakened and as such buyers begin to move into the market which causes a period of struggle and indecision between buying and selling forces.
The bearish harami candlestick pattern is operating on a similar psychology as the one above but here is opposite in terms of who was in original control of price. The psychology here is that buyers has been dictating the market price leading to successive formation of bullish candlesticks. But this rally begin to loose strength and there is a form of opposition from sellers to take over the control.

I am still amazed by how progressive Munehisa Homma was in his thinking to be able to come up with a concept as functional and useful as the Japanese candlestick chart. This invention has not only enjoyed relevance for over 3 centuries, but also assist millions of people who are venturing into trading assets.
As it is, the Japanese candlestick chart is a very valid technical analysis tool. The patterns formed by these candlesticks provide useful information with which traders make trading decisions. When these patterns are read in consonant with other viable technical analysis tools like support and resistance, trendline and technical indicators, their signals can be of higher accuracy and probability.
There is high complexity and uncertainty in the cryptocurrency market, nothing is really sure. The volatility makes the industry a very risky one. The Japanese candlestick chart has gone a long way to simplify a lot of things. It has also made taking trading decisions much easier and accurate with some of the patterns available.
Using these tools carefully and properly would make a trader have more successes than failure.
This lesson has been a very interesting one. Well done Prof. @reminiscence01

Downvoting a post can decrease pending rewards and make it less visible. Common reasons:
Submit