Hello Everyone,
Alhamdulillah, I am fine with your prayers, I hope you are all well in this Covid-19 situation. Welcome to Steemit Crypto Academy and all of you to me. I invite you to read the homework post. Today's homework post is the Vortex Indicator Strategy subject that Professor @asaj has given us. For this, I thank the professor that I have learned a new subject for you. So let's discuss my homework task.
Q1. Explain the vortex indicator and how it is calculated?
What is the vortex indicator?
The vortex indicator is a type of indicator that traders use to predict the movement of nuts to determine direction. Simply put, a vortex indicator is a trend indicator that indicates the opposite of a trend. Starts a new trend and provides a continuation of the existing trend depending on the general bias of the market at a given time. The vortex index is 2010 by Etienne Botes and Douglas Slepman was developed by two people named, and it was originally made to be used in stock for many years but it later began to be used in the crypto world.

source
From the image above we can see that the vortex indicator has two lines of our choice in two different colors as here, we can see the blue and orange lines. One of which is to show the positive trend of the market and the other is used to see the negative or bad trend of the market. When these lines cross each other it creates a signal of buying and selling. Notice your screenshot above here showing the positive vertex indicator or VI + blue line as it presents us with positive movements in the market. On the other hand, the negative vertex indicator or VI-orange line is shown because it helps us to understand the negative movements in the market.
So let's see how this indicator works. We can see that it works over a period of time and it arises by calculating the distance between high and low over a period of time. If we take a closer look, we can see that the market is moving in a positive direction if the current period is longer and the last period is shorter. But on the other hand, if the length is less than the current time and more than the last time, the market is going into recession or negative. And like most indicators that we use, if the distance between the two lines is wide, the trend mission will be stronger which can be positive and negative.
How is the vortex indicator calculated?
As I said above the what Is Indicator establishes the market trend by looking at the current time and the end time of the market. If the current time is high and the market end time is low, then it is a positive market and for the opposite negative trend.
In the calculation of the vertex indicator, we have to focus on three things: Trend, Period, and Range.
{This is the short meaning:
cH = current High
pL = previous Low
cL = current Low
pH = previous High
cH = current High
pC = previous Close}
Trend: Here the upward and downward movement of the trend is basically calculated. Upward movement is calculated by subtracting the current high from the next low. (cH - pL) And the downward motion is calculated by subtracting the previous high from the current low. (cL- pH)
Period: When using it we are recommended to choose 14 because it is said that this time is reliable and it gives accurate results. You can stay calm with time at any time depending on someone's strategy. It doesn't matter what you want, the result is important. The time chosen in May will often determine the upper and lower lessons of the upward and downward movement.
Range: The actual range is calculated here and is calculated by selecting the maximum of it.
(cH - cL) (cL - pC) (cH - pC)
Q2. Is the vertex indicator reliable? Explain?
Since it is an index and the function of the index is to assist in the trading of technical analysis of those assets before trading the assets. In my opinion, the vortex index is reliable but although the truth is there is no indicator that works 100%, no strategy works 100% there will always be a time where false signals will also be given. If we look at it a little differently, we can see that no machine is ever 100% working, called percent efficiency in physics or machine design, and In reality, no machine can achieve 100%. Also, the instructions are the tools that are designed which are not always expected to be accurate. Like all other indicators, they have two things either they work for you or they don't but most of the time each indicator works for me at least a little bit. Because if the opportunity did not work, they would not have been invented and there would not have been so much publicity about them.
There are other things that I believe indicators for traders fail One of them is that most traders did not gain confidence in their trading strategies. Sometimes it’s not about the tools we use it’s how we use it determines how it will work. So if someone really doesn’t know how to use it then it will feel all the time. This is a failure indicator. If a businessman cannot achieve some level of psychology, no matter how effective the tool is, it will always seem a failure to him. So psychology is very important in finance trading. Trading works with emotions If one cannot control his emotions then he is not fit to trade. I say again the vortex index is a reliable indicator but the thing we need to look at is the number of lengths as in a normal market we should use the length of ৭ or 14 to get a faster and more accurate indication. And in a volatile market, we should use 28 or 30 lengths to reduce the margin of error due to price fluctuations and volatility.
For traders, if the blue line crosses the orange line, it is a buy signal, because the market is bullish on the bullish trend, and if the orange line crosses the blue line, it is a sell signal. Because it indicates a bearish trend in the market.
Q3. How is the vortex indicator added to a chart and what are the recommended parameters?
The platform I use to analyze the answer to question number three given by the professor is Trading View. So let's see how to add a vortex indicator chart through the trading view.
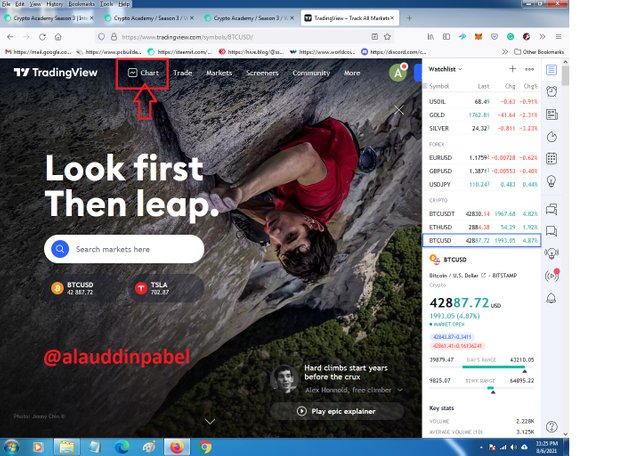
First I search for www.tradingview.com You to navigate the website then the interface that brings me to it is given below through the screenshot. Then I click on the chat option and it takes me to the next chat page.
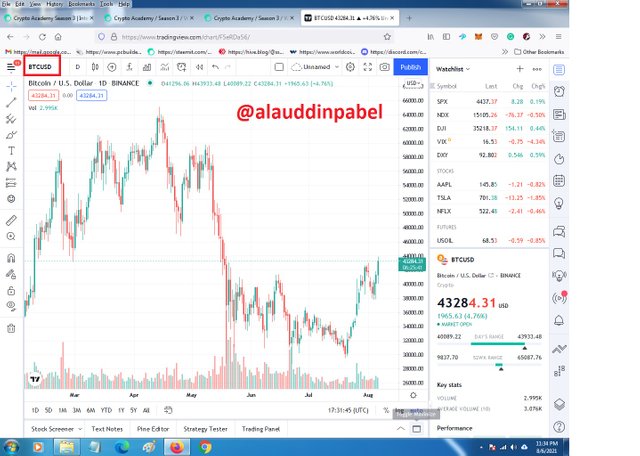
Then four will appear in front of you. I have not decided to use BTC/USD's chat for this exercise. If you want to analyze different chats, you can change them. Here you click on BTC/USD to the left of the chart and search for the pair you want to analyze.
However, next time we need to see the vortex indicator and add it to the chart, we need to click on the "fx" indicator at the top of the chart.
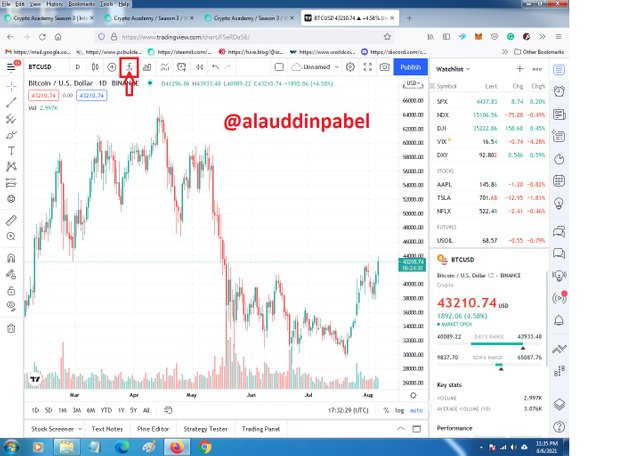
When you click on the "fx" index icon, a pop-up notification will appear immediately.
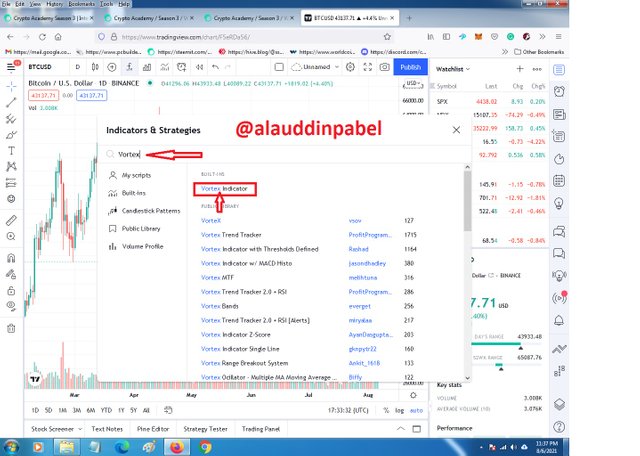
Now clicking on it will add to the vortex indicator chart. Let's go back to the chart and see in the screenshot if it has been added.
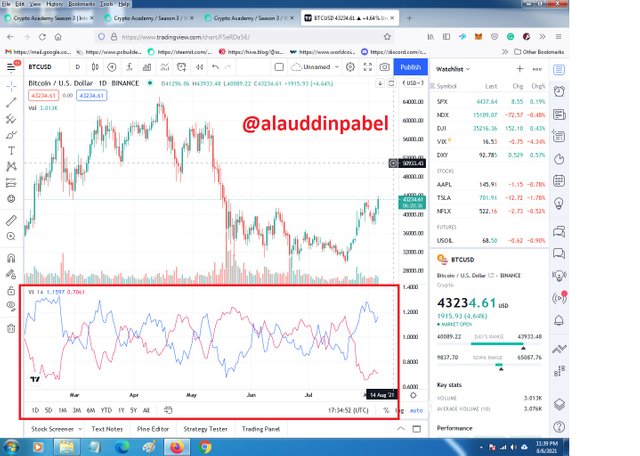
What are the recommended parameters:
So, firstly let's see how to enter its settings: Then, here tap on the "VI" to see more options and click on the settings.
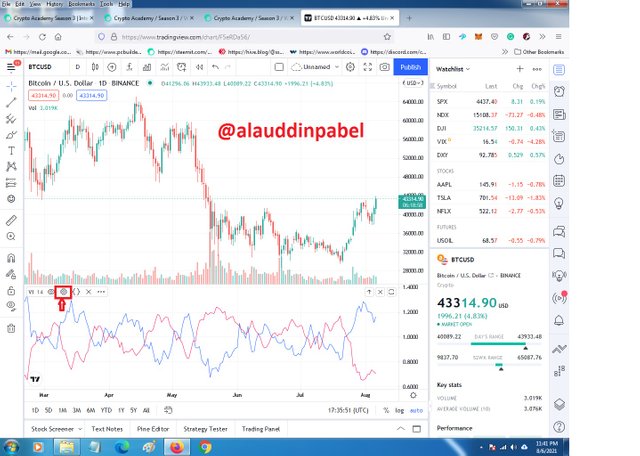
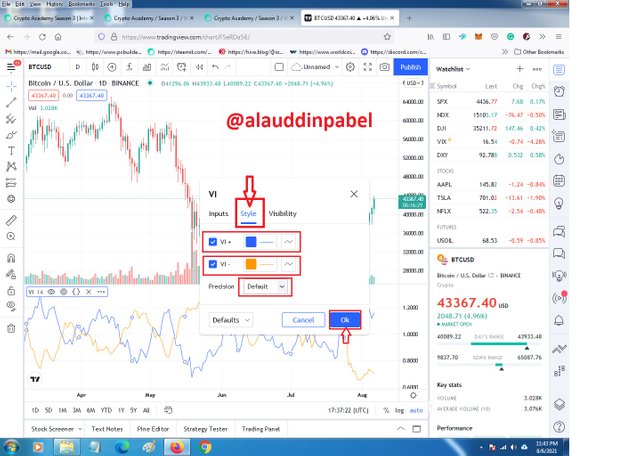
Then in settings on the "Style" tab, we can select the color of the lines of our choice and will put the precision on Default.
Then we will click on the "Input" tab where we will put the Indicator "Timeframe same as Chart" and the "length of our choice" but as usual and the recommended length of it is 14, but we can change to as per the condition and time frame of the market.
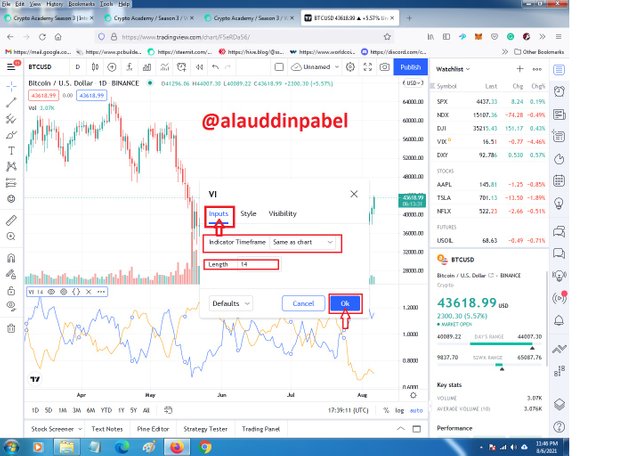
Now, I Will set the Visibility to Default.
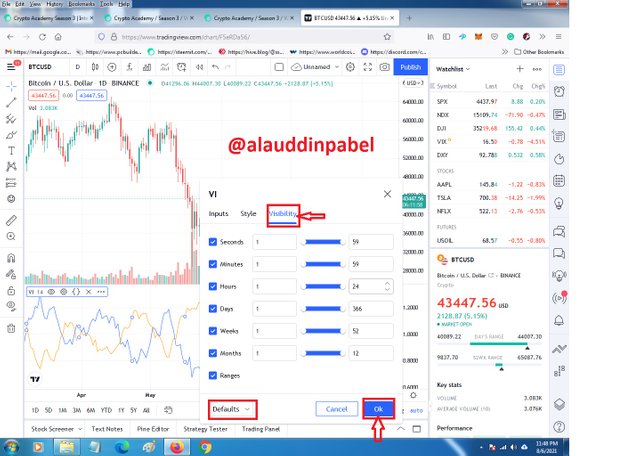
Now, everything is set and perfect then Let's now go back to our chart.
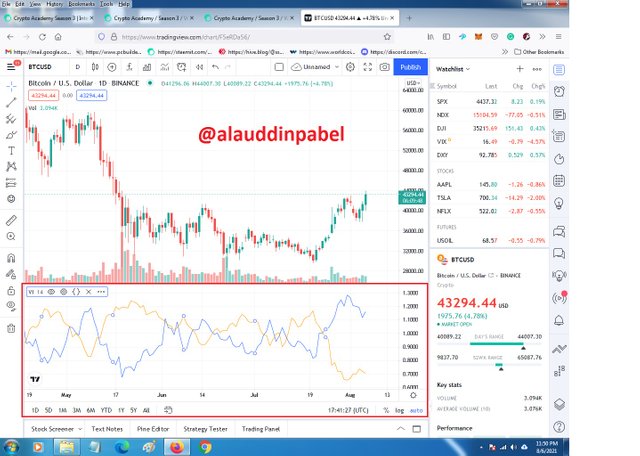
Q4. Explain in your own words the concept of vortex indicator divergence with examples.
divergence is when charts and indicators go in the opposite direction. There are two types of vortex indicators: Bullish divergence and Bearish divergence.
VI+ is the blue line that indicates the positive movement of the market.
And on the other hand VI- is the orange line which signifies the negative effects of the market.
Bullish divergence:
You should keep in mind that Bullish divergence occurs when the VI+ trendline which is the blue line goes higher and the main movement of the chart goes lower, then it is a buy signal for traders.
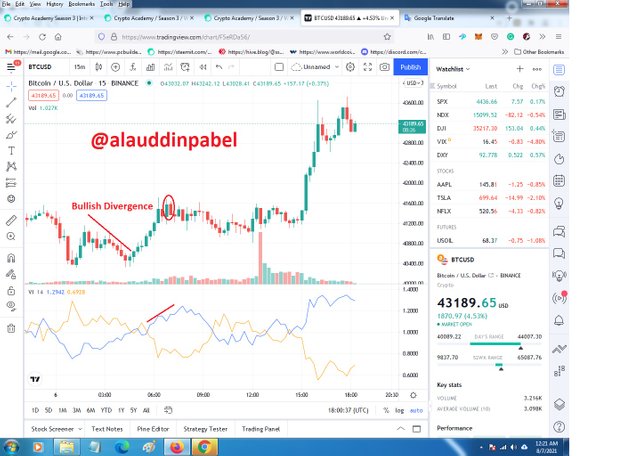
Bearish divergence:
A bearish divergence occurs when the VI- trend line goes down and one day the blue line moves to a lower level when the chat breaks the previous high of the price movement or suppose the main movement rises for a moment and then goes down so it will sell works for traders and it acts as a signal for them.
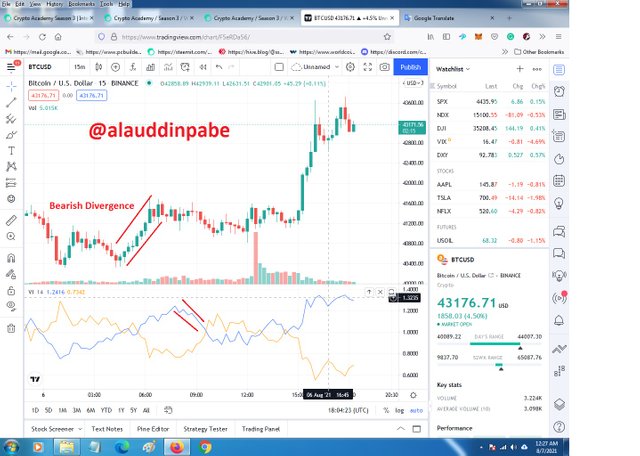
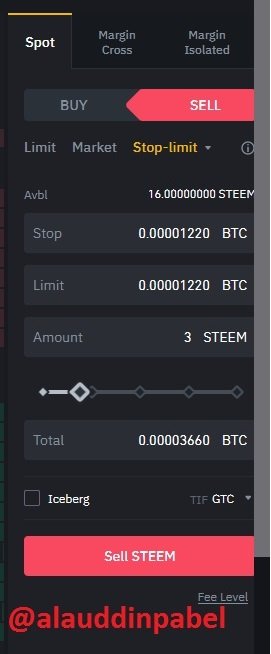
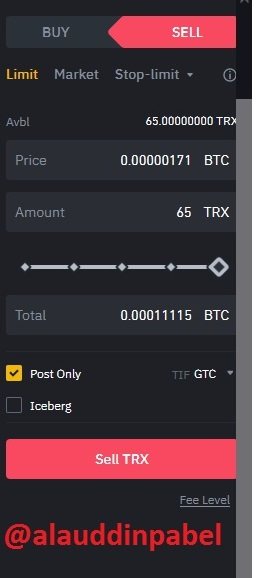
Q5. Use the signals of VI to buy and sell any two cryptocurrencies.
The professor asked you to buy and sell any two cryptocurrencies of the signal of the vortex indicator as requested, so here I present the following two cryptocurrencies to you. The cryptocurrencies are STEEMBTC and TRX BTC.
So first I login to my binance account and I use other cryptocurrency exchanges through this binance account and then I use the assets I wanted to invest. Among them I bought and sold STEEM BTC and TRX BTC and showed you.
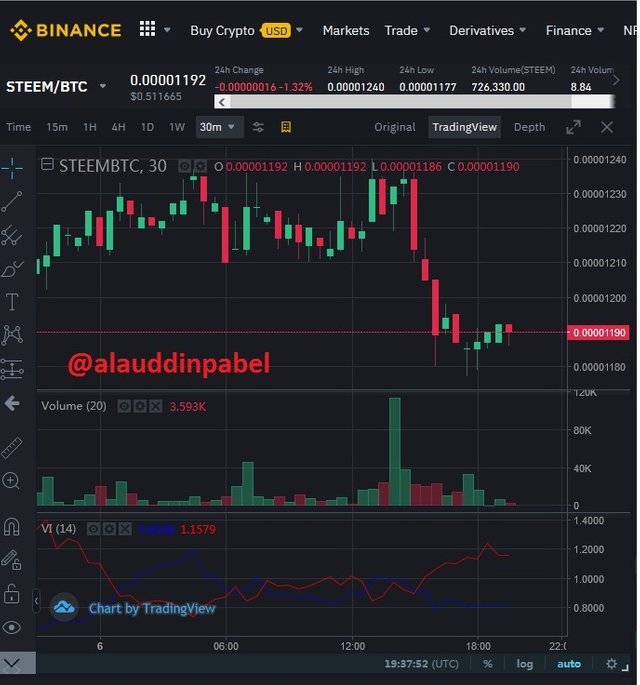
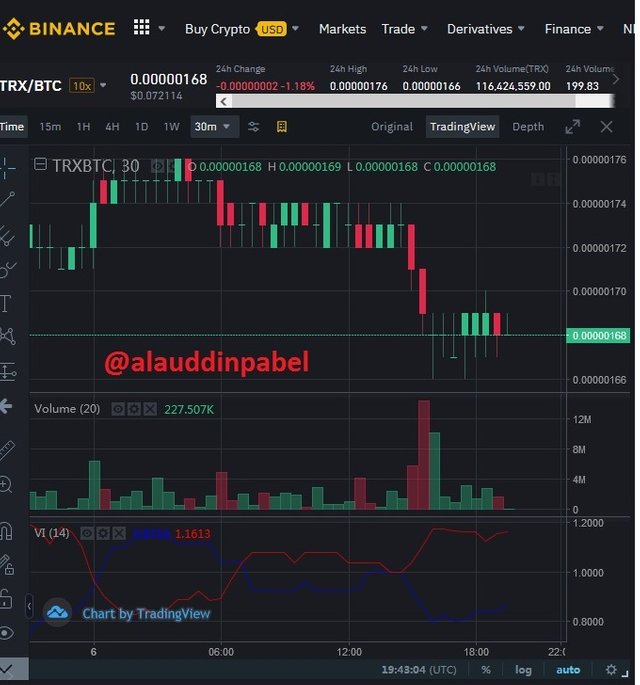
Buy STEEM BTC & TRX BTC
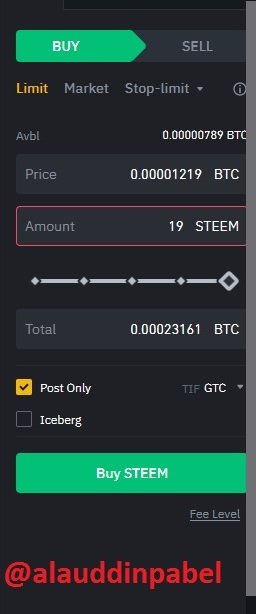
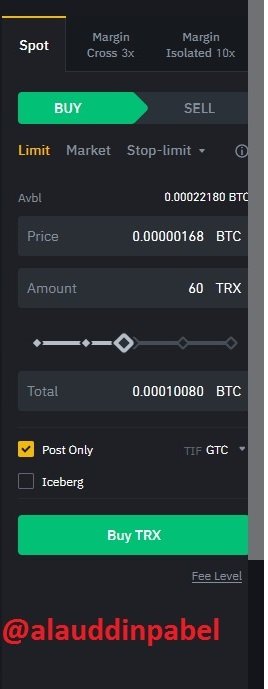

Sell STEEM BTC & TRX BTC

Conclusion:
Eventually the homework task came to an end and as always it was a really interesting homework task and I have learned a lot from here today. The happiest thing is that I had no idea about the Syndicate before that I asked to learn from the post. I believe we can make more profit from this if we invest with a better understanding of the vortex indicators because I personally will work on this indicator in the future. And we will gain more experience on this index so that we can use it to be the best at trading.
Thanks for reading my homework task.
Best Regards
@alauddinpabel
This content appears to be plagiarised as indicated by @asaj
If you have not already done so, you should head to the newcomers community and complete the newcomer achievement programme. Not only will you earn money through upvotes, you will learn about content etiquette;
Notification to community administrators and moderators:
@steemcurator01 ADMIN
@sapwood MOD Professor[Advanced]
@steemcurator02 MOD
Downvoting a post can decrease pending rewards and make it less visible. Common reasons:
Submit