
Homework Tasks :
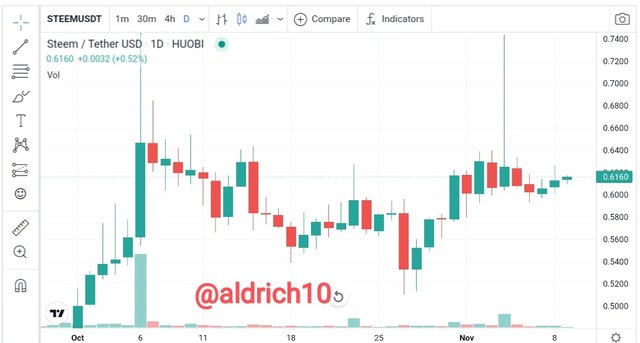
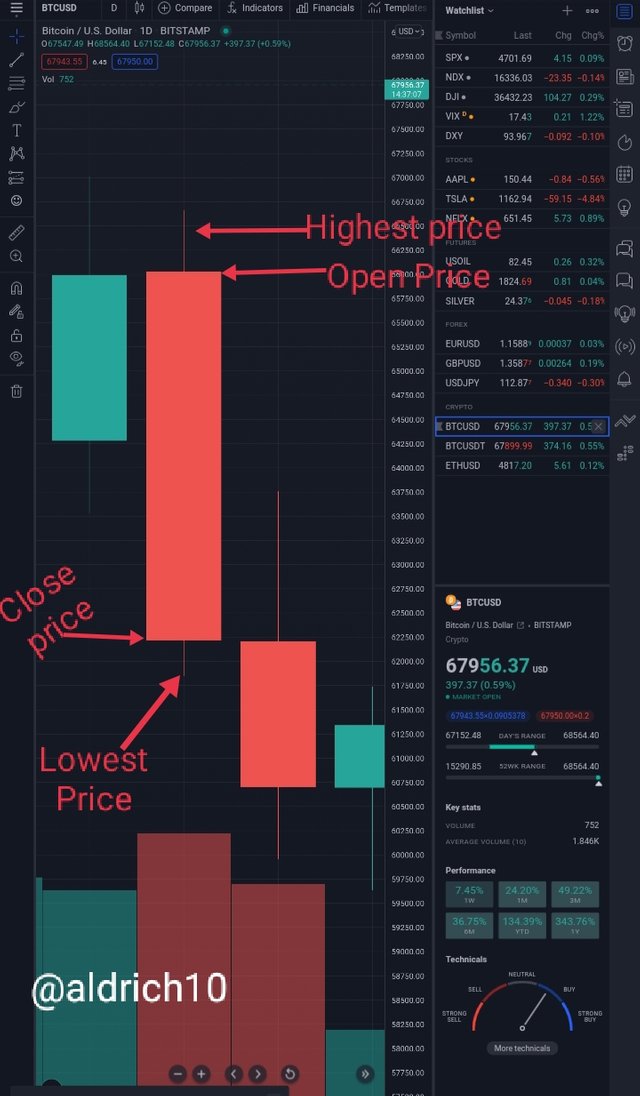
1a) Explain the Japanese candlestick chart? (Original screenshot required).
b) In your own words, explain why the Japanese Candlestick chart is the most used in the financial market.
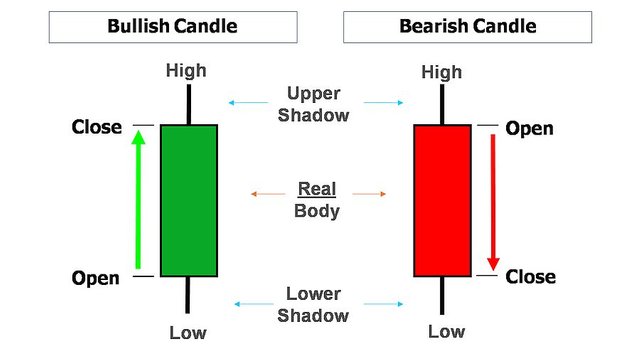
c) Describe a bullish and a bearish candle. Also, explain its anatomy. (Original screenshot required)

Explain the Japanese candlestick chart?

A candlestick is a graphical representation in the form of a candle. This is a special expression that contrasts with the well-known line chart. This candle can be used to analyze the price development of an asset in more detail using some information.
Japanese candlestick charts are based on four indicators: open and close points, high and low prices. Each part of the chart reflects the state of this position indicator in a certain period (time frame). Different types of candles allow traders to define up and down positions. Movements on the chart form typical combinations (patterns) by which traders can predict further price behavior.
Analysis with the Japanese candlestick method is based on the psychological knowledge of market participants. The candlestick chart shows both up and down action, reflecting panic and positive sentiment. Directly, price forecasts are based on patterns of human behavior. To read Japanese candlestick charts, we need to study the main symbols and combinations used in this method, and learn how to mark them on the chart in a timely manner. The details of the chart depend on the timeframe that we specify, for example with a timeframe of 5 minutes, 6 candles will appear on the chart in 30 minutes, with a timeframe of 10 minutes - 3 candles, and so on.
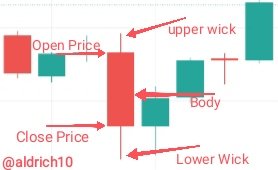
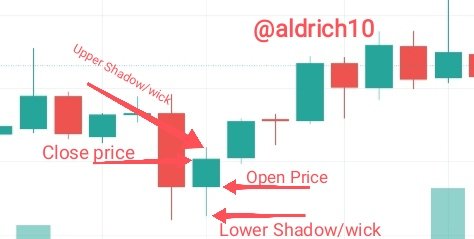
Each candlestick on the chart has a body, an upper shadow (upper axis), and a lower shadow (lower axis). The length of the candlestick shadow reflects the position's maximum and minimum price levels, the limit of the candlestick body's range of opening and closing prices. In the Bearish and bullish candles there are differences in the closing and opening prices, more clearly as in the two pictures above and below.
Depending on the type, the candlestick schematically depicts an increase or decrease in price. At the same time, the shorter the set time interval (the duration of the candlestick action), the more detailed the information presented.
Long candlesticks with short wicks indicate that bulls or bears dominate at this stage (depending on the color of the candle). A short candle body is a sign that the fight between buyers and sellers is almost even.

In your own words, explain why Japanese Candlestick charts are most widely used in financial markets.

Candlesticks are the most popular chart for traders to analyze the market because the presentation of this chart provides more information than the usual line chart in trading. Formation can be adapted to any market (asset) and any time period (in hours). Trading using the candlestick method is one of the most accurate methods in the market as it makes it very easy to find the correct brand and price level in the market.
The reasons why Japanese Candlestick charts are widely used by traders are because:
- Informative
The main advantage of Japanese candlesticks over other methods of graphical analysis is the most detailed display of the market situation. Line charts show only price levels, bar charts show price levels + open and close points. On the other hand, candlestick chart models also show the positions of sellers (bears) and buyers (bulls).
Relevance
In contrast to point-and-figure charts, which are not tied to a timeline, candlestick patterns allow traders to see the smallest changes in the market in real time.Visibility
The color coding of various indicators makes Japanese candlestick charts more descriptive than other chart types. Due to these properties, the candlestick indicator is recommended for use by novice traders.Efficiency
When combined with other technical analysis methods such as trend lines, moving averages and oscillators, Japanese candlesticks provide traders with a complete picture of the market situation. The experience of many generations of investors shows that this method of graphical analysis is the most effective.

Describe a bullish and a bearish candle. Also, explain its anatomy. (Original screenshot required)

The line is a new candlestick that looks neutral at the start. He hasn't moved up or down yet. Traders cannot know for sure what the candlestick looks like.
After the birth of the candle, the battle between the bull and the bear began. If the buyers are stronger, you will see the candle moving up and a bullish candle forming. If the sellers are stronger, you will see the candlestick go down and become bearish.
Each candle is an indicator of who won the battle between the bull and the bear.
* Bullish Candlestick :
A bullish candle means that there is buying pressure in the current market. As long as there are more buyers, the candle will be bullish. If the buying pressure decreases and the selling pressure increases, we will see the bullish candle getting smaller. This indicates a weakening of buyer power.
If the body of the candlestick is large, it is a strong bullish candlestick. If the body is small, it is a weak bullish candle. Candlesticks don't just show us the current price - they tell us that right now the bulls are in control of the situation and there are more buyers in the market than sellers. This is important information.
If your trading strategy gives you a signal to sell, but the candle is clearly bullish, it might be a good idea not to enter the trade just yet. Or wait a while until more sellers appear on the market.
* Bearish Candlestick :
The bearish candles tell us that there is more selling pressure in the market at the moment. As long as there are more sellers, the candle will be bearish. If selling pressure decreases and buying pressure increases, we will see the bearish candle getting smaller. This indicates a weakening of selling power.
If there are more sellers than buyers in the market, going long may not be a good idea.
* Explain its anatomy
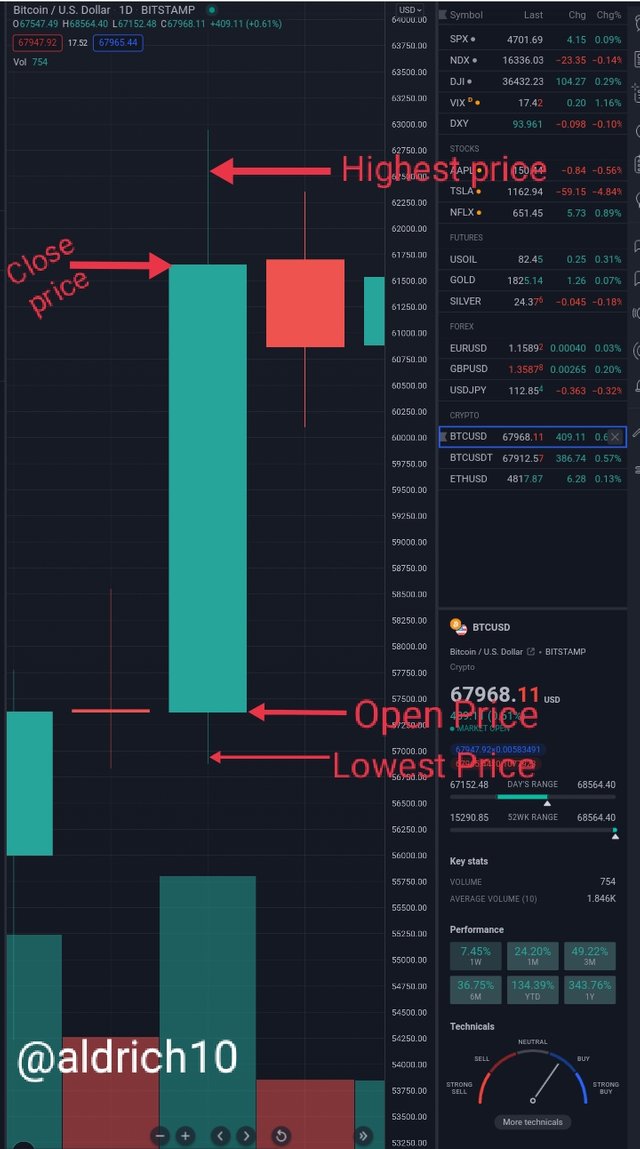
Each candle tells us four facts: opening price, maximum price movement, closing price, and minimum price movement.
A bullish candlestick is formed when the price goes up. In financial markets, the term bullish means long or long positions.
A bearish candlestick is formed when the price drops. In financial markets, the term is bearish for short or sell.
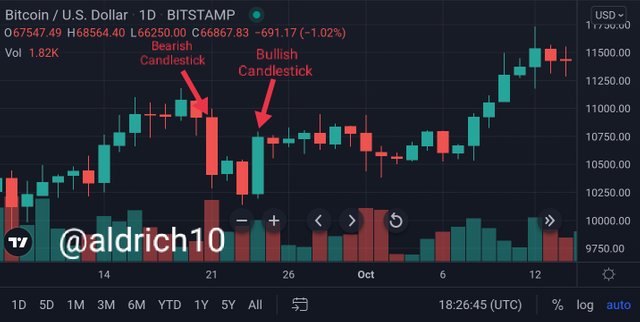
I use BTCUSD on Japanese candlesticks In the picture below I want to show a bullish candlestick and a bearish candlestick.
Downvoting a post can decrease pending rewards and make it less visible. Common reasons:
Submit
#club5050 😀
Downvoting a post can decrease pending rewards and make it less visible. Common reasons:
Submit