Crypto Academy / Season 3 / Week 2 - Homework Post for @cryptokraze | MSB
Definition of Market Structure Break
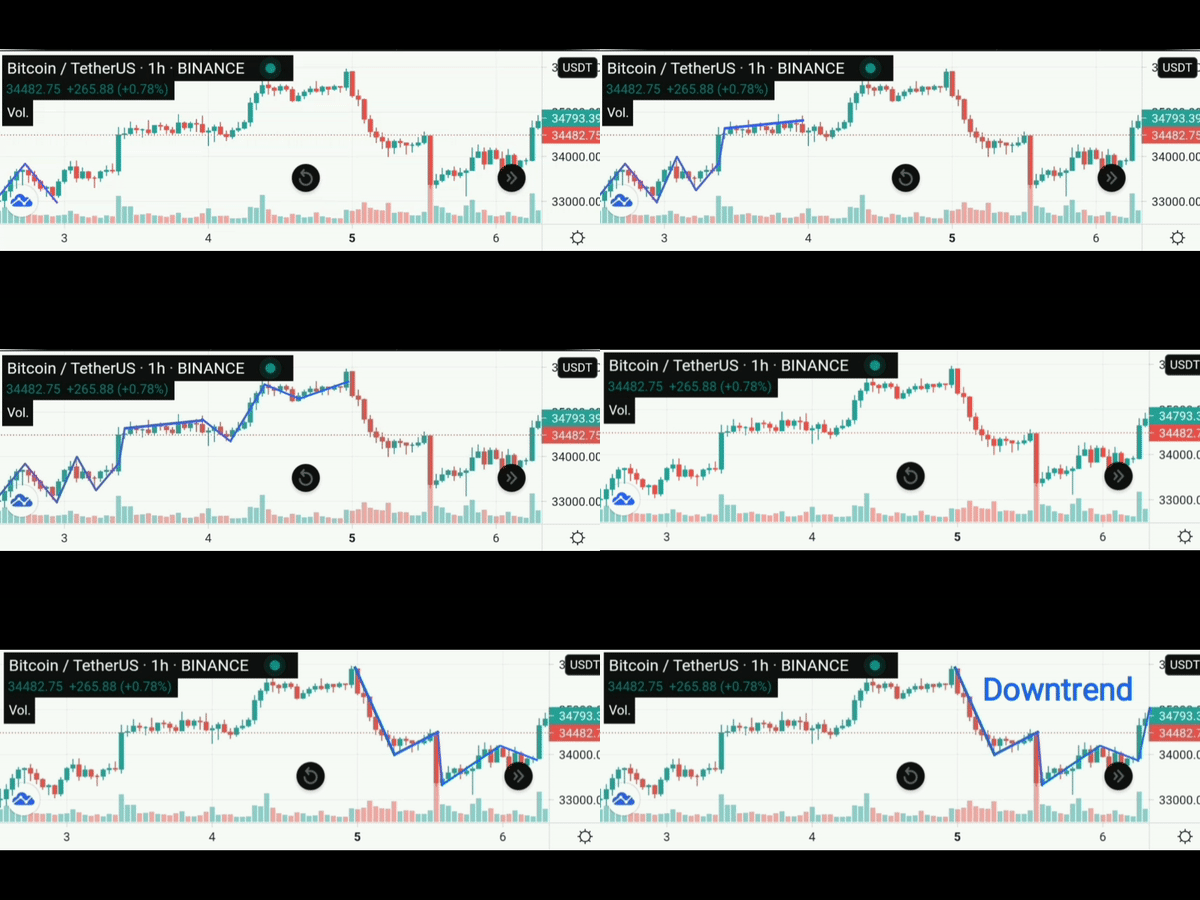
Market Structure Break (MSB), such as the name says itself, it's an excellent strategy trading based on breaking pattern that is usually repetitive according to the psychological behavior that humans take emotionally in front of the money. Consists in the variation of price that gradually goes climbing with several points that are higher or lower than the previous one, depending the up/down trending and then it changes the direction, just like I'm showing in the following gif.🔃
Definition of Higher Low and Lower High
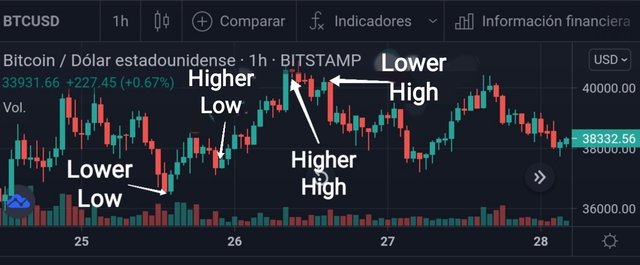
As I stated before, regarding to the psycho aspect, behavior of market follows a predictive direction in certain way and as like everything, there's always a limited point, where buyers sellers interaction burns the current impulse get slower and this is gonna translate in a creation of new point that will take the reversal tendency. Let's see what am I talking about in the following definitions:
📉Lower High: it's the immediate point that is created just after the peak of the chart in an uptrending market and this one is a little lower than the mentioned peak (Higher High) and it will be evidencing a downtrending in the trading space.
📈 Higher Low: the next one after a very low peak (Lower Low) that it's formed from a series of downtrending lower points with alternative slight swings of uptrend and has a higher value than those ones. This indicates the new new direction of the market.
Identification of Trend Reversal early using Market Structure Break
It's necessary to understand clearly the described concepts of Lower High and Higher Low to have success by following closely the direction of price before placing an order and then exit to take profit. There are few stages to take in count to identify early the creation of a new trending in MSB, and those are:
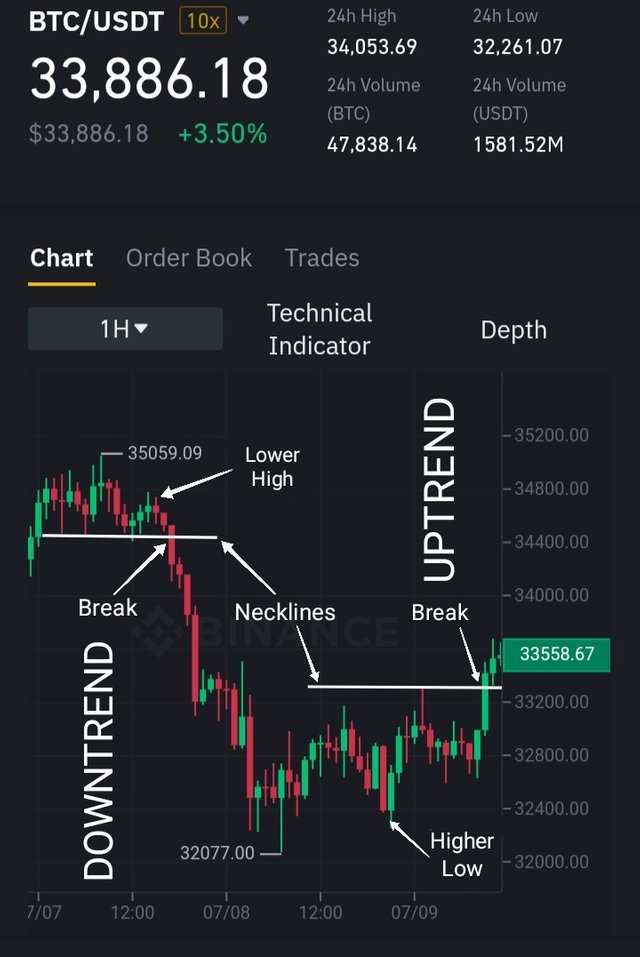
📌Beginning of the reversal: this is the first step carried out by the market once the buyers/sellers interaction is done in certain direction and then they start to trend to the opposite one. For a bullish strength (uptrend), we're talking about the creation of Higher Low or Lower High in bearing one (downtrend).
📌Drawing a neckline: when we notice a higher or lower level that the previous peak, but in this scenario we're not still sure about the change until we confirm it through the intersection of a long or successive candles, towards the desired trending with a referential line projected from the level of a Higher Low/Lower High that will definitely tell us which is the new direction.
📌Breaking of the neckline: this aspect is very important and the definite one to be with enough guarantee of the new direction. This usually occurs when there's a sudden change of price translated in long/successive candles that will surpasse the level of breaking and confirm the obvious reversal of new trending.
In summary, we'll be understanding better these conditions through this table:
| Condition | Downtrend | Uptrend |
|---|---|---|
| Ceated point | Lower High | Higher Low |
| Breaked candles | Red | Green |
Trade Entry and Exit Criteria Steps
📌After a series of higher or lower points, there must be a formation of an opposite new one (Higher Low/Lower High) that will indicate us the reversal of the market.
📌Draw the neckline at the base of the opposite point level that would be the entry order by crossing the evident candle of new direction.
📌Once this occurs, the exit will take in count the Risk/Reward ratio (RR) that is usually like 1:1, 1:2, etc... and where the stop loss should be located under the Higher Low value (for bullish) or above the Lower High point (for bearing) and the profit will be at the desired direction and calculated according to the chosen RR.
Demo trades on crypto assets using Market Structure Break Strategy.
🔺Long position example:
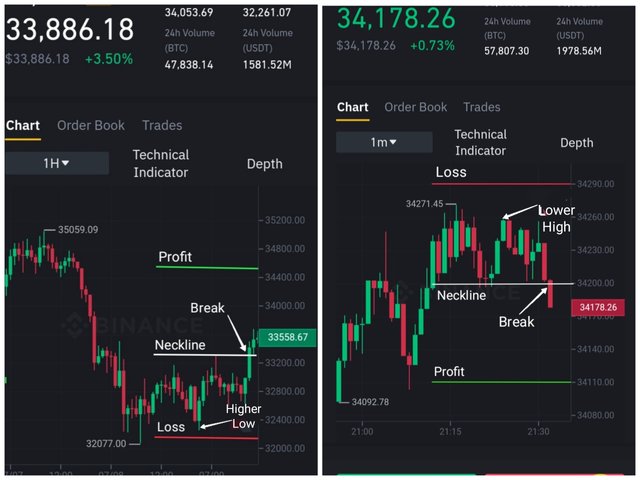
~In the BTC/USDT pair of Binance exchange for the 1 minute frame, I've noticed a formation of a Higher Low after a successive serie of lower peaks. In this point, I draw the neckline at the 33785 level price in order to wait until the MBS and then buy in 33790. Once this took place, I set 33700 as stop loss and 33880 as profit for a 1:1 RR, so I can wait for the future trend.
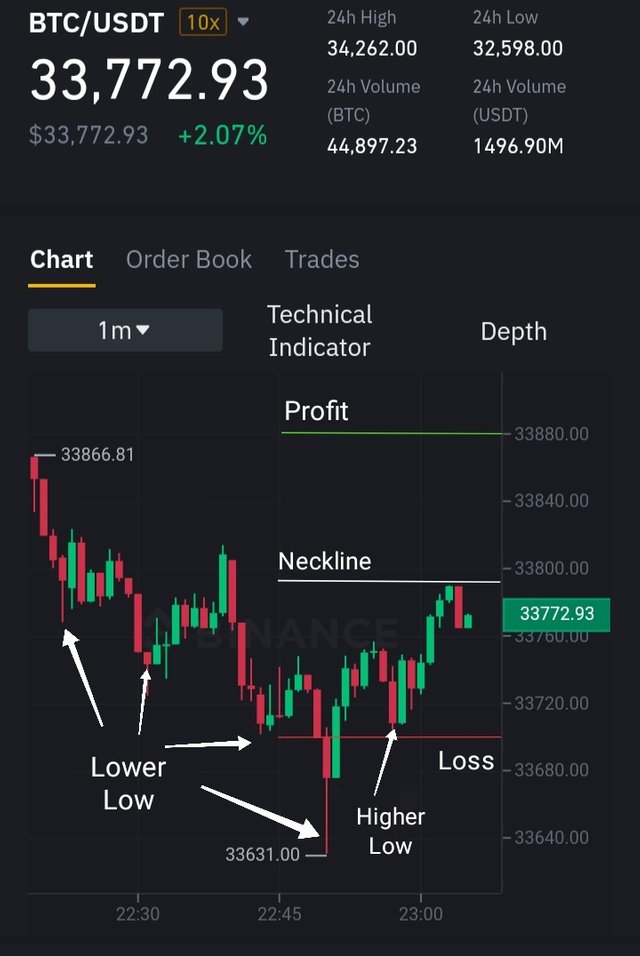
~Finally, as you can check in the screenshot, prediction was successful with my sell exit at the mentioned price of 33880.
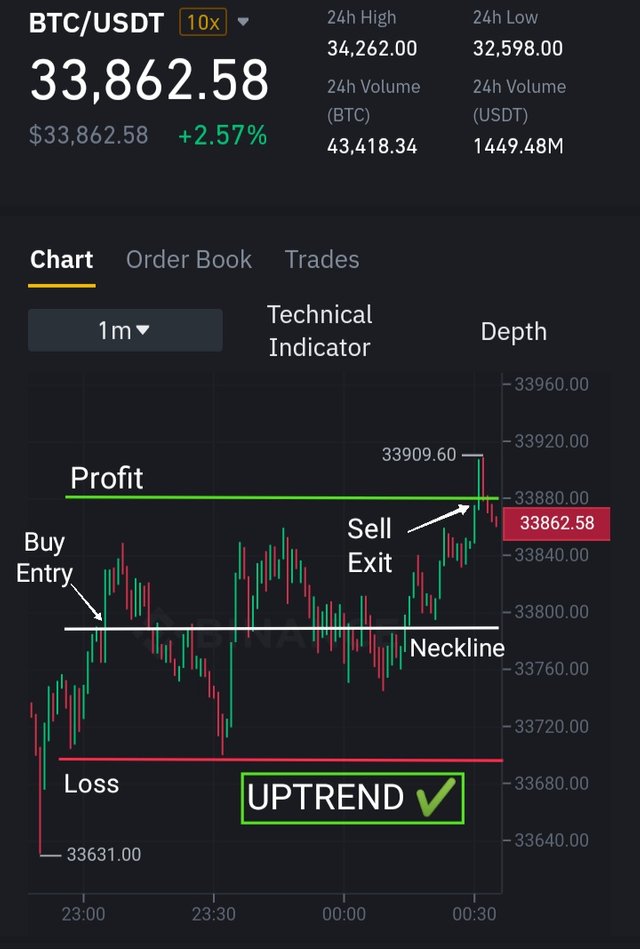
~Here you are the buy entry and sell exit for this demonstration with a 1:1 RR.
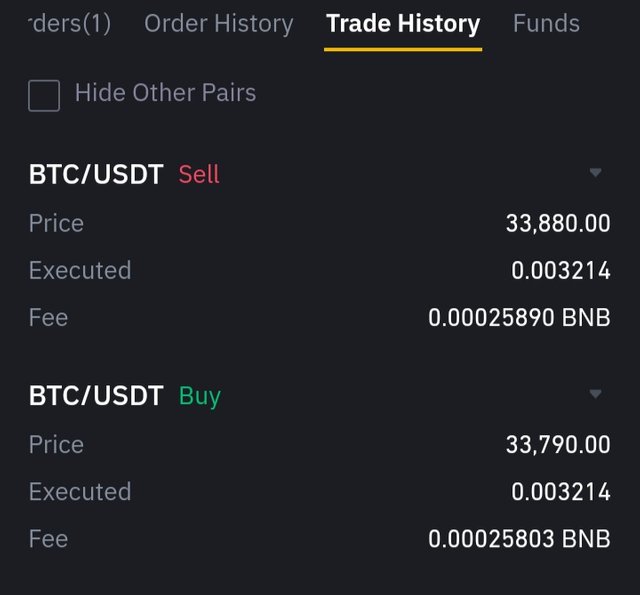
🔺 Short position example:
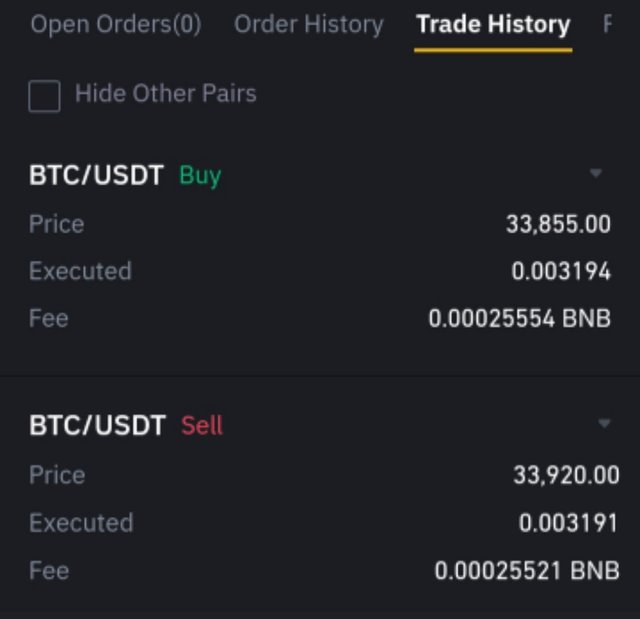
~With the same pair of BTC/USDT in Binance exchange for the 1 minute frame too, there was a Lower High after a successive serie of higher peaks, so I could draw the neckline for 33925 that was finally breaked and I sold at 33920 and took my profit of 33855 from the settled level of 33870. Fortunately, price never reached the stop loss of 33980.
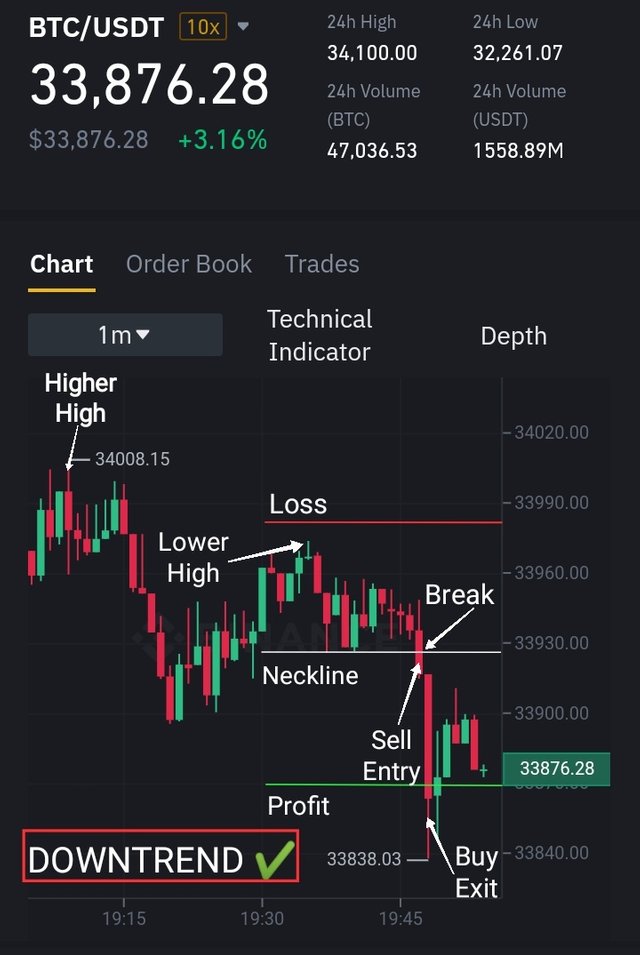
~Here you are the sell entry and buy exit for this demonstration with a 1:1 RR.
👷🏻♀️>>~•Alegn@•~>🎶
*** See you in next post *** 📝
Congratulations, your post has been upvoted by @scilwa, which is a curating account for @R2cornell's Discord Community. We can also be found on our hive community & peakd as well as on my Discord Server
Downvoting a post can decrease pending rewards and make it less visible. Common reasons:
Submit
Thanks a lot for the curation vote. I appreciate such aim you showed to my article. Regards from my part. Have a great starting of the week. #venezuela #affable
Downvoting a post can decrease pending rewards and make it less visible. Common reasons:
Submit