Vortex indicator and how it is calculated. Is it reliable?
The Vortex indicator it's one of the most recent tools to use in trading created by Etienne Botes and Douglas Slepman in 2010, based the studies of J. Welles Wilder, the invertor of RSI indicator.
Consists in two oscillator lines (positive in blue and negative in red) that will tell us which trending is leading the space by presenting a huge strength over the other one: that is, If blue line is over the red one we're experimenting a bullish market (+VI) and for the contrary, a bearish market when red line is over the blue one (-VI).
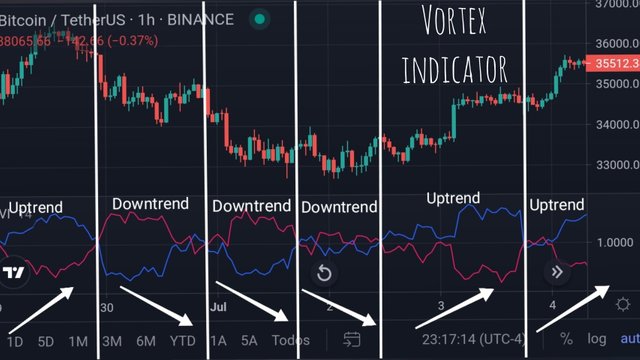
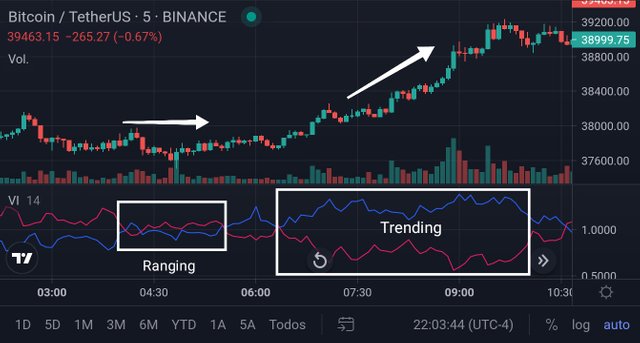
In comparation, Vortex indicator shows the market movements as a scene of water's whirlwinds. The more turbulent it is, the more vortexes we'll be getting on there, so that's why the name. Or, when the water is in calm status, vortexes are barely starting to get out, so lines are not so wide at the chart. Notice a bigger area between lines during a wider change of price, meanwhile we have a smaller one during a ranging of market, translated by a minor amount of volume compared to the first scene.
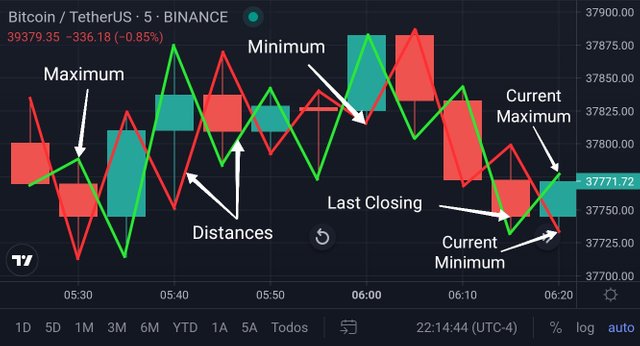
The calculation of line's vortex indicator is based on the maximum and minimum of every candlestick in a determined period of time by taking in count the following statements:
🔵Positive line is calculated 'n' times by substraction between the recent minimum and the current maximum. The more distance the more positive is this trending side.
🔴Negative line is calculated 'n' times by substraction between the recent maximum and the current minimum. The more distance the more negative is this trending side.
True Range is the greatest absolute value of one of these, which is calculated 'n' times to use it in the Vortex formula:
~Current Maximum - Current Minimum
~Current Maximum - Previous Closing
~Current Minimum - Previous Closing
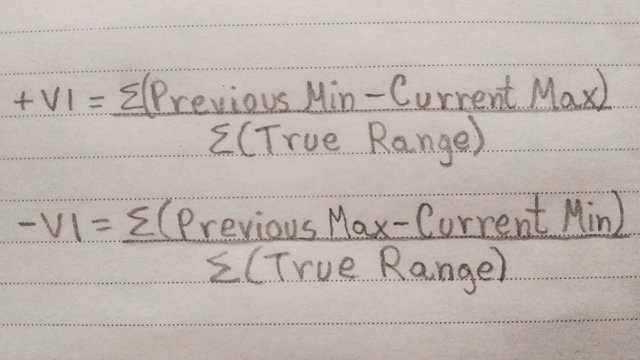
Finally, you have to obtain separately the sum of positive and negative distances and then divide each one by the summative of True Range for 'n' periods in order to get respectively +VI and -VI.
At the same time, this indicator will confirm us the instant of a reversal trending for a good buy/sell entry through the crossing between these lines, although we've to filter carefully these signals. So, not always is reliable because by itself might provide fake signals, specially during consolidation of behavior or sudden pullbacks that makes oscillations very sensitive. So, it's advisable (just after the crossing) to wait for a simultaneous >1.1/<0.9 values for both lines that will drive them respectively to the overbought or oversold zone and combine it with MACD indicator (in default parameters) and setting an adequate length of periods, so we'll be seeing how to do it.
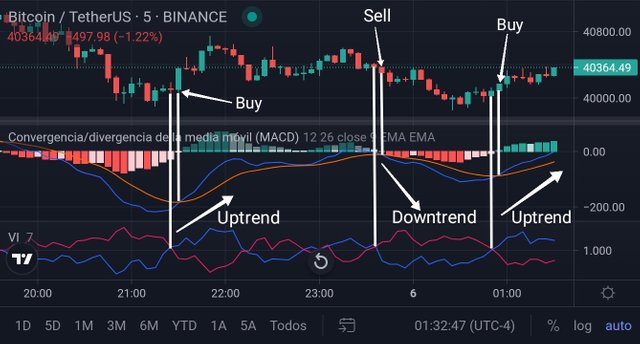
Adding the indicator and recommend parameters
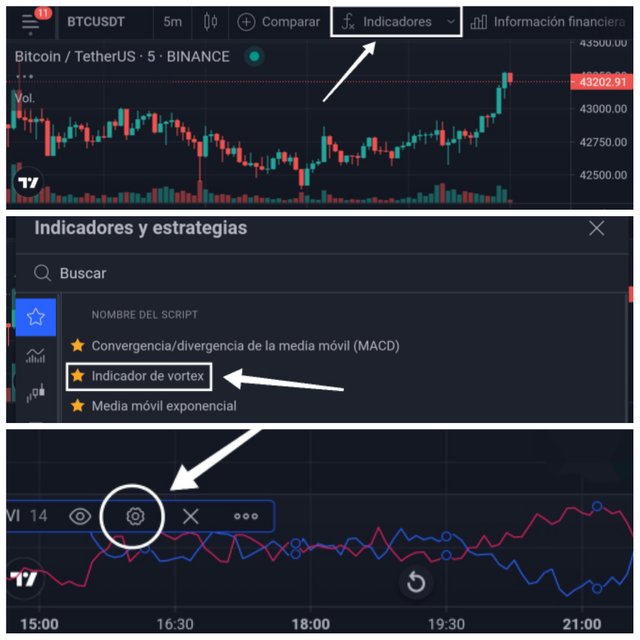
Standing at the TradingView website and after making click on the indicator button to display the available options, let's select the Vortex indicator that is also known as VI. Make click over the parameter's icon of this indicator that it was displayed below the chart.
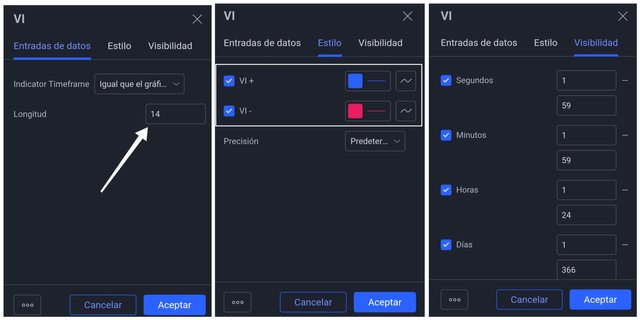
Now we can set the length of 'n' periods in the input data. Change the colors and precision in style tab if you wish to and make sure that visibility options are correct.
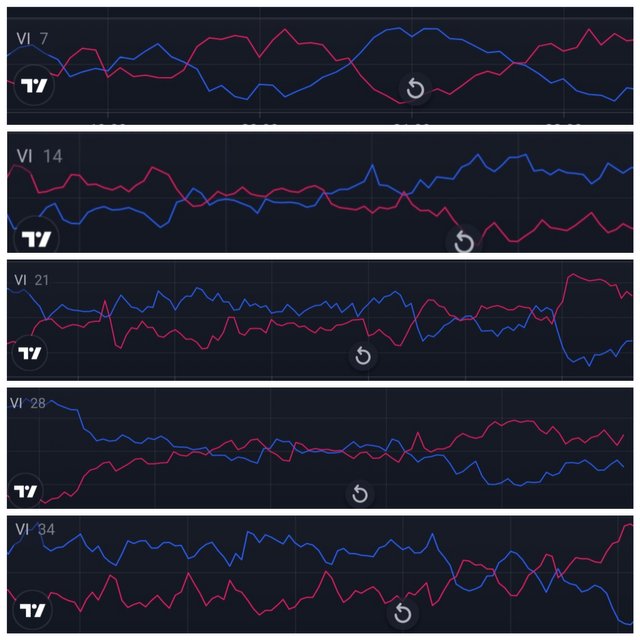
The proper length for every time frame is crucial at this point, depending of the trader's necessities. The shorter length we set, the more crosses we'll be obtaining although with more fake signals. The against case with the longer length, we'll get less crossings between lines but the great advantage is less sensitive (volatile) in front of pullbacks. As a parallel aspect, this is also applied for the different timeframes to set in exchanges: In a lower one like 5 minutes for instance, it's useful to set a higher length of 21 to 34 to avoid false indications. Also, for normal conditions of market, it's great to use a number period of 7 meanwhile you must use 14-28 for ranging condition in the market.
vortex indicator divergence with examples
By divergence we can understand it as an opposite behavior between the trending direction and the parameter of indicator, the +VI line in this case. What I'm trying to explain with this, is:
🐂 Bullish divergence: We're seeing an uptrending positive line and downtrending negative line when market is on downtrending movement. Notice the raising of price just after this occurs in the chart. In other words, there's a bullish trend as consequence.
🐻 Bearish divergence: We're seeing a downtrending positive line and uptrending negative line when market is on uptrending movement. Notice the falling of price just after this occurs in the chart. In other words, there's a bearish trend as consequence.
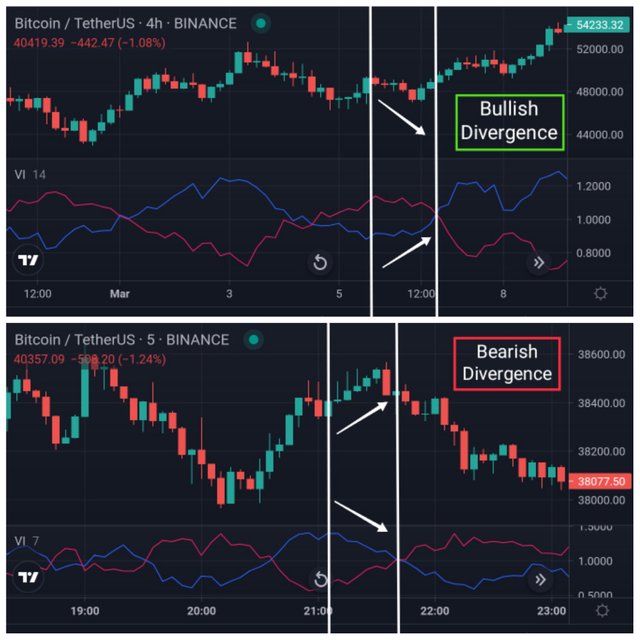
Using the signals of VI to buy and sell cryptocurrencies
Take a look at the respective longer time frame (1day, 4hours, 30 minutes, etc.) to determine how's the general asset's trending. Then, see at the shorter time frame (1, 3, 5 or 15 minutes) in order to enter and exit from the market at the same direction of general wider time frame. Select MACD indicator with default parameters and Vortex indicator with the needed length, then follow these steps:
🔺For a Buy Entry
After a bearish trend, open a buy order when both Vortex's lines get crossed with +VI being above -VI, reaching at least the values of >1.1 for the positive line/<0.9 for the negative line and MACD indicator also being matched in its lines by few candles away from the Vortex cross.
As example, at the ranging market of Binance's BTC-USDT pair (15m timeframe), I set a length of 14 in VI and used the MACD parameters as default. I had an initial crossing from the Vortex's lines and few candles later MACD lines did the same. Blue lines from both indicators are getting above the red ones and the values of 1.1374>1.1 (for +VI), plus 0.7877<0.9 (for -VI) has created the last confirmation to place a buy order in 42.882,05 USDT per BTC. As final result, I obtained an expected uptrending behavior, so the entry wasn't invalidated.
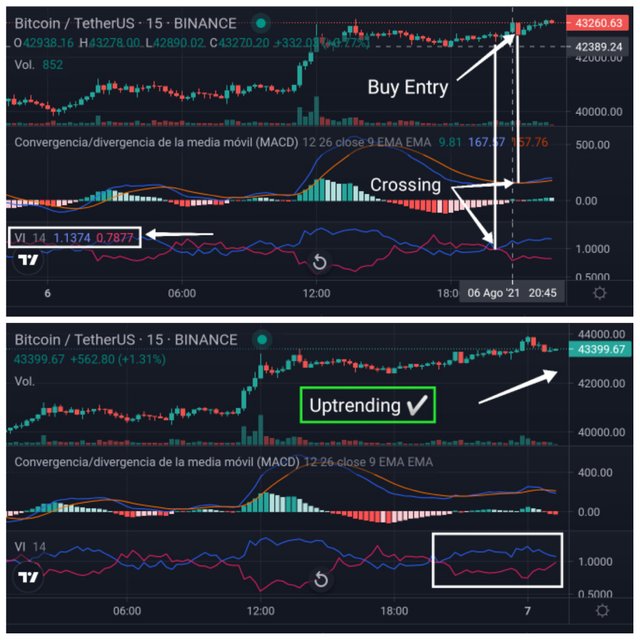
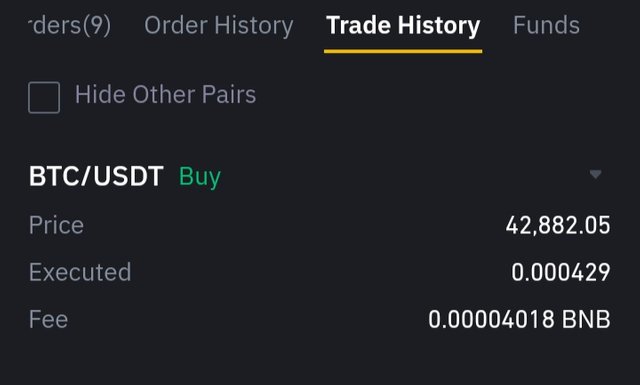
🔺For a Sell Entry
After a bullish trend, open a sell order when both Vortex's lines get crossed with +VI being below -VI, reaching at least the values of >1.1 for the negative line/<0.9 for the positive line and MACD indicator also being matched in its lines by few candles away from the Vortex cross.
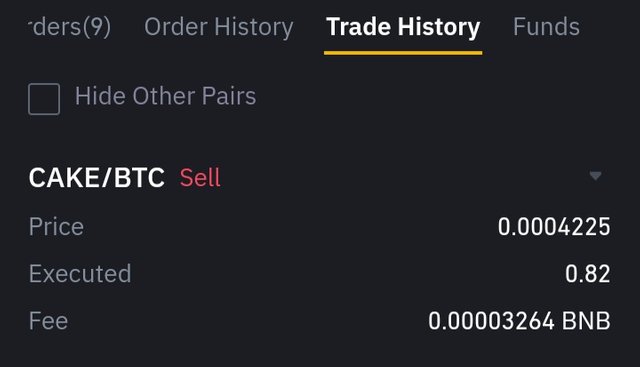
As example, at the ranging market of Binance's CAKE-BTC pair (5m timeframe), I set a length of 14 in VI and used the MACD parameters as default. I had an initial crossing from the Vortex and MACD lines at the same time. Blue lines from both indicators are getting below the red ones and the values of 1.1078>1.1 (for -VI), plus 0.8503<0.9 (for +VI) has created the last confirmation to place a buy order in 0.0004225 BTC per CAKE. As final result, I obtained an expected downtrending behavior, so the entry wasn't invalidated.
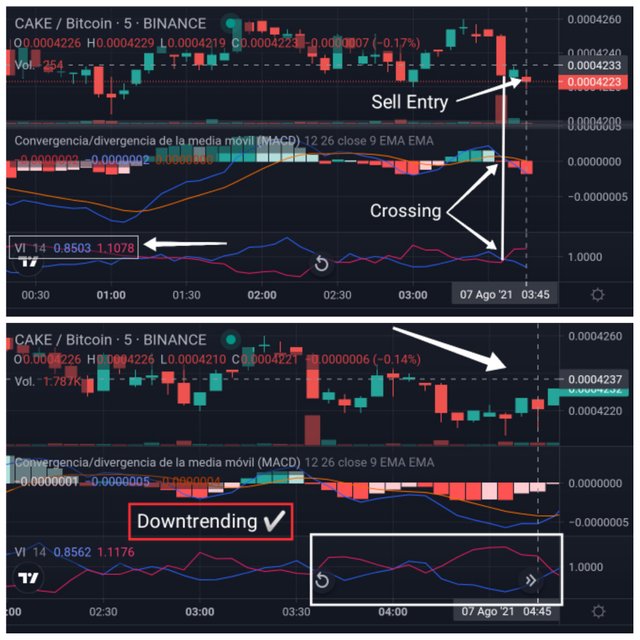
👷🏻♀️>>~•Alegn@•~>🎶
*** See you in next post *** 📝
Good job @alegnita!
Thanks for performing the above task in the sixth week of Steemit Crypto Academy Season 3. The time and effort put into this work is appreciated. Hence, you have scored 6.5 out of 10. Here are the details:
Remarks
You displayed a good understanding of the topic.
Downvoting a post can decrease pending rewards and make it less visible. Common reasons:
Submit
Thank you professor @asaj for your grade. I really liked the lecture and learned something new and useful for my future trades. Have a great day. #venezuela #affable
Downvoting a post can decrease pending rewards and make it less visible. Common reasons:
Submit