Hello everyone once again hope you all are fine and safe. Today i attend one more lecture given by professor @kouba01 regarding Chaikin Money Flow Indicator. Now i am going to submit my homework post for this lecture. Let's start
In your own words, give a simplified explanation of the CMF indicator with an example of how to calculate its value?
At this time there are lot of people investing in Crypto. For gaining good profit and less loss traders should have proper knowledge and information. For this purpose every trader should know about every indicator that will help trader in trading. Also we know have enough knowledge about coin in which we are investing. we have learn lot of indicators with the help of Crypto academy. Today we learn about Chaikin Money Flow Indicator.
As we know the price of any coin in Crypto market mostly depends on the money flow in that coin. By knowing the money flow in any coin we can predict what will happen to the price of that coin wheather it will go up or wheather it will go down. As we know when there is high buying pressure that means lot of people are buying that coin it's value will increase also if there is high selling pressure that means lot of people are selling coins and then its value will decrease. Chaikin Money Flow Indicator that about the money flow If this indicator tells us there is high buying it gives us a buy signal and if it tells high selling that means it is giving sell signal.
Chaikin Money Flow Indicator is developed by Marc Chaikin . Chaikin Money Flow Indicator is used to measure the money flow volume during a specific period of time. It is used to measure the buying and selling pressure of any coin. CMF indicator tells above information for a single period and then sums money volume over a definite look back time that time may be 20 or 21 depends on trader. The CMF indicator is displayed with line just like other indicators. The CMF indicator line moves in the range of 1 and -1 the middle valye is zero.Chaikin Money Flow Indicator works on the principal that if the closing price is near to the recent high that means more accumulation takes place and if the closing price is near to the recent low that means more distribution taken place.
Now we know the line of CMF indicator moves between -1 and 1 from this we get signals for selling and buying and seeing money flow in the particular asset. If the line crosses the zero line and moves towards 1 that tells us that there is increase in buying that means this is buy signal on the other hand if this line moves below zero and moves towards -1 that tells there is increase in selling and after that we will see price fall so this is sell signal. If the line is at zero that time it is difficult to get any signal from this indicator so better is use this indicator with other indicator for better results.
How to calculate its value?
Calculation of CMF indicator is done in three steps or by using the below three formulas:
- First calculate the money flow multiplier by using below formula:
Money flow multiplier= [ ( close price- low price) - (High price - close price)] / (High - Low)
- Now calculate the money flow volume by using money flow multiplier by using below formula:
Money flow volume= Money flow multiplier × volume for the period
- Now calculate the Chaikin Money Flow by using below formula:
CMF = some of money flow volume/ sum of volume
The time period is set by trader the best used time period is 20 or 21.
Lets see one example for better understand:
Lets take few values vales and then calculate CMF:
Recent high: 60 dollars
Recent low: 40 dollars
Closing price: 56
Volume of period: 100000 dollars
Sum of volume for period: 200000 dollars
Now lets calculate by using above formulas:
Money flow multiplier= [ ( 56- 40) - (60 - 56)] / (60 - 40)
= (16-4)/20
= 12/20
=0.6Money flow volume = 0.6× 100000
= 60000Now Chaikin Money Flow= 60000/200000
= +0.2
This means that the CMF line is above zero value and tells high buying pressure and gives buy signal.
Demonstrate how to add the indicator to the chart on a platform other than the tradingview, highlighting how to modify the settings of the period(best setting).(screenshot required)
For this question i will use poloniex trading platform:
- First login to your poloniex wallet.

- Now click on trade option on the top and then click on spot option after that charts will appear.


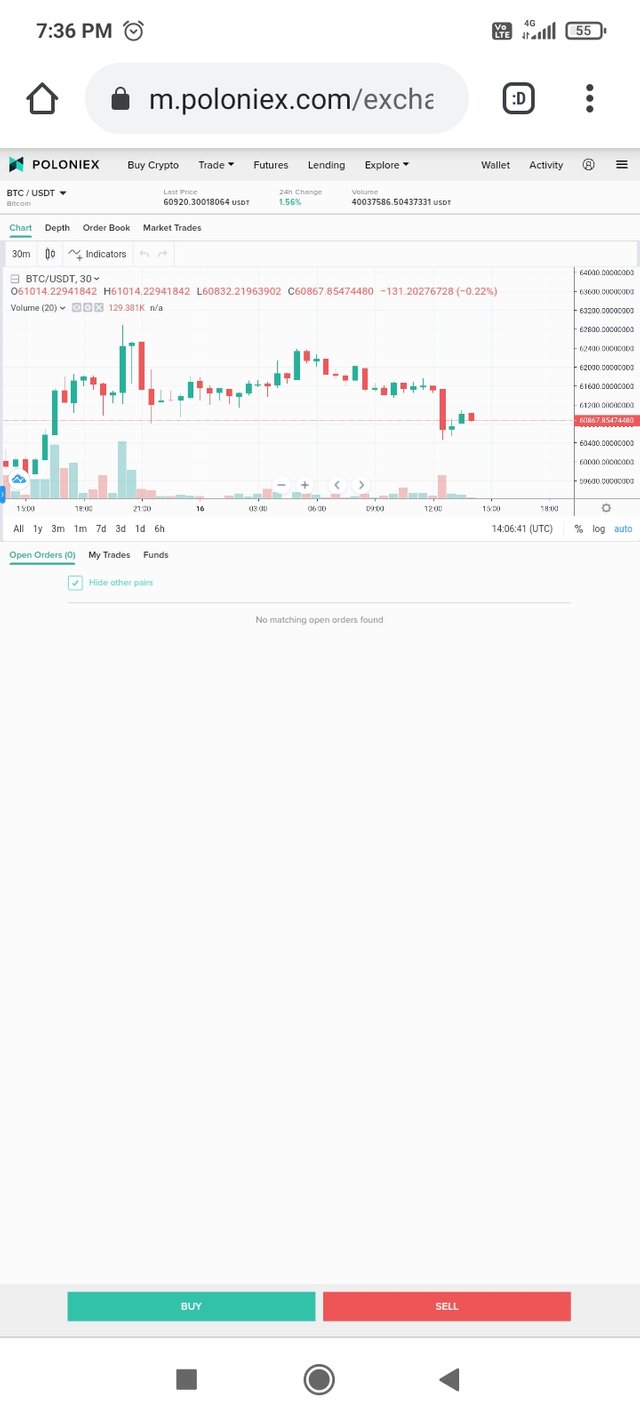
- Now select the coin of which you want to see indiactor.i am selecting xrp coin
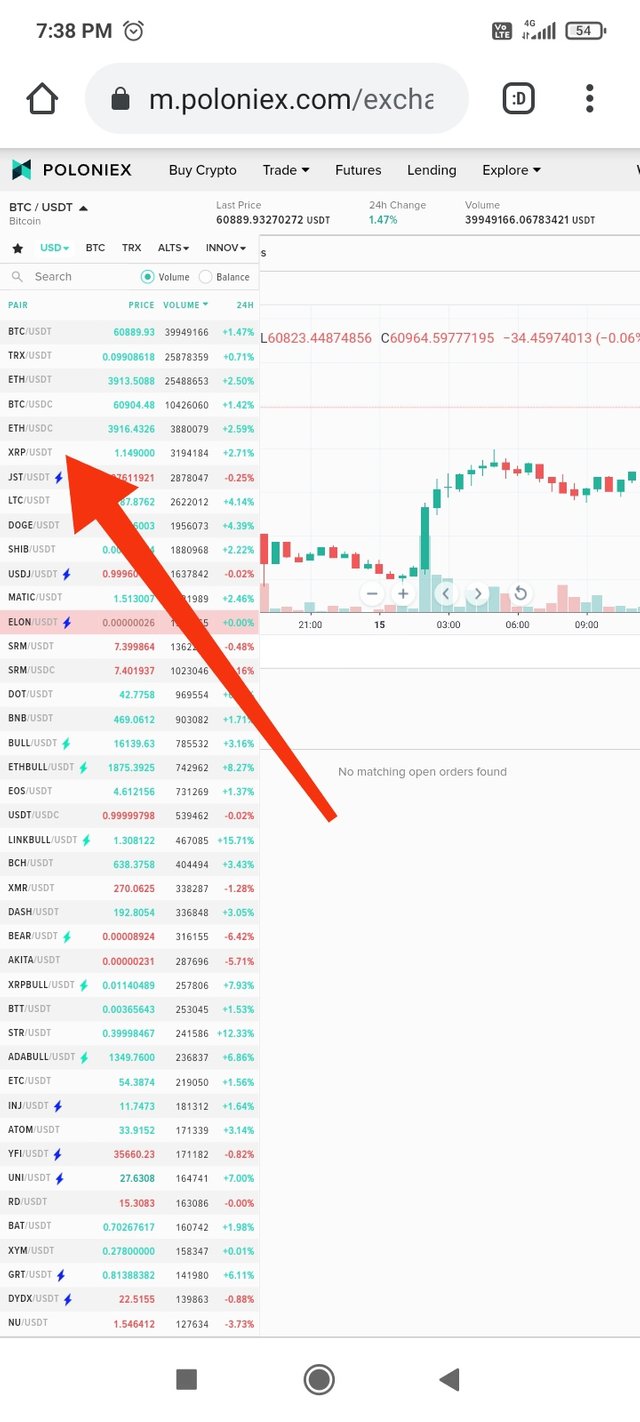
- Now click on indicators tab on left top side.
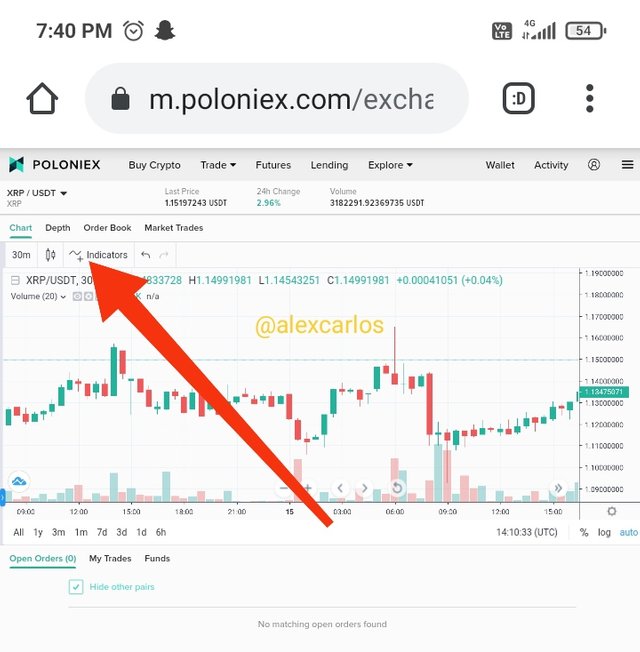
- Search the Chaikin Money Flow Indicator and click on it.
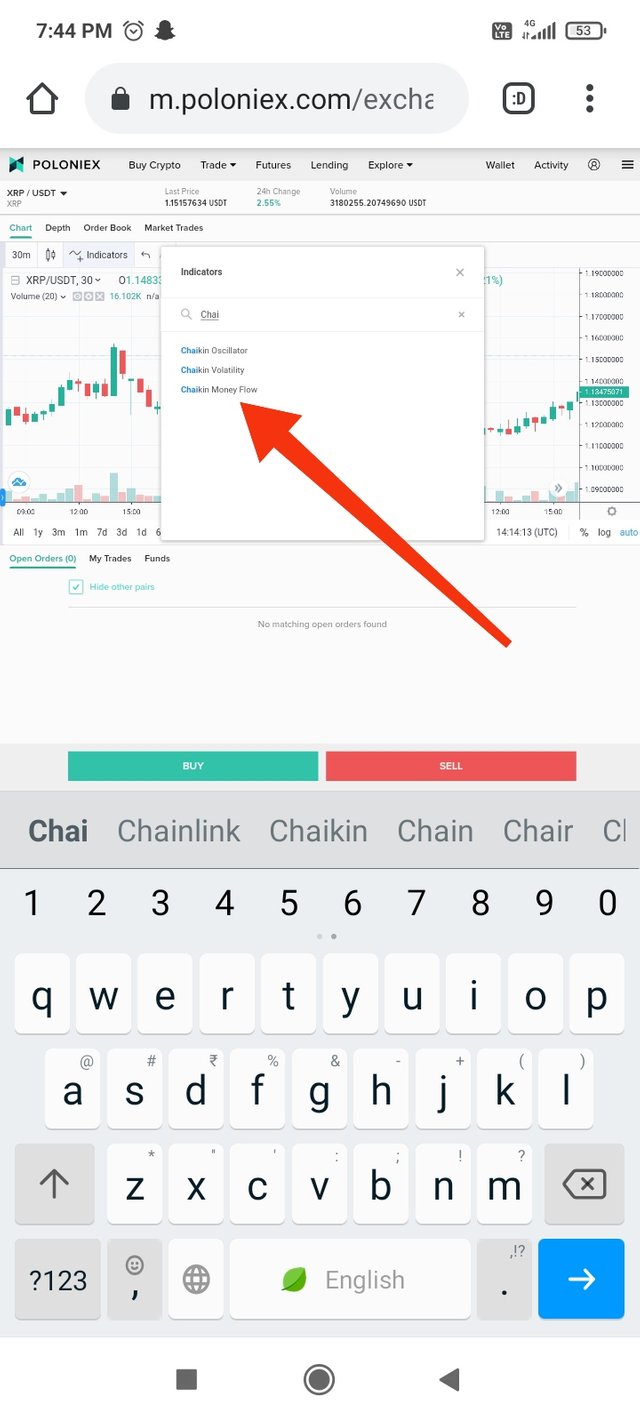
- You can see below the Chaikin Money Flow Indicator has been added successfully
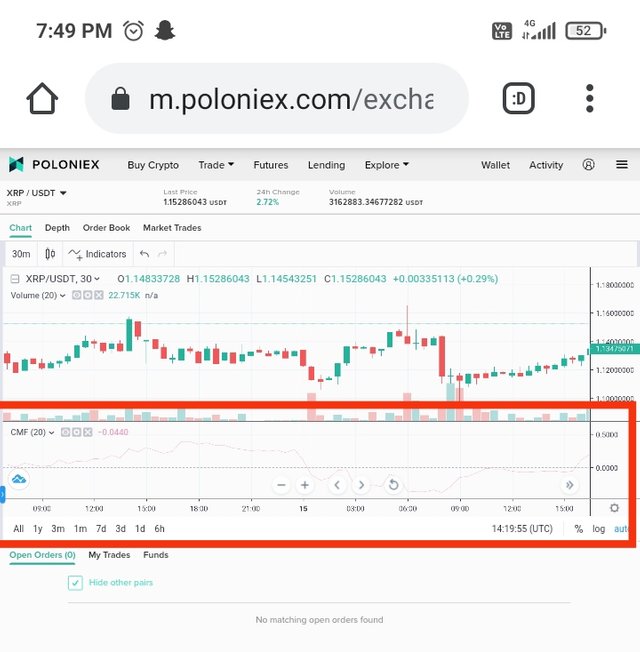
How to modify the settings of the period(best setting)
- For modifying the setting of this indiactor first click on setting
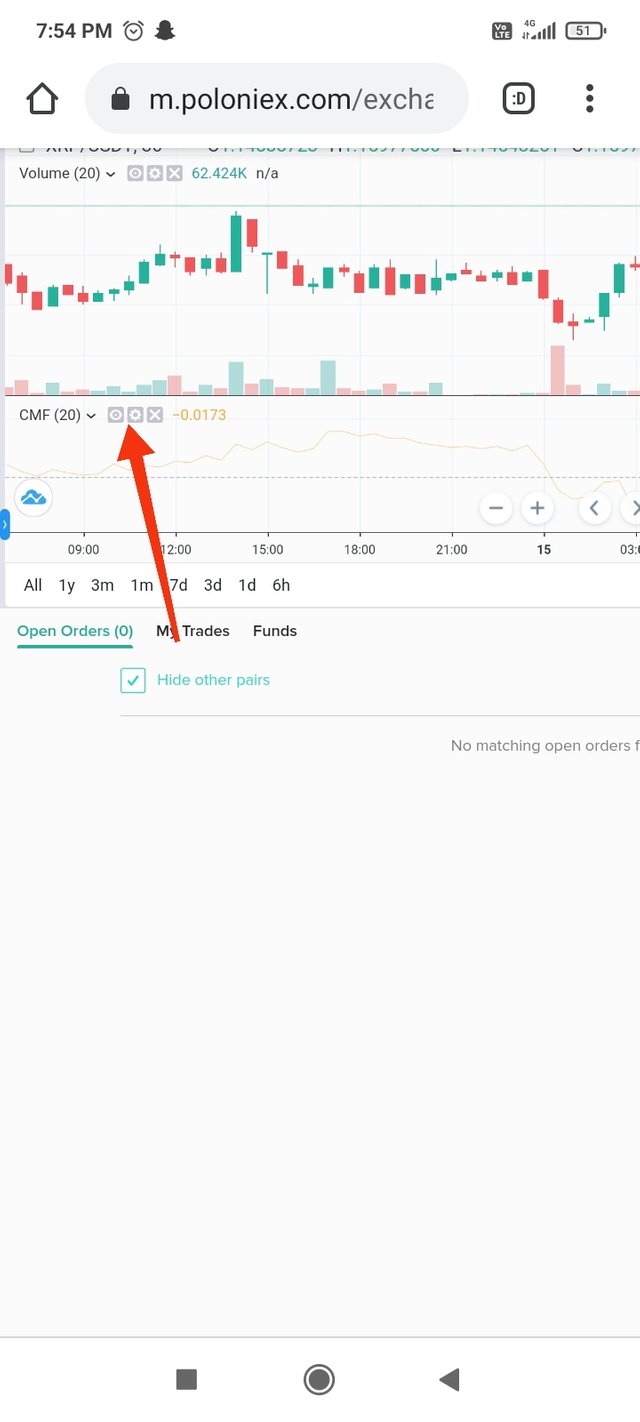
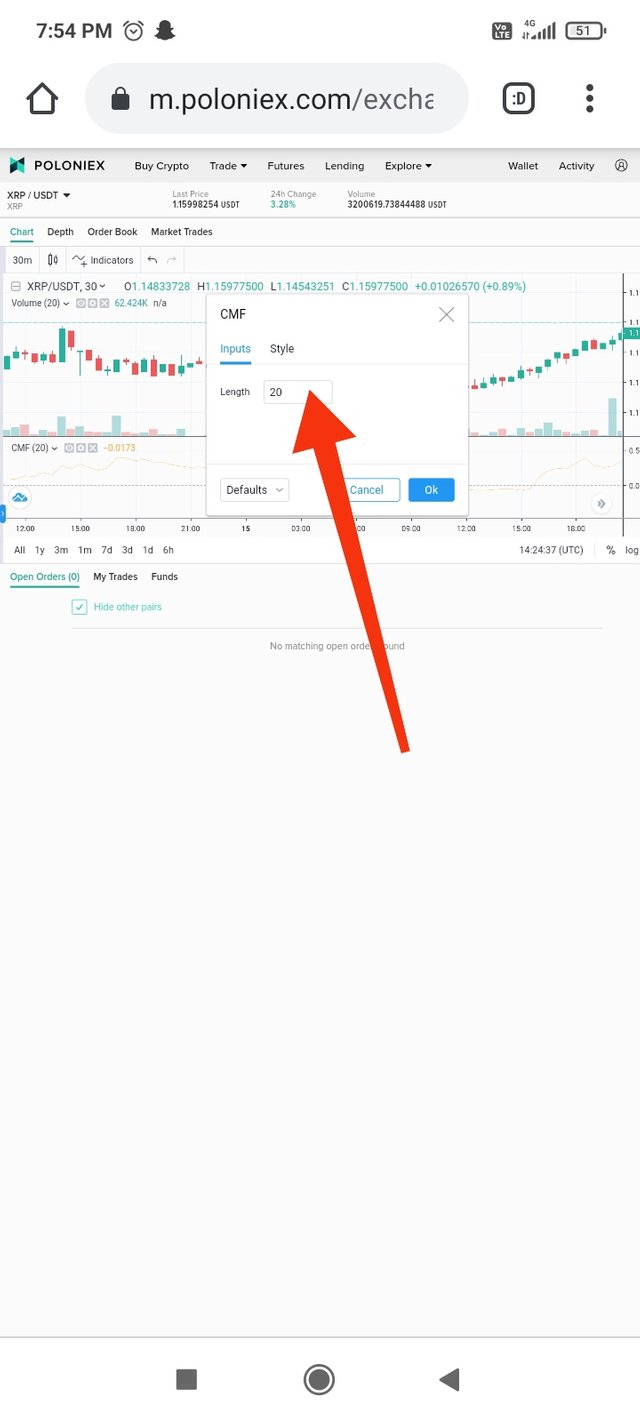
- Now write the length or periods of this indicator if you to change it.
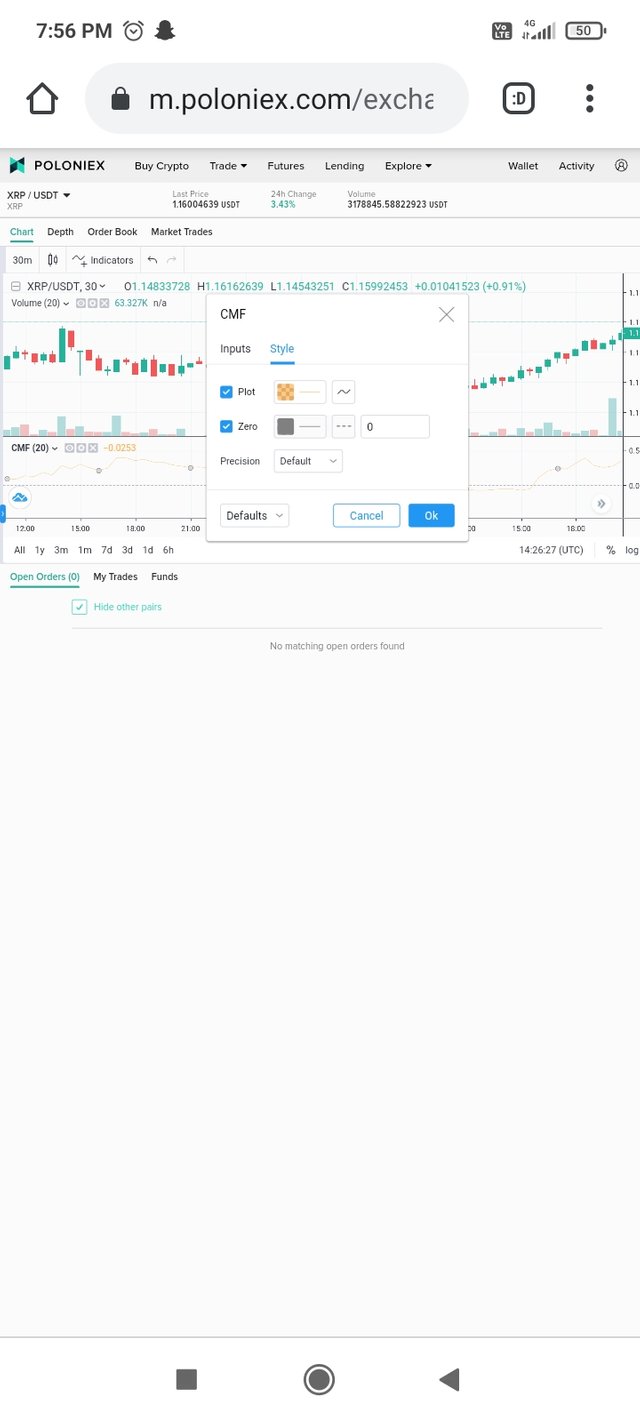
- click on style if you want to change colour or any thing else.
Best setting for this indicator is to set lenth 20 or 21 but it depends on trader wheather he is long trader of short trader. If the trader is long he will increase the length of indiactor and if the trader is short term he will decrease the length. But these things may show some wrong signals so better is to set 20 or 21 length.
What is the indicator’s role in confirming the direction of trend and determining entry and exit points (buy/sell)؟(screenshot required)
By using Chaikin Money Flow Indicator it is vary easy to confirming the direction of trend. The direction of trend can easily get by seeing the crossing of CMF line below or above the center line which is at the middle as discussed early. When the CMF line crosses the zero line and moves above it or moves towards + 1 it is bullish trend and if the CMF line crosses center line and moves below it and towards -1 it is bearish trend.
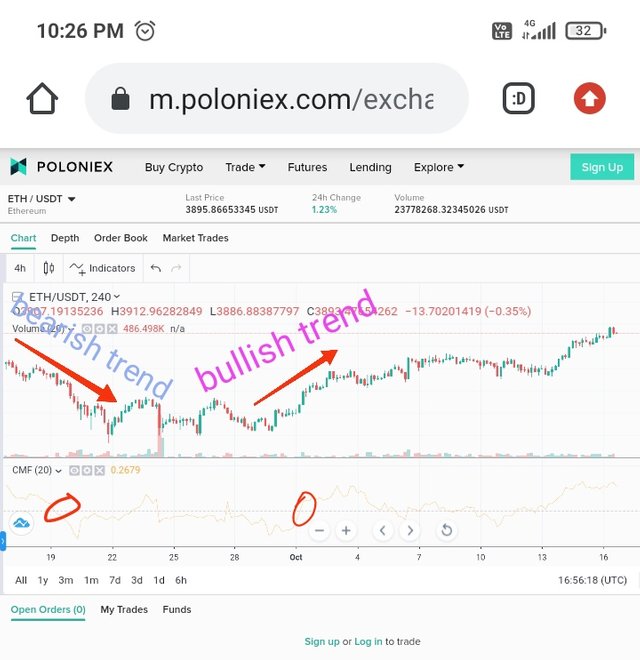
Lets see the example of etherium chart. When the CMF line crosses the middle line downwards it is bearish trend after that price of Ethereum falls. While when the CMF line moves above the center line it is bullish trend after that price of Ethereum increase.
For buy and sell entries see the same CMF line crossing. If the line crosses center line and moves up that means there are lot of people who are buying this coin at that time or buying pressure is good. That is a entry point in that coin. After that we will see price will move upwards. If the CMF line moves below the center line that means money flows out of that coin people are selling their assets, this is exit point after that we will see fall in price. Lets understand better through the below example:
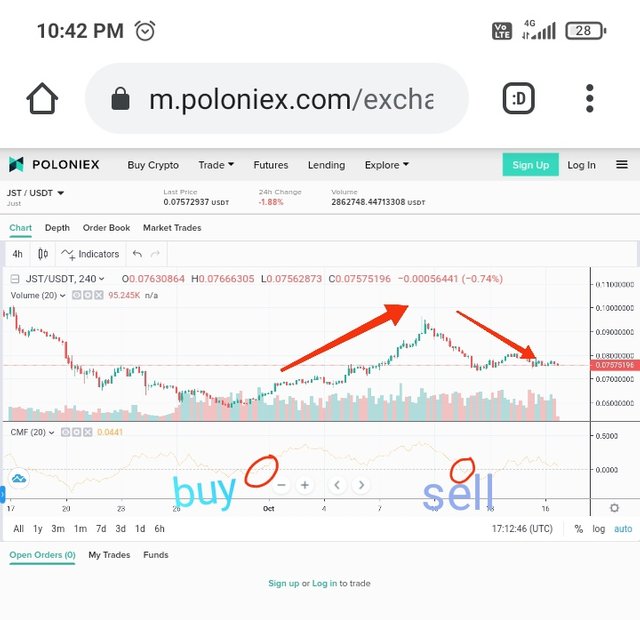
In jst chart above i have shown buy and sell poins. When the CMF line crosses above the centre it is buy signal after that price have gown up you can see from the above picture. Also when the CMF line moves below centre line it is sell signal after that price have fallen as shown above.
Trade with a crossover signal between the CMF and wider lines such as +/- 0.1 or +/- 0.15 or it can also be +/- 0.2, identify the most important signals that can be extracted using several examples. (screenshot required)
On Chaikin Money Flow Indicator we can trade by using wider lines. Same as above we can see the crossover between the CMF line and the wider lines for checking the market trend and getting buy and sell signals more perfect. As we can see lot times CMF line crosses centre line and then moves back after a small rise. This can give trader a loss for this we use wider lines for better signals. As tell by professor there are three wider lines we can use i am going to use +/- 20.
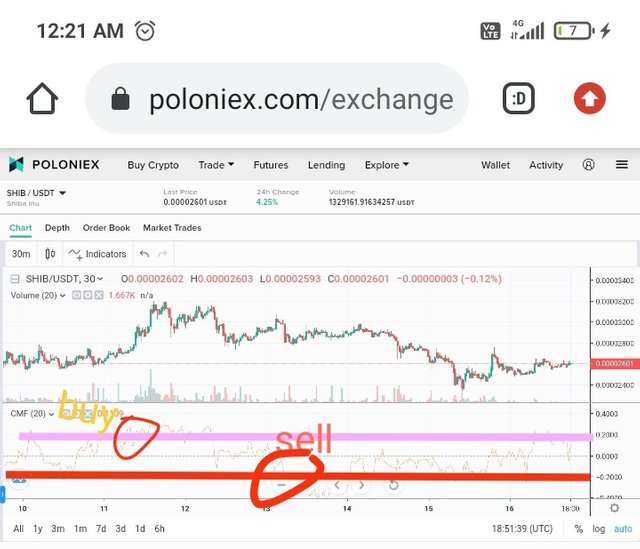
For getting signals with wider lines it easy to understand. When the CMF lines crosses the +0.20 it is buy signal but the coin at this movement. Here the buying pressure is high and people are investing good in this coin. Price will go up after this. When the CMF lines crosses the -20 it is sell signal that means people are selling their coins and its price will go down. If CMF line crosses above +0.20 buy the coin and if the CMF line crosses below -0.20 take your profit and exit from market.
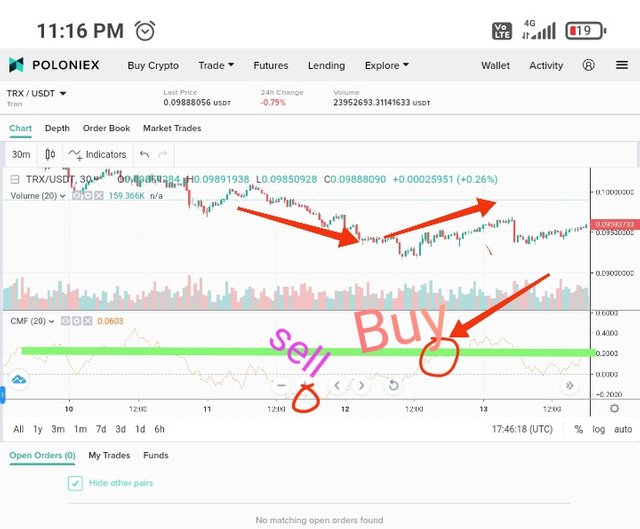
We can see from the above chart of trx coin i have market the buy and sell points. When the CMF lines moves below the -0.20 wider line it is sell signal you can see after that price have gone down so it is sell signal. At this point there is high selling pressure. Also when the CMF crosses the +0.20 wider line it is buy signal at thag time there is high buying pressure after that price have gone up. So these wider lines can gave better results.
Below is one more example of Ethereum coin where i mark buy and sell signals.
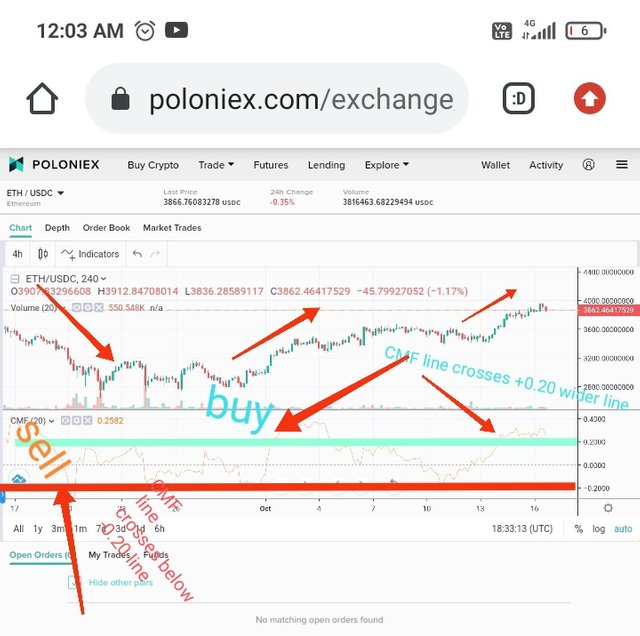
Lets take third example of shib coin where i mark buy and sell points.
How to trade with divergence between the CMF and the price line? Does this trading strategy produce false signals?(screenshot required)
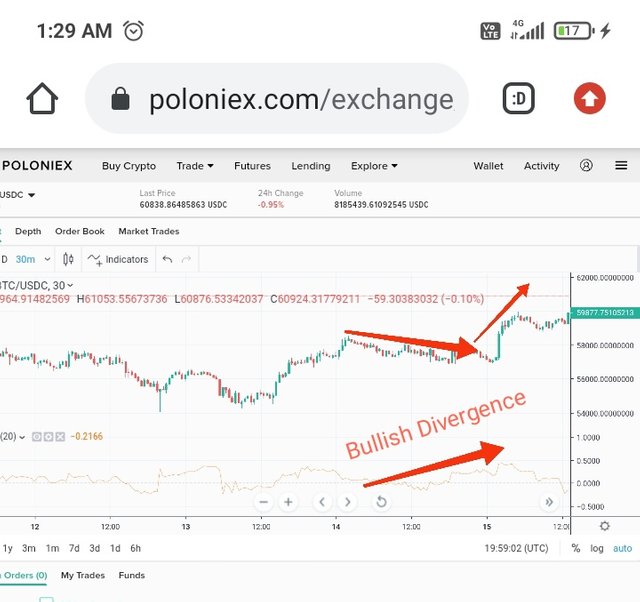
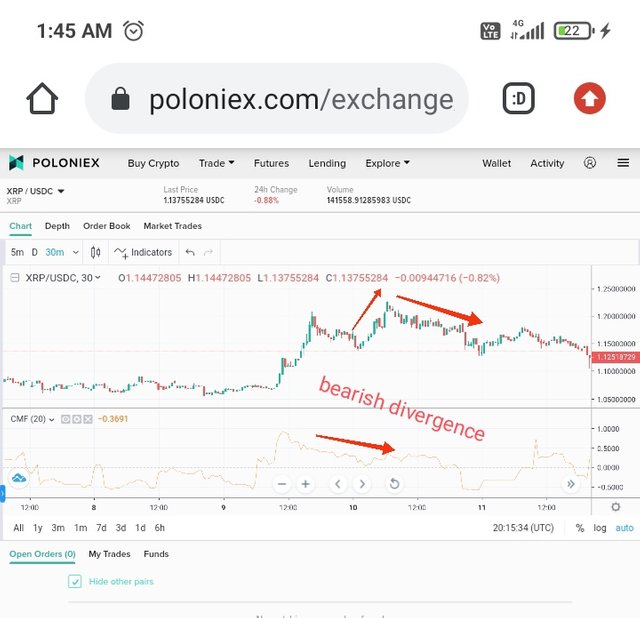
As we know CMF line and price action moves in the same direction mostely that means when the CMF line moves upwards price action also goes up and when the CMF line goes down price action line also goes down. But this phenomenon does not happen always some times the CMF line and the price action moves in opposite direction as CMF moves up price action line goes down and vice versa this is called divergence. By this phenomenon we can take advantage of the market by making entry and exit from the market. The divergence gave us buy and sell signals. When the price of any coin is higher high but the CMF moves in lower low after that we see the price also goes down so this is sell signal and is bearish divergence. When the price is making lower low buy the CMF goes up after that price also goes up so this is buy signal and bullish divergence. Lets understand both with a example:
In bullish divergence the Chaikin Money Flow Indicator shows bullish trend but the price moving downwards . This shows downtrend will end soon. After that we see price also moves in upward direction. You can see better from below example
In bearish divergence Chaikin Money Flow Indicator shows bearish trend but the price moving up wards this shows up trend will end soon we will see price moves also downwards.you can see below image for better understand.
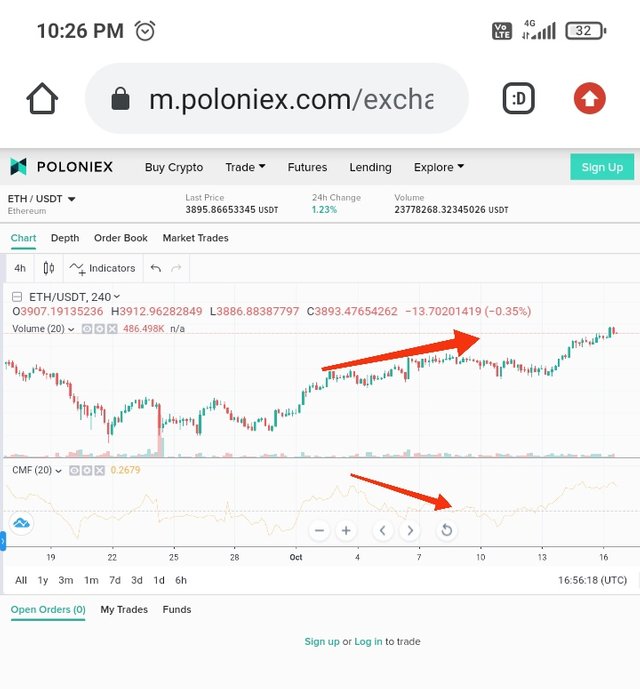
Nothing in the universe is 100% perfect Chaikin Money Flow Indicator provides sometimes false signals. But mostly it provides good signals. So it is better to use this indicator with some other indicator for better results. You can see from the below CMF shows downtrend while market moves upwards.
Conclusion
Chaikin Money Flow Indicator is used to measure the money flow. It is used to measure the buying and selling pressure of any coin. Its default setting is 20 or 21 periods length. This indicator is vary simple to understand and get signals as crossover between CMF line and center line provides signals that are vary easy get. A new trader can easily use it but it is better to use this with some other indicator for better results.
THANKS READING.
Hello @alexcarlos,
Thank you for participating in the 6th Week Crypto Course in its 4th season and for your efforts to complete the suggested tasks, you deserve a Total|5.5/10 rating, according to the following scale:
My review :
Work with average content. It was possible to go deeper into the ideas presented and provide several examples. Here are some notes that I bring to you.
You have provided a series of useful information in your explanation of the CMF indicator.
You gave a clear example but it is not correct where you have to provide the results of the previous period 19/20 to get the result of the period 20/21. It was possible to add your opinion on the result obtained.
Chaikins suggests 21 days as the default setting. That corresponds approximately to a trading month. If the number of periods is larger, the indicator is less volatile and less prone to sideways movements. In a weekly or monthly chart, the number of periods should be reduced.
The rest of the answers were at a medium level in terms of explanation and depth of analysis.
Thanks again for your effort, and we look forward to reading your next work.
Sincerely,@kouba01
Downvoting a post can decrease pending rewards and make it less visible. Common reasons:
Submit
Thanks for checking my work , i will try to improve my work next time.
Downvoting a post can decrease pending rewards and make it less visible. Common reasons:
Submit