Hello everyone hope you all are fine and safe. Today i attend one more lecture by @kouba01 sir in which i learn about Bollinger Bands trading strategy. Now i am going to submit my homework task for this lecture.
Define the Bollinger Bands indicator by explaining its calculation method, how does it work? and what is the best Bollinger Band setup?
Bollinger bands is a technical indiactor devolved by jhon bollinger. It works as an oscillator indiactor. It gives information about the condition of price wheather it is at bottom or at the top. It indicates wheather the market has low or high volatility. Bollinger bands consists of three lines or bands which are , upper band , lower band and middle moving average line. Bollinger bands used two parameters for working one is period and second is standard deviation. The moving average line is 20 period SMA , upper line is set plus two standard deviation from the moving average line while the below line is set minus two from the moving average line. The two lines upper and below line reacts with market that means the expands when we see high volatility in market while contracts when we see low volatility in market.
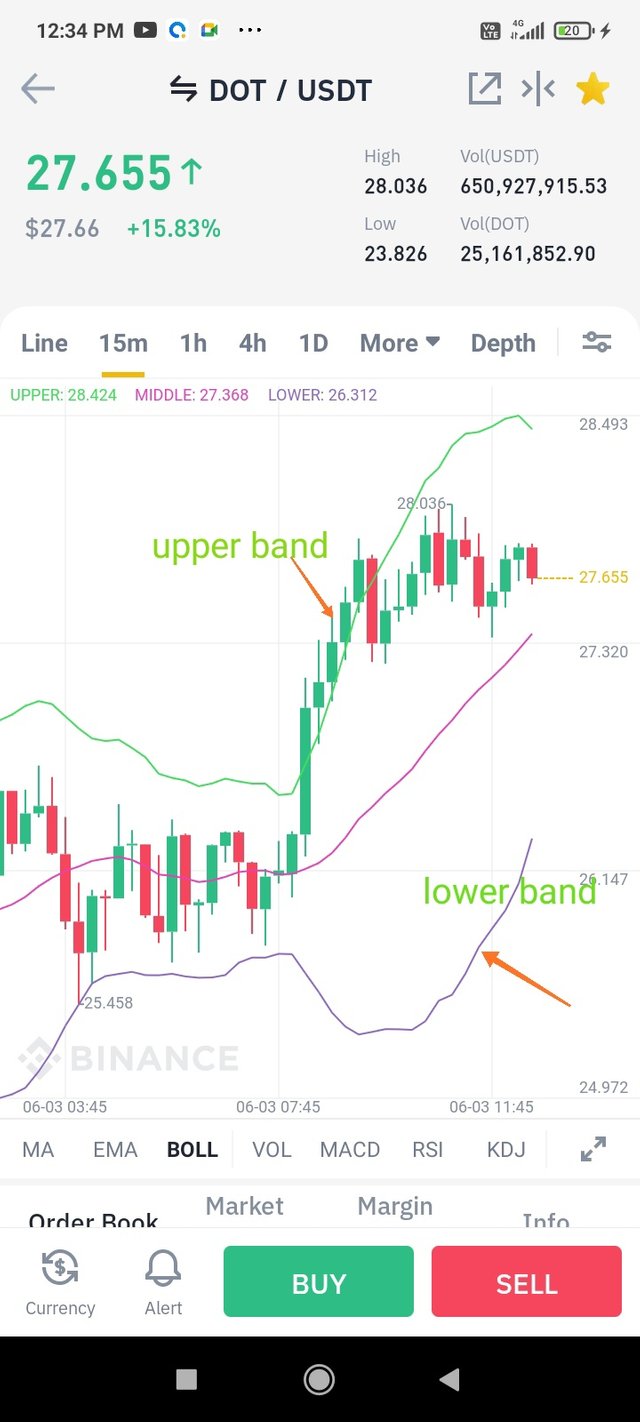
Calculation of bollinger bands
For calculation of bollinger bands you need to know about the moving average first. I think you have heard average in math class lot of times. Average is the sum of observation divided by the number of observation. For example we have list of traders who have protfolio 2k,3k,4k,5k respectively , their average will be 14k/4. Same concept is used here in bollinger bands. Moving average equals to sum of prices in x days divided by the total number of days.
After calculating the moving average standard deviation is calculated over same number of periods in simple moving average . for the upper band add the standard deviation to the moving average , and for the lower band subtract the standard deviation from the moving average.
Some typical values are
20 days moving average having bands at 2 standard deviation.
working of bollinger bands.
There are many ways through which bollinger bands are works , it gaves signals when to buy and when to sold but you should also see other indicators for safe trader. Following are some working methods of bollinger bands.
overbought and oversold
If the price of any coin moves above the moving average line and touches the upper band or if the price moves vary high of any asset this is called overbought , after that we can see some price fall or correction in that assts as lot of traders will see their asset and make their profit.this gives us information that we have to sell our assets and make our profit.
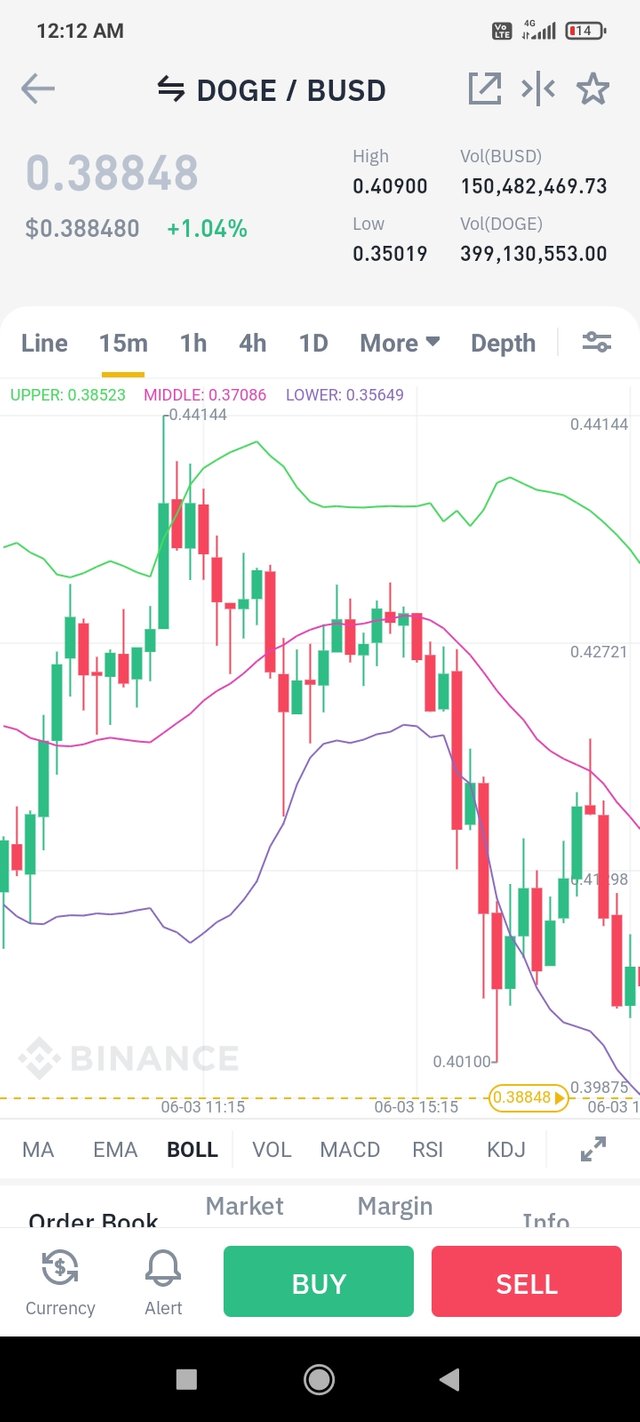
You can see from the above picture of doge coin, when the price touches the upper band we see price goes down.
If the price of any coin moves below the moving average line and touches the lower band or if the price of any coin falls it is called oversold. After this we will see price will move up. Lot of trader's will make entries or brought that coin so this gives us information regarding entry in that coin.
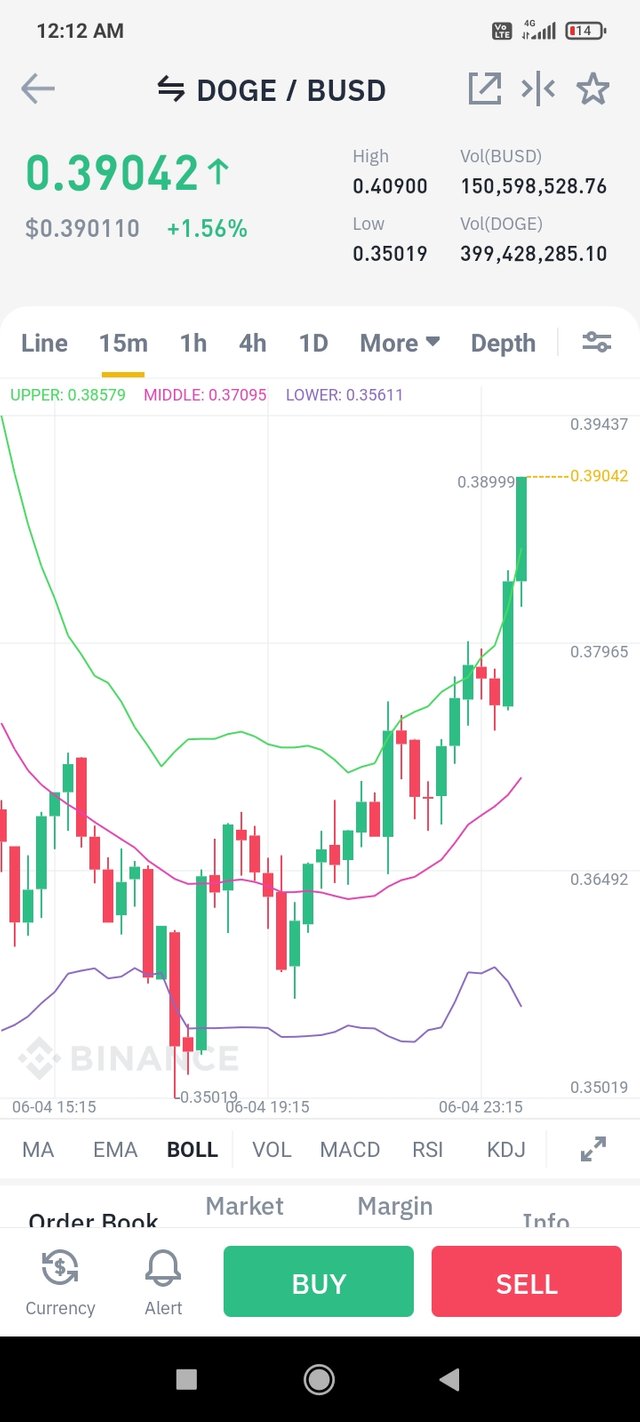
Same example of doge when market touches the lower price moves up. This gives information of buying.
volatility of market
When bollinger bands came close to middle line or contracts price of that asset becames less volatile. Where if the bollinger bands moves away from middle line or expands price of that asset becomes high volatile.
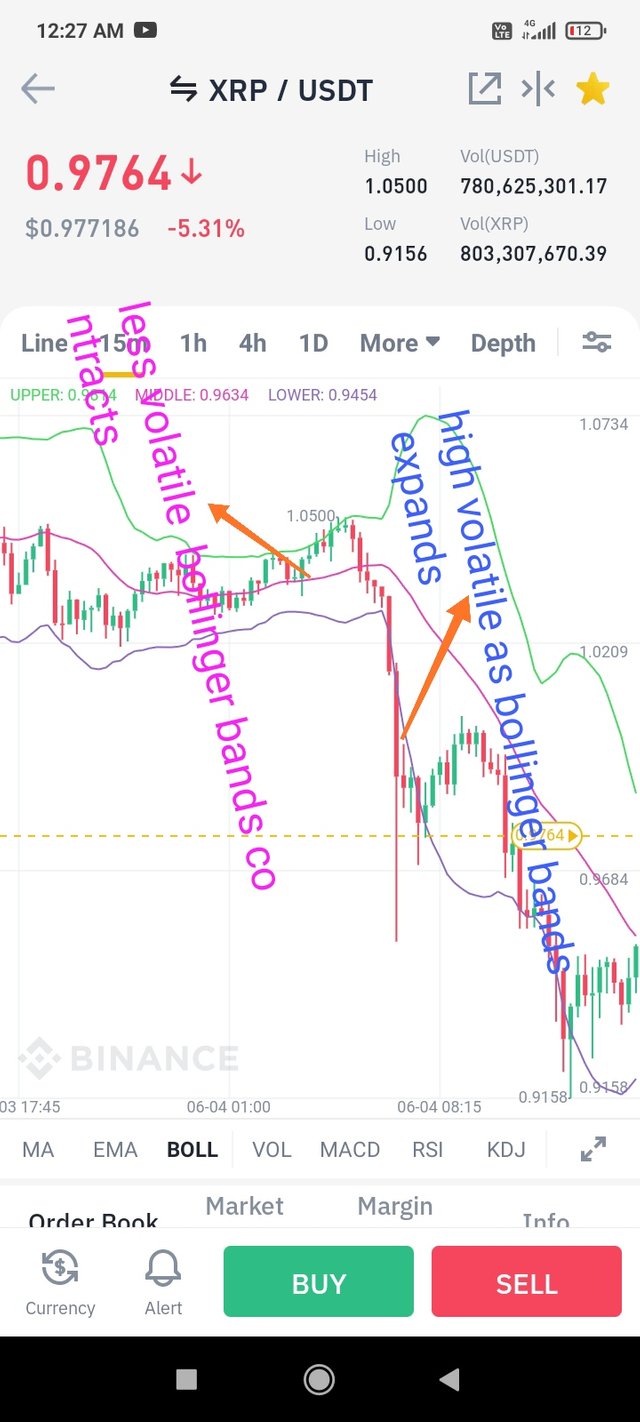
You can see from the above example when bollinger bands contracts we didn't see volatile market. On the other side when bollinger bands expands we see high volatility of market.
There is one more trading strategy known as Bollinger Bands Squeeze. It is used for finding the low volatility zones. It is used with some trading indiactors.
What is a breakout and how do you determine it?
Breakout in Crypto world means when the price of any asset or coin moves above the resistance level and below the support level. The resistance and support level's are made by traders, different traders make different resistance and support level's. When the price moves above the resistance level or below the support level we see a huge price gain when it brakes resistance level or we see a huge decline in price if it brakes the support level.
Now you have enough information about the brakeout now how to determine brakeout by using bollinger bands. For this you should know about the bollinger Squeeze. I have used this word above. Bollinger Squeeze is when the price didn't move to high or low for sometime or when we see low volatility in price of any asset. Brakeout accours after bollinger Squeeze after braking resistance or support.
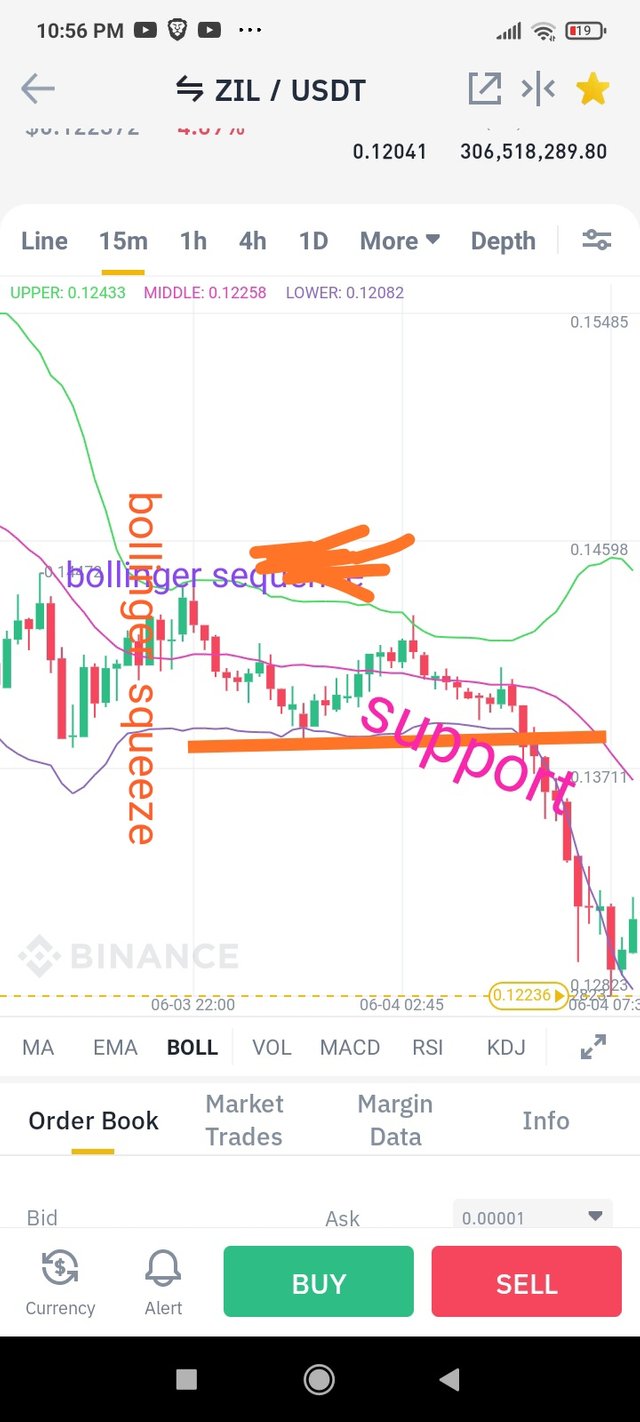
You can see from the above screenshot after the bollinger squeeze we see it brakes the support level and we see a brakeout in zilika coin.
How to use Bollinger bands with a trending market? (screenshot required)
Bollinger bands are easy to use for trading purpose. Every trader invests his money so that he can make some profit and this is only possible if he takes entry and exit at right point. Bollinger bands gives us information about that, for this the middle line plays an important role. If the price of any coin goes up and we see it falls and touches the middle band or line of bollinger bands it becomes it support level after that we will see a bounce back of price in that coin. So if it touches the middle band it gives a buy signal to trader.
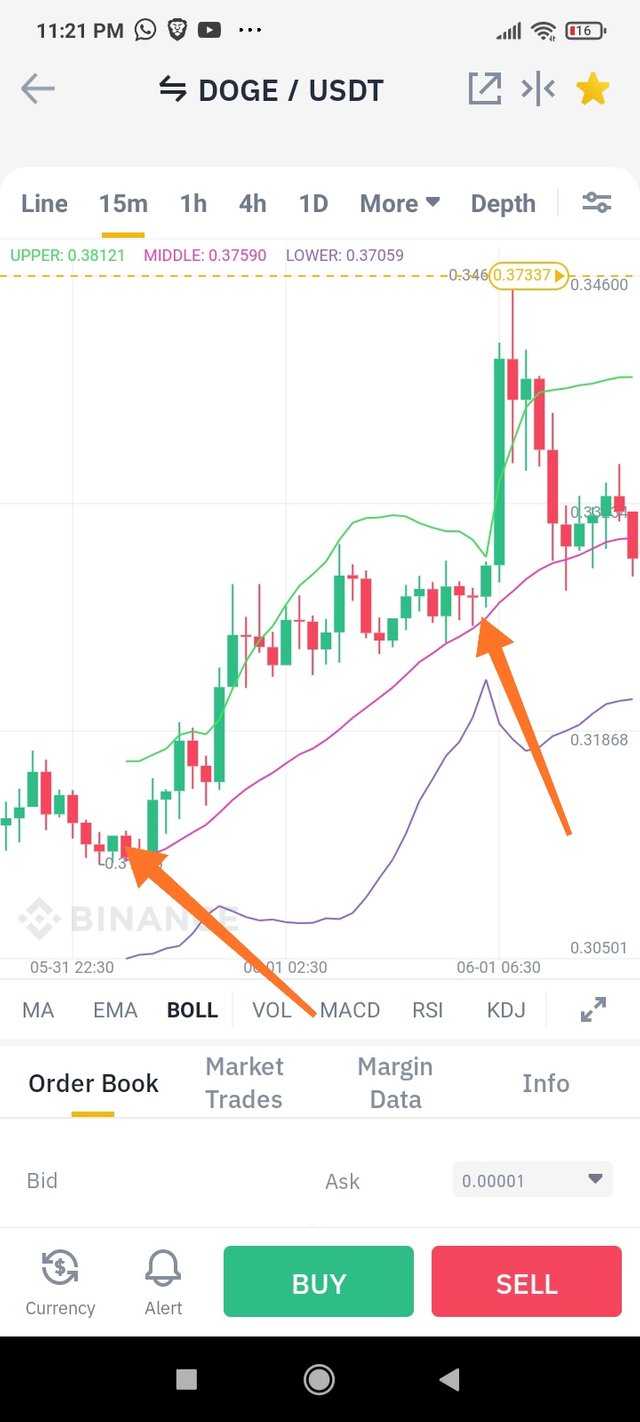
You can see from the above example when the price touches the middle bands during the uptrend we see a rise in price so these two arrows gave buy siganlS.
Now if we see price of any coin decreses continuously or in downtrend market when the price touches the middle bands it becomes it resistance level and it pushes it back and we sew price decreases , so at that time it gives see signal.
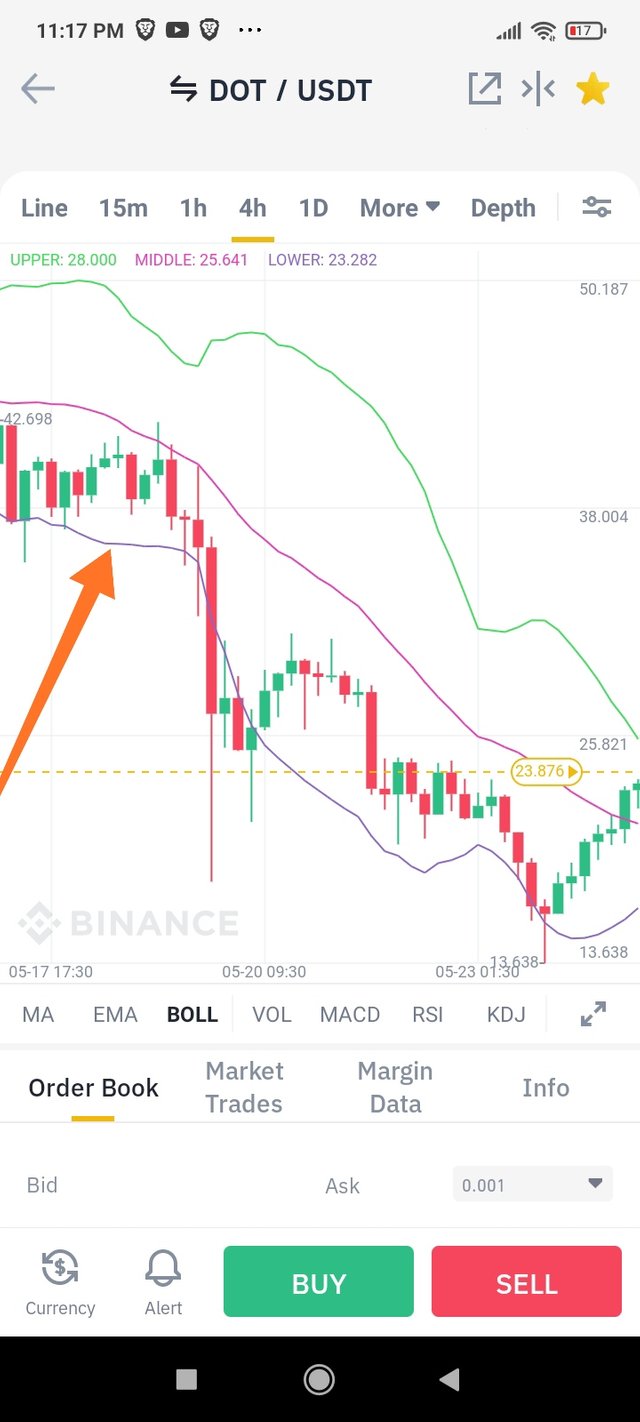
You can see from the above example when in downtrend market the price touches the middle bands and after that we see its price decrese, so it gives sell siganls.
What is the best indicator to use with Bollinger Bands to make your trade more meaningful? (Screenshot required)
As i have read macd indiactors and Rsi indiactor by Cryptoacdemy so these two indiactor are best to use with bollinger bands also they are vary useful and gave good results. Some times one indiactor didn't gave correct information about any asset so you have to follow other indiactors before your trade.
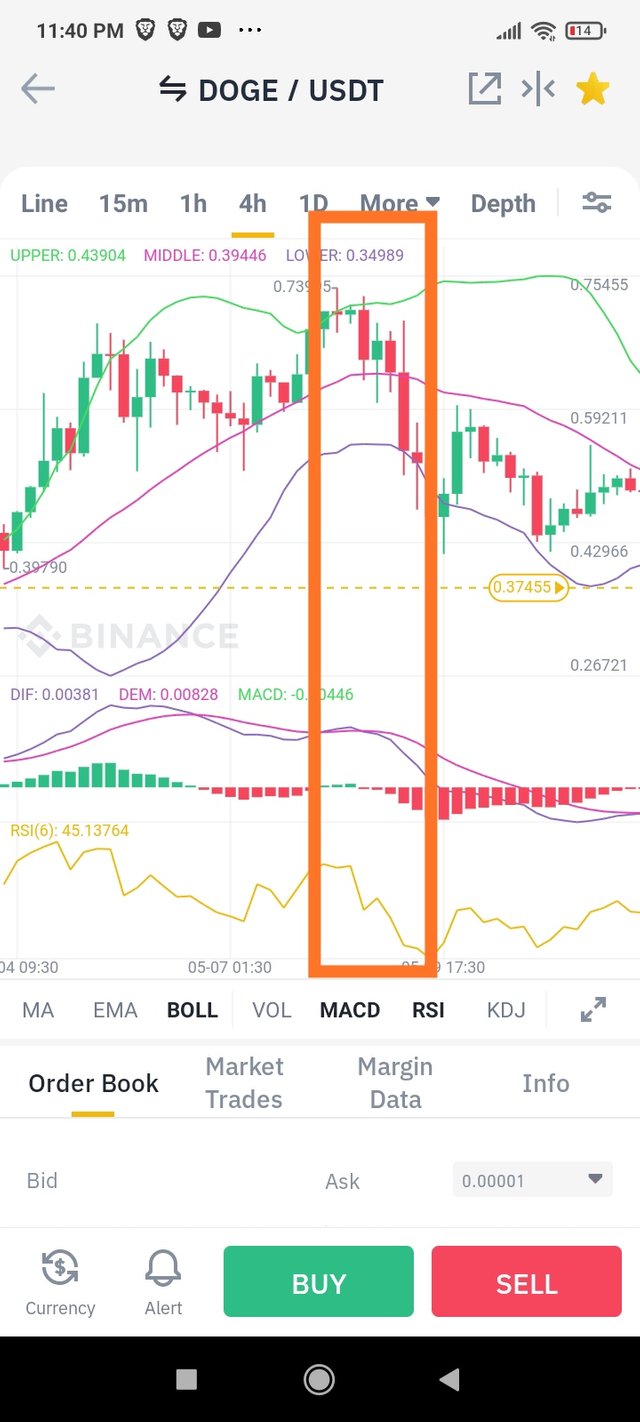
From the above picture you can see in the box when the price of any coin touches the upper band this is called overbought after that we see a price takes correction, same you can find from the macd indiactor red candles start making or we can say bearish cycle starts making which gives see signal according to macd indicators. Also Rsi indiactor gives sell signal.
What timeframe does the Bollinger Bands work best on?And why? (Screenshots required)
In market there are two types of traders one are short term traders and others are long term traders. If you are short term trader you have to focus of hourly or 15 minute's charts of bollinger bands . But if you are going for long go for weekly charts of bollinger bands. Better is to go for the both timeframe bollinger bands. In my opinion long timeframe charts are best to use for trading as it gaves more information regarding market. When to take entry as well as when to take exit.
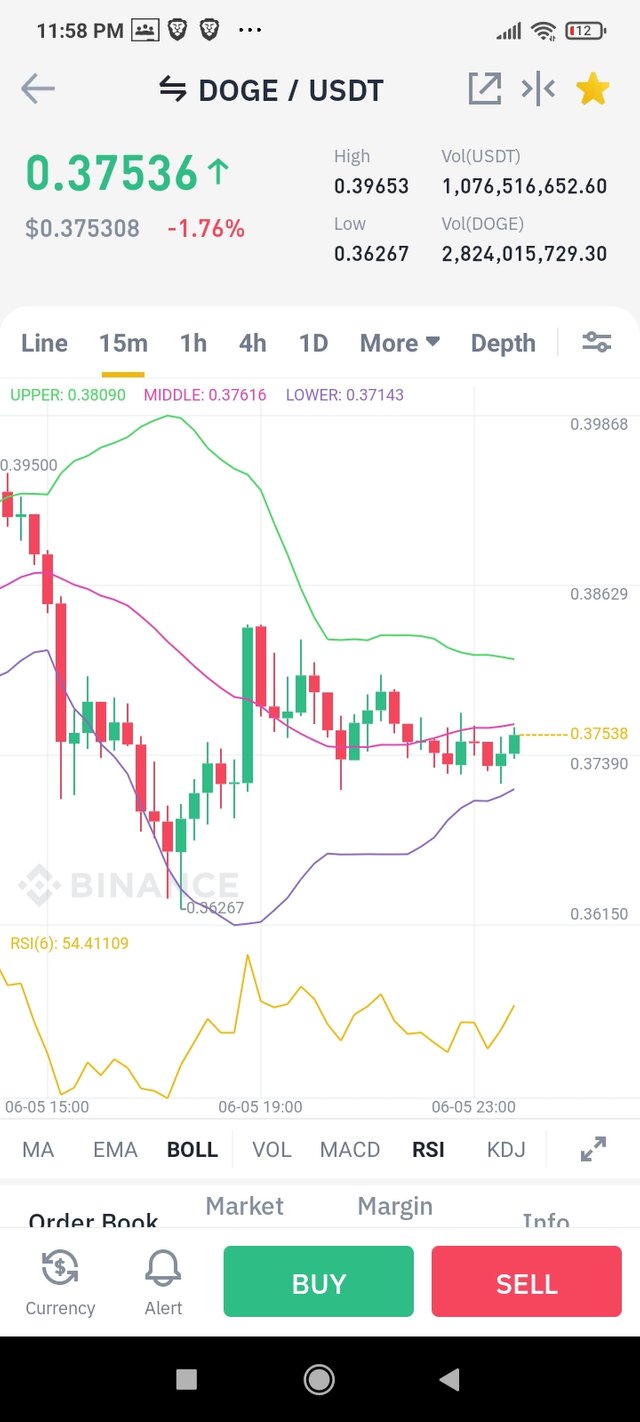
15 minutes timeframe bollinger bands.
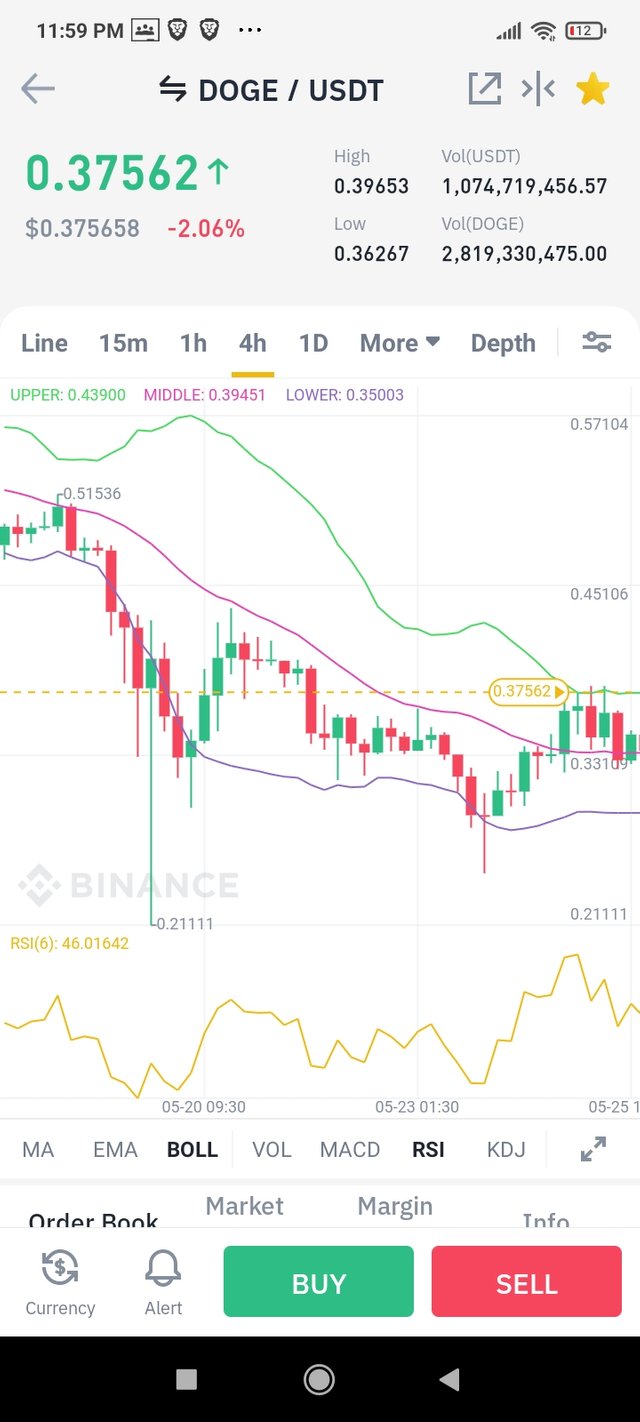
daily .
From the above 15 minutes time frame bollinger bands we didn't get too much information while dialy chart gave us information regarding many signals. So best is to use high time frame bollinger bands.
Review the chart of any pair and present the various signals giving by the indicator Bollinger bands
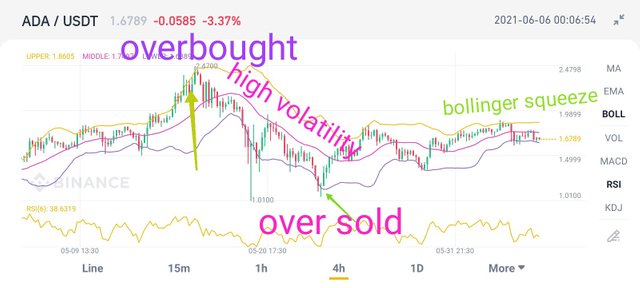
I have taken the example of Carnado and usdt pair. the first arrow where the price touches the upper band , as already that is called overbought , where lot of trader sell their asset and we see some correction in that coin so that gives us sell signal. You can see price decreses after that. Now look at the second arrow where the price touches the lower band that is called over sold. Here lot of traders take new entries that gives us information for buying, we can see clearly after that price goes up.
You can see at the end when the bollinger bands have come closer to middle band or contracts we didn't see any major price change that is there is less volatility. On the middle where bollinger bands expands we see price shows high volatility and in this case price drops.
THANKS FOR READING.
I invite @kouba01 sir check my homework post.
Hello @alexcarlos,
Thank you for participating in the 8th Week Crypto Course in its second season and for your efforts to complete the suggested tasks, you deserve an 8.5/10 rating, according to the following scale:
My review :
Good content You did an excellent job in understanding and researching to reach answers with deep analysis and clear interpretation.
Thanks again for your effort, and we look forward to reading your next work.
Sincerely,@kouba01
Downvoting a post can decrease pending rewards and make it less visible. Common reasons:
Submit