Hello everyone hope you all are fine and safe. Today i attend one more lecture by professor @fredquantum which was about the Triple Exponential Moving Average indicator. Now i am going to submit my homework task for this lecture , let's start:
What is your understanding of Triple Exponential Moving Average (TEMA)?
In crypto market there are lot of indicators present which traders use for knowing the trends in market. Among all moving Average is vary easy to use and lot of traders use this indicators for generating the signals. Moving average work on simple concept of mathematical average. In moving average trader can easily find the buy and sell signals. If the price crosses above the moving average line that gives us buy signals and if the price moves below the moving average line it gives us sell signal. Moving Averages have different types like Simple moving averages , exponential Moving Averages , weighed Moving Averages, Triple Exponential Moving Average. I have explained few in my last homework task.
In Moving Average indicator we found few problems like lagging Triple Exponential Moving Average solves the lagging issue. TEMA looks same as Simple Moving average but it has lot of difference. TEMA generates signals on the basis of present market conditions while as simple moving averages generates signals on the basis of past price conditions.
Triple Exponential Moving Average indicator was first developed by Patrick Mulloy. TEMA was first used in stock market then seeing good results by this indicator it was used in crypto market too. TEMA is used for smoothing the price data. TEMA reacts price vary quickly than other Moving Averages this is because lagging has been removed in this indicator. TEMA is used to find out the trend in the market as well as to find the support and resistance levels.
TEMA is used same as Moving Averages. In TEMA the the angle slope of TEMA line is used to find out the signals. If the angle slope moves in upward direction it tells us bullish trend and if the angle slope moves in downward direction it tells us bearish trend. In TEMA there is still lag present if price moves faster up and down it takes some time to give signals.
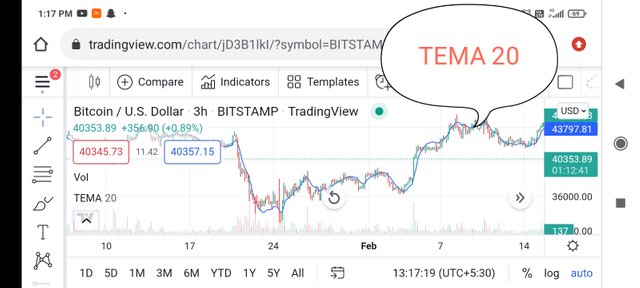
Image source trading view
Look at the above picture in which i have added TEMA 20 indicator. By TEMA trader can easy find the trends and signals. Lagging and noise is reduced to grater extent. TEMA can be used for short term trading.
How is TEMA calculated?
Triple Exponential Moving Average is calculated by using the given mathematical formula:
TEMA=(3EMA1)-(3EMA2)+EMA3
where:
EMA1 = Exponential moving Average
EMA2= Exponential Moving Average of EMA1
EMA3= Exponential Moving Average of EMA2
For calculating TEMA first we need to calculate the EMA from the lookback period and then calculate EMA1 and EMA2 from the same lookback period. Then put these values in the above formula to get the value of TEMA.
Add TEMA to the crypto chart and explain its settings. (Screenshots required).
For this task i will use tradingview platform because in this platform there are lot of indicators present . Below is step by step adding process:
1.Visit the official site of trading view by clicking on this site trading view.
2.Select any chart pair as i have selected dot-usdt pair.
3.Now click on indicators tab on the top.
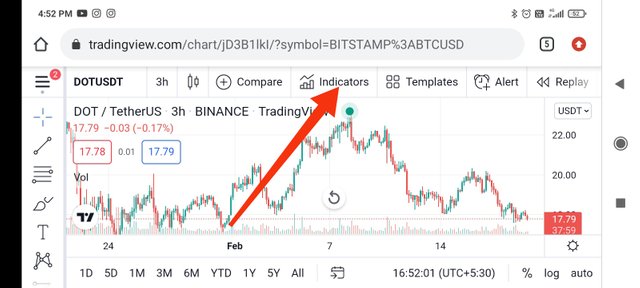
Image source trading view
4.Search Triple Exponential Moving Average and click on it.
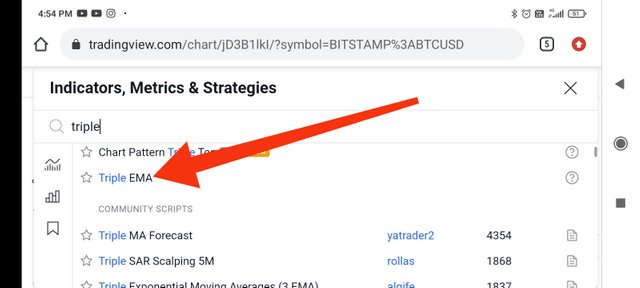
Image source trading view
You can see i have added TEMA indicator successfully.
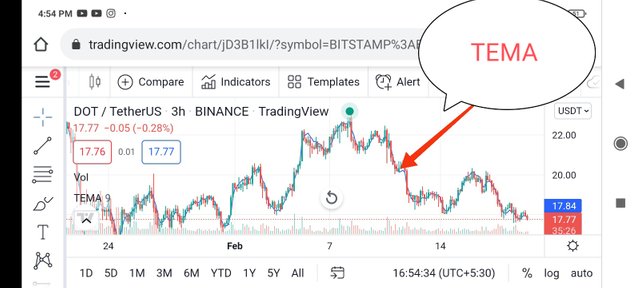
Image source trading view
Settings of TEMA
Trader can change the settings of TEMA indicator according to his need , for changing the settings click on settings tab as below
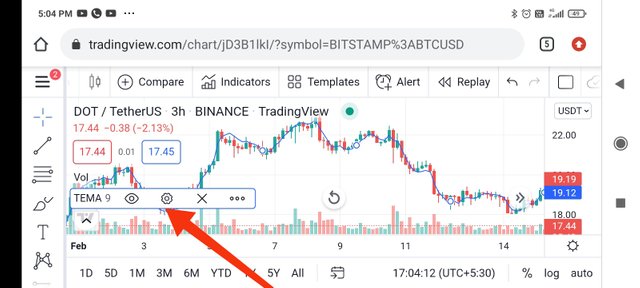
Image source trading view
By clicking on TEMA settings you can change three things one is inputs , style and visibility.
The default setting for inputs is 9 which is mostly used by short term traders you can change it according to your need. I have changed it to TEMA 30 as shown below
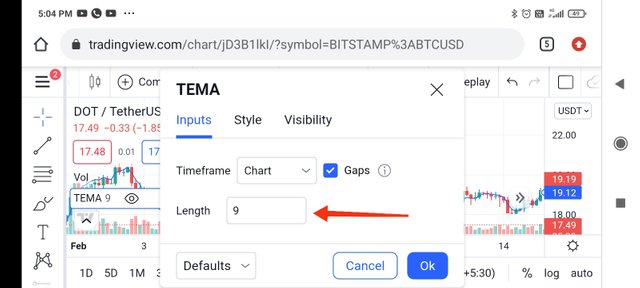
Image source trading view
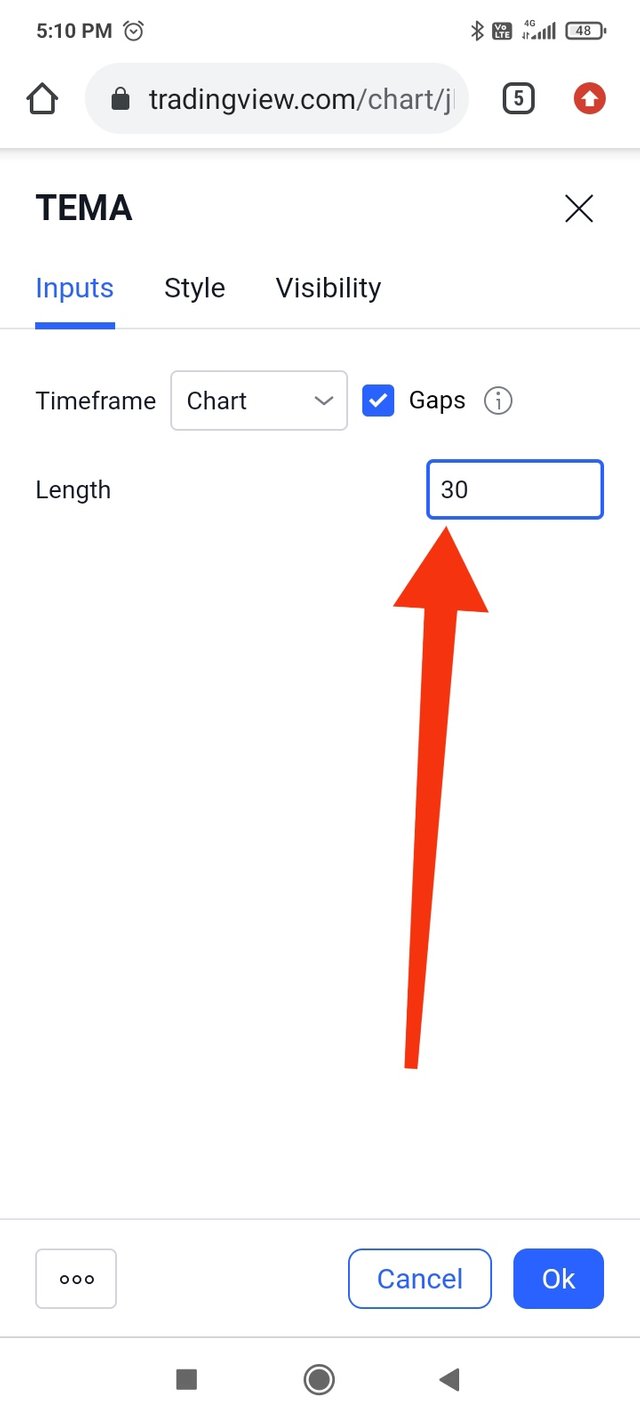
Image source trading view
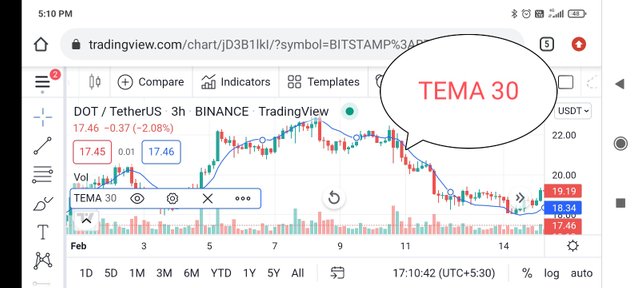
Image source trading view
By style settings trader can change the clour of TEMA line, as i have changed below
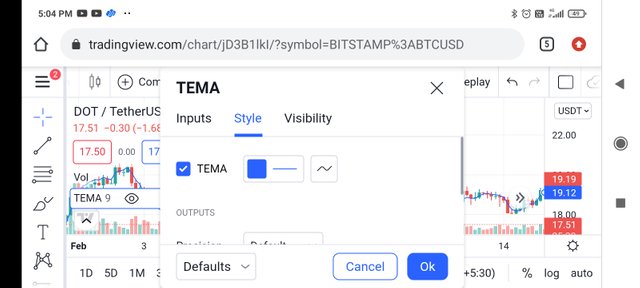
Image source trading view
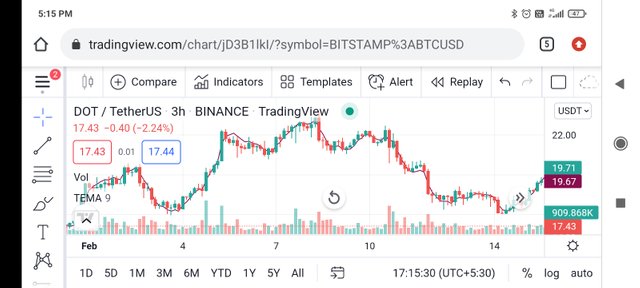
Image source trading view
By using the visibility settings trader can change it according to his need.
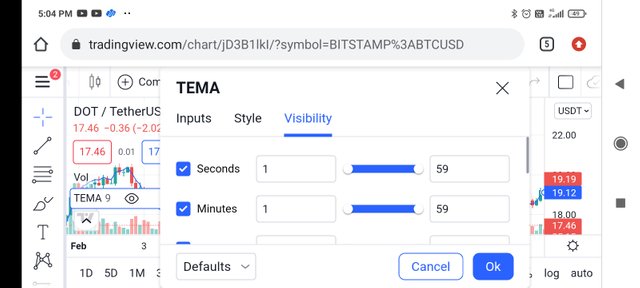
Image source trading view
Compare TEMA with other Moving Averages. You can use one or two Moving Averages for in-depth comparison with TEMA.
TEMA and SMA
First lets talk about calculations SMA is calculated easily by taking the average of past prices while as TEMA need some in depth or complex calculations we have to first calculate three types of EMA's and then put them in formula.
SMA is lagging indicator among all the other moving averages while as TEMA reaches vary fast towards the price as gives signals and trends faster than SMA.
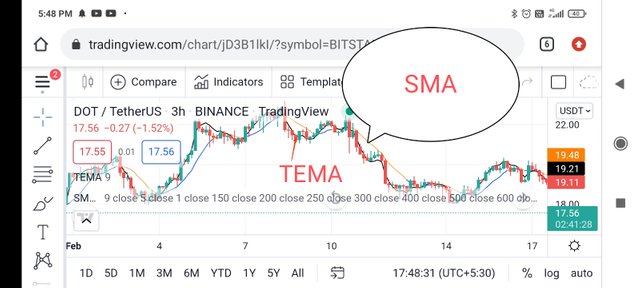
Image source trading view
TEMA follows price vary closely as compared to SMA that helps traders better understanding of market conditions.
TEMA provides smooth signals and neglects noise to grater extent while as SMA didn't provide smooth signals as it contains noise
Sometimes SMA may produce false signals while TEMA gives more accurate signals.
TEMA and EMA
TEMA is formed from the EMA , DEMA and TEMA so it reduces further lagging which is present in EMA. TEMA moves vary faster than the EMA but sometimes it overshoot the market that means it sometimes moves too far and beyond the present price action.
TEMA reacts price change quickly than EMA which helps traders to get good opportunities in market quickly. TEMA follows price closer as already tell you than EMA. EMA takes time to react to price change and also didn't follow price closer which may cause formation of wrong signals.
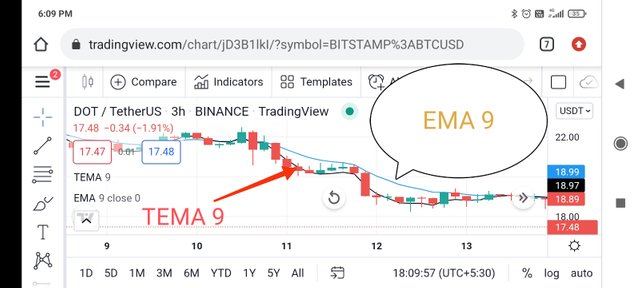
Image source trading view
As EMA reacts price little late that may cause trader to miss some big opportunities in the market. We can use the combination of EMA and TEMA for generating good signals as crossover is one of the known trading strategy which we can get using these two in combination.
Explain the Trend Identification/Confirmation in both bearish and bullish trends with TEMA (Use separate charts).
As i already tell you that TEMA are trend following indicators so we can easily find the trends by using TEMA indicator. The location of TEMA line related to price line tells us about market trends. When the TEMA line is found below the price chart it identifies that the trend this time is bullish trend. Similarly when the TEMA line is found above the price Chart it identifies that the trend this time is bearish trend. If we can use TEMA for finding the trends then we can use TEMA also for finding the changes that is used for generating buy and sell signals.
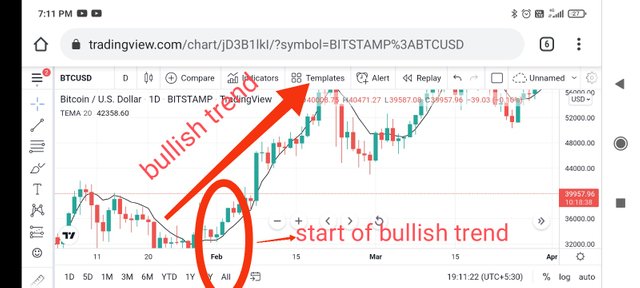
Image source trading view
From the above chart we can see that the TEMA line is found below the price chart that identifies that the trend is bullish. At the crossover trader can make buy trade here.
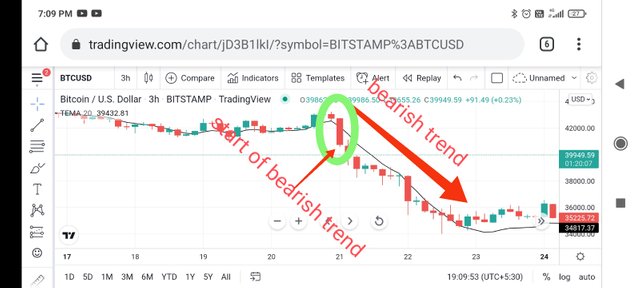
Image source trading view
From the above screenshot you see that the TEMA line is above the price chart that identifies that the trend this time is bearish trend.At the crossover trader can make sell trade.
Explain Support & Resistance with TEMA (On separate charts). (Screenshots required).
Support and resistance levels are known as key levels in crypto market. These levels provide information about the buying pressure and selling pressure. When the price moves towards these levels it is expected price will bounce in reverse direction. Trader can also find signals on these key levels. Sometimes support and resistance levels may brake due to high buying or selling pressure.
Support and resistance levels are defined when the price moves to the TEMA line and then bounces back in the reverse direction . when the prise is rising overall and on pullbacks it drops to TEMA and then bounces back in upward direction here is the support and similarly when price is in downward movement and on pullbacks it rises to tema and then bounces back in downward direction is called support level.
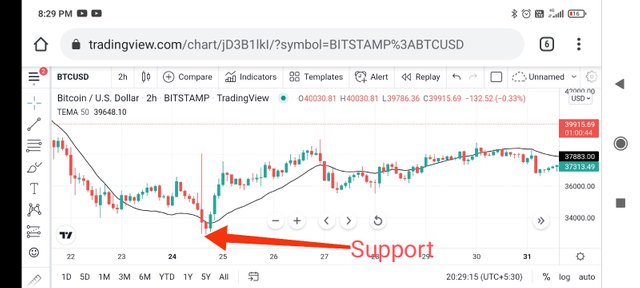
Image source trading view
Look at the above picture of Btc-usdt TEMA is utilised as dynamic support. After that market gets in reverse trend from bearish to bullish trend. Here trader can make a buy position and set the target to resistance.
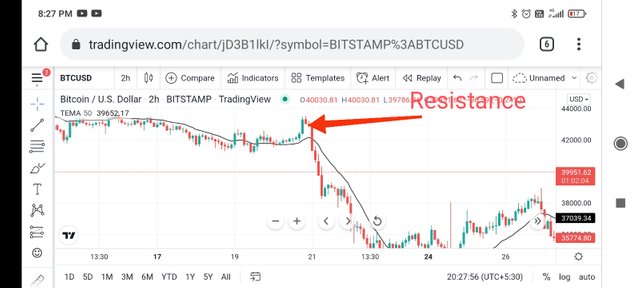
Image source trading view
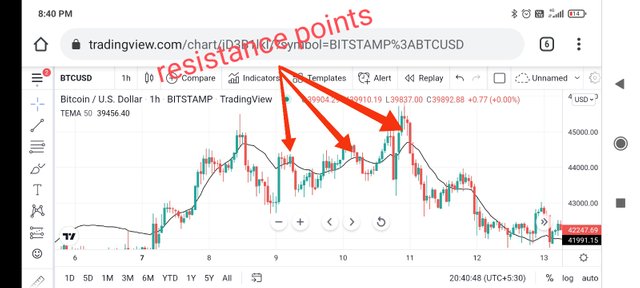
Image source trading view
Now look at the above picture of btc-usdt in which TEMA is utilised as dynamic resistance. After that market moves in reverse direction from bullish to bearish. Here trader can make a short position.
Explain the combination of two TEMAs at different periods and several signals that can be extracted from it. Note: Use another period combination other than the one used in the lecture, explain your choice of the period. (Screenshots required).
As we know TEMA is used to find out trends in market and also find out the buy and sell signals. But sometimes it gives false signals that time trader may face loss. In order to get more accurate signals traders use two or more TEMA's in combination. In this strategy we need one TEMA having short period and another having long period. Shorter period TEMA reacts quicker to price change while longer period TEMA reacts slower to price change.
The crossover phenomenon between these two TEMA's is used to find buy and sell signals.
If the shorter period TEMA line crosses above the longer TEMA line it gives us the indication that bullish cycle is coming. Trader can make buy position here.
If the shorter period TEMA line crosses below the longer TEMA line it gives signal that bearish cycle is coming. Trader can make short position here and can get good profit. Here i will use 25 shorter TEMA and 70 period longer TEMA.
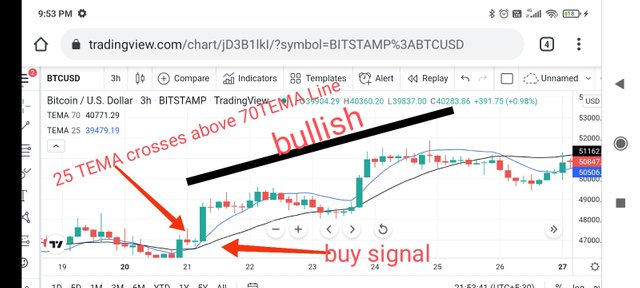
Image source trading view
Look at the above example of Btc-usdt. When 25 shorter TEMA crosses above the 70 longer TEMA it tells us bearish reversal trend now market will move to bullish side. Here trader can make a long position.
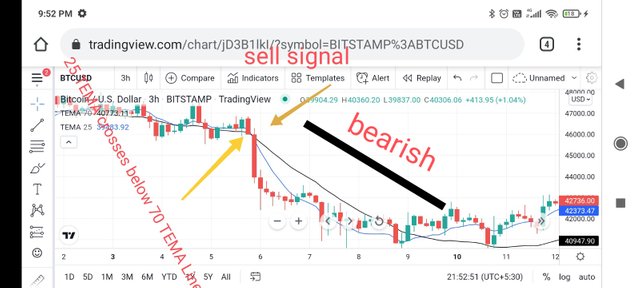
Image source trading view
Now look at the same example of btc-usdt When 25 shorter TEMA crosses below the 70 longer TEMA line it tells us bullish reversal trend now market will move in bearish side. Here trader can make short position.
What are the Trade Entry and Exit criteria using TEMA? Explain with Charts. (Screenshots required).
By using TEMA trader can get Entry and exit signals using different strategies. I will talk about famous strategy which is Crossover. I have talk about this above now i am going to talk about this in depth. For crossover strategy trader have to select two TEMA indicators one having shorter period and another having longer period. When the crossover between these two happen it gives us entry and exit signals accordingly. For this i will select shorter 20 TEMA and longer 50 TEMA combination.
Buy or entry criteria
When the shorter 20 TEMA crosses above the 50 TEMA Line it gives us signal of uptrend market. I will wait for few bullish candle formation and then i will take entry in the in that asset . i will also use proper stoploss and target. I will set the stoploss below the crossover.
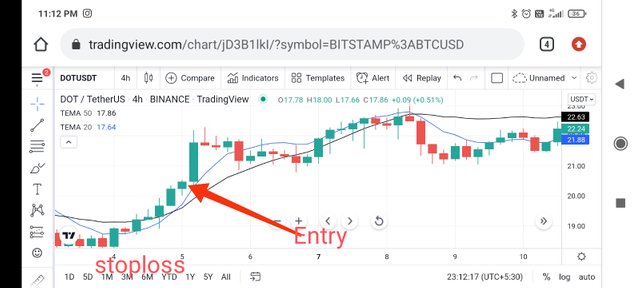
Image source trading view
As the 20 TEMA line crosses above the 50 TEMA line it gives sigal of bullish trend in market. I take buy or long position after two candlesticks conformation. I set stoploss below the crossover or below support level.
Sell or exit criteria
When the shorter 20 TEMA crosses below the 50 TEMA Line it gives us signal of downtrend market. I will wait for few berish candle formation and then i will take entry in the in that asset . i will also use proper stoploss and target. I will set the stoploss above the crossover.
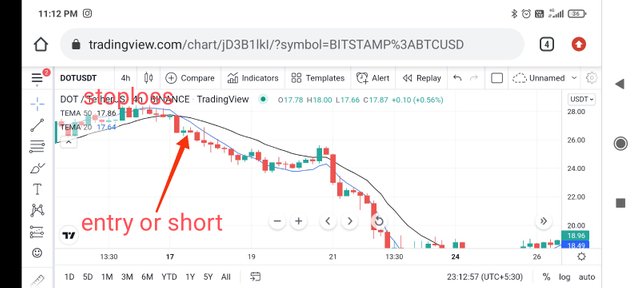
Image source trading view
As the 20 TEMA line crosses below the 50 TEMA line it gives sigal of berish trend in market. I take sell or short position after two candlesticks conformation. I set stoploss above the crossover or above resistance level.
Use an indicator of choice in addition with crossovers between two TEMAs to place at least one demo trade and a real margin trade on an exchange (as little as $1 would do). Ideally, buy and sell positions (Apply proper trade management). Use only 5 - 15 mins time frame. (Screenshots required).
For this question i will use RSI indicator in addition with crossover between two TEMA's for demo and real margin trade. Lets know first little bit about RSI indicator. RSI indicator means relative strength index. In this indicator there is price line which moves between two extreme position 0 and 100. RSI gives signals of Oversold and overbought conditions. When price line moves above 70 it is overbought condition and when it moves below 30 it is oversold condition.
Demo trade
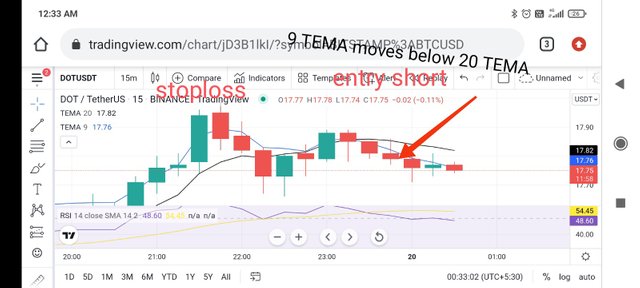
Image source trading view
Look at the above dot-usdt chart. I have added two TEMAs one 9 TEMA and another 20 TEMA. We can see that the shorter TEMA crosses below longer TEMA that gives us signal that market will go into the berish mode. Also look at the RSI indicator the price line is at below 50 and moving in downward direction which also tells us market will move in downward direction.
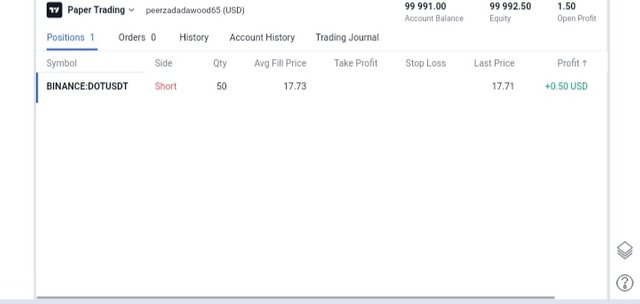
Image source trading view
Look at the above i have made a demo trade on trading view paper trading. I have make profit too by this signal.
Real trade
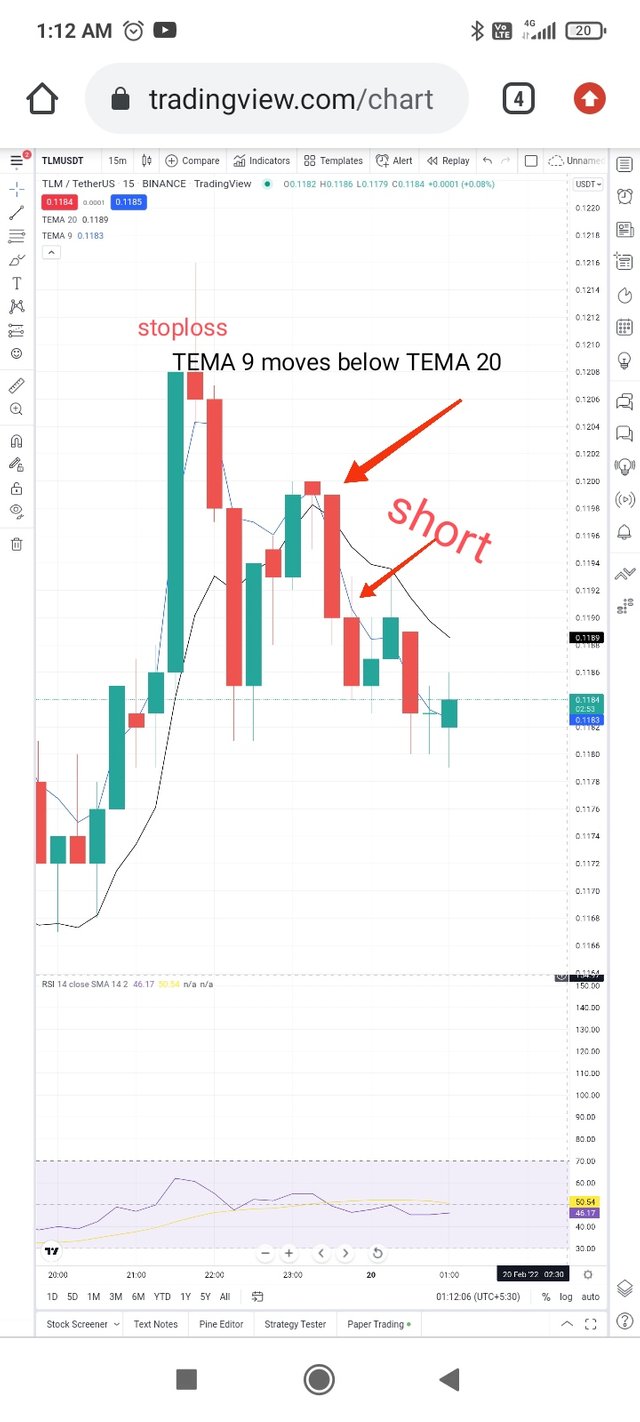
Image source trading view
In this Tlm-usdt chart i observed that shorter TEMA crosses below the longer TEMA 20 gives signal that berish market is coming. I also look on rsi indicator where i found RSI line is below 50 and moving downwards which tells same thing so i make short position here on my binance app.
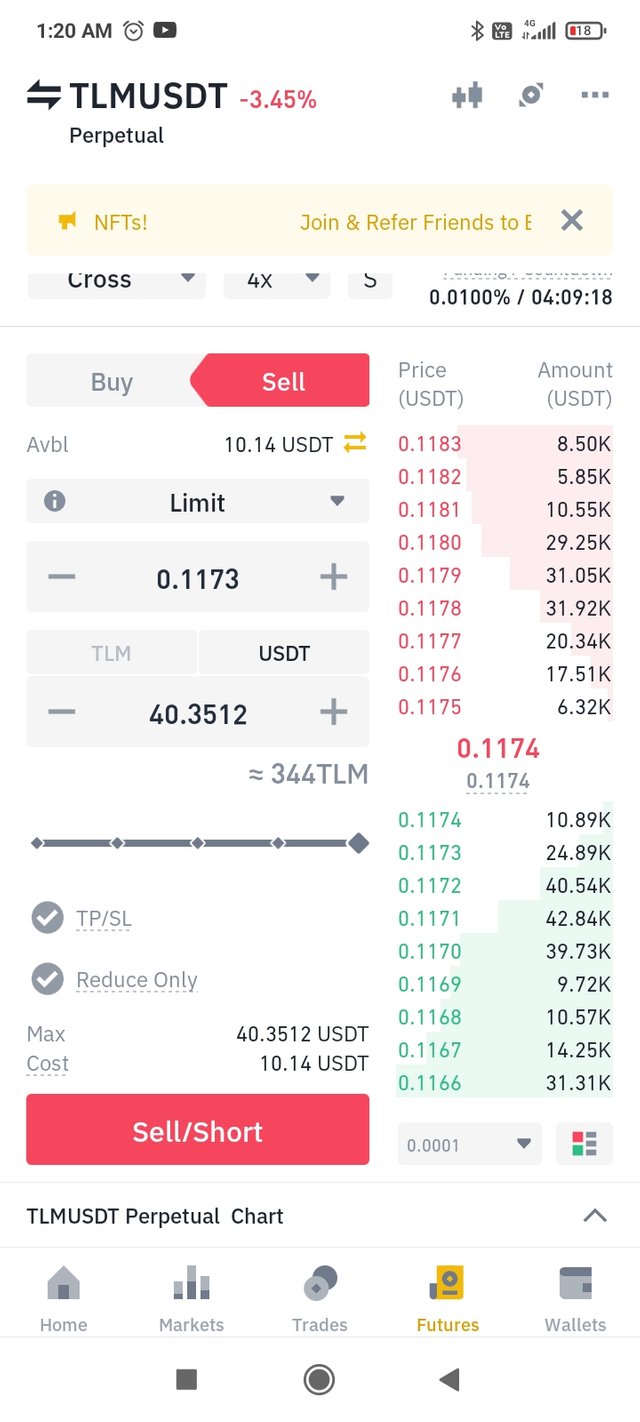
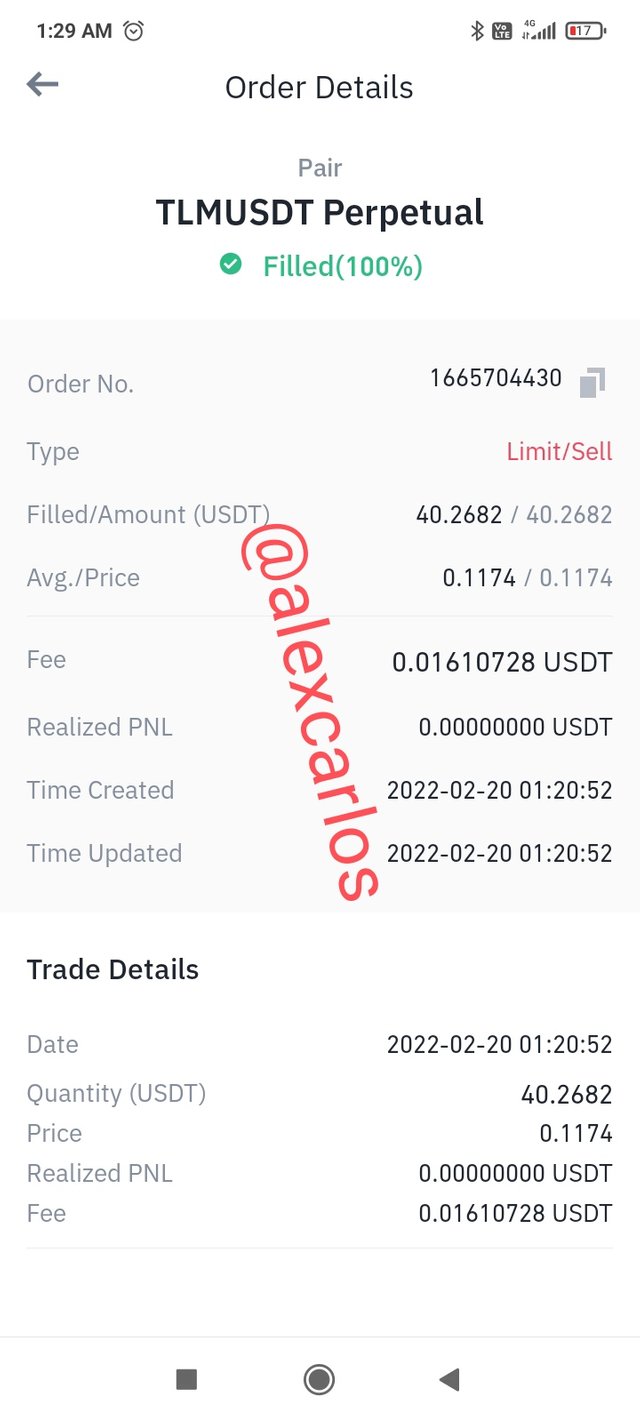
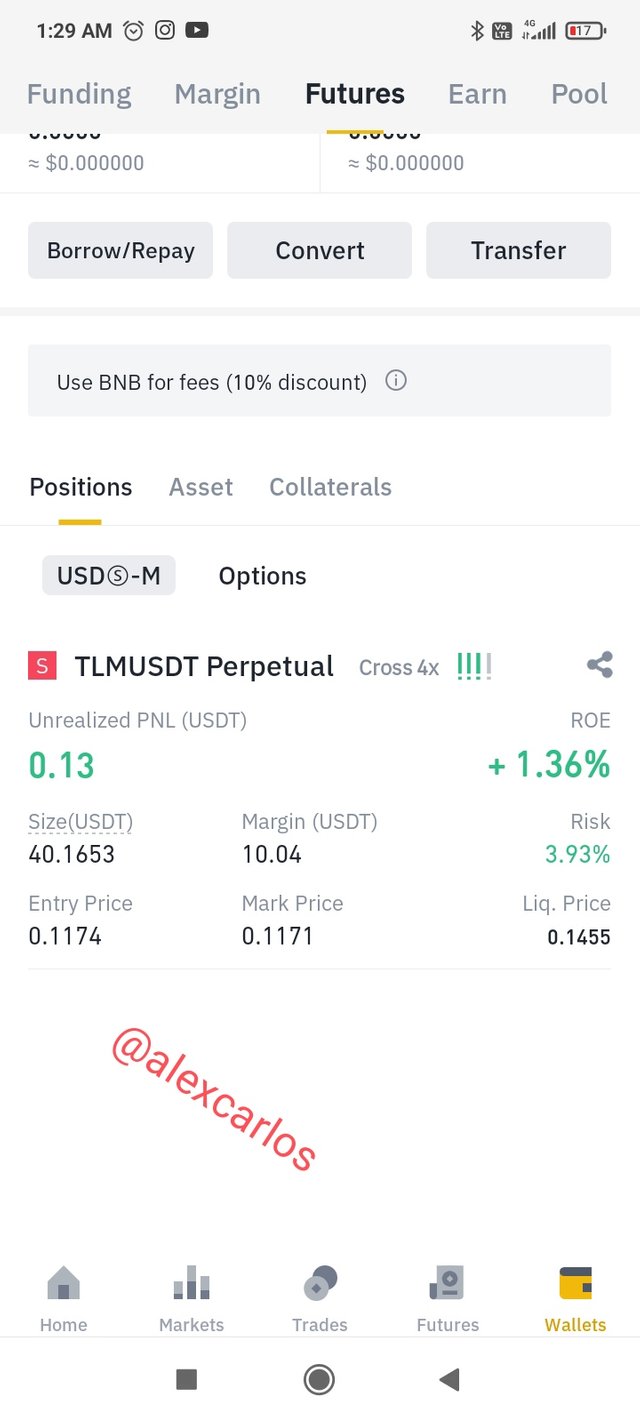
You can see i have done this trade on binance app and make profit too.
What are the advantages and disadvantages of TEMA?
Advantages of TEMA
Triple Exponential Moving Averages reduces lagging compared to other Averages.
TEMA is vary easy to understand so a new trader can use it easily.
With the TEMA we can easily find the trends in market.
TEMA reacts price vary quickly than other moving averages so it gives signals on time.
Signals provided by TEMA are more accurate than other moving averages.
With the crossover strategy we can easily find buy and sell points.
Disadvantages of TEMA
During the volatile market when price moves up and down TEMA produces false signals.
Triple Exponential moving Averages also provides false signals in sideways market.
Crossover may not result in sustained move as long as market remains in rangebound, TEMA may produce false signals here.
TEMA reacts faster to price change which sometimes may lead in wrong direction and may mislead trading into wrong trade.
Conclusion
Triple exponential Moving is one type of moving averages which is used by lot of traders to generate trading signals. TEMA is same like other Moving Averages but it reduces lagging and noise present in other moving averages. TEMA responses quickly according to price. With the TEMA we can easily find out the market trends. Also with the TEMA we can easily find the buy and sell signals. TEMA can be used for both short and long term trading. TEMA indicator sometimes produce false signals in order to filter out these wrong signals use this in combination with other indicators like RSI and many more.
THANKS
Thanks professor @fredquantum for such a informative lecture.