I will like to thank crypto prof @stream4u for exposing me to this technical analysis and in fact i love the lesson for the week .
I will take all the task in simple langauge for all beginners like me to read and understand better .
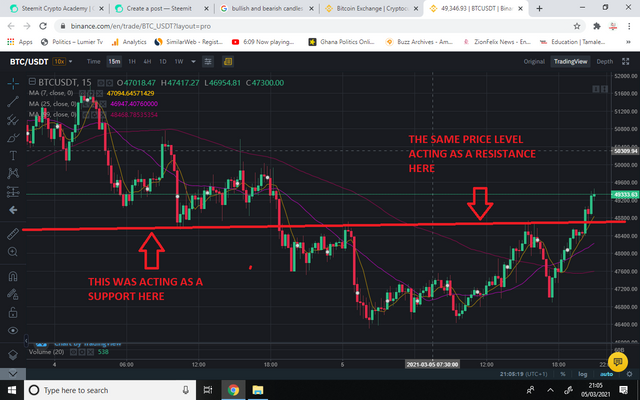
First of all let study the graphic below careful because i have detail info there :
.png)
From the picture above we can see how initially the red line was acting as a support preventing the price to fall but later on the price broke through and went down , now the price started risinfg to that level again and finding it difficult to break through . hence the same point is acting as resistance now .
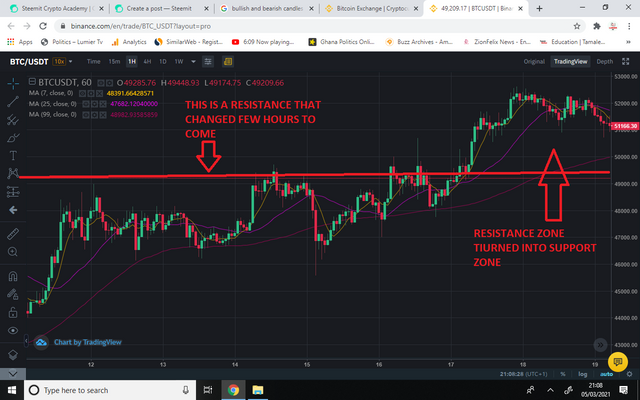
This also happens like the support becoming a resistance , here the resistnace is broken and the prive rise to certain level and turn to come back to the old resistance but this time i will be difficult to break it down hence it becomes a suppport , the image below expalain it better .
.png)
This is usually lines or graphs that show the actions of certain pairs ,they provide traders with buy/sell information , they are used by both long term and short term traders as well as investors .
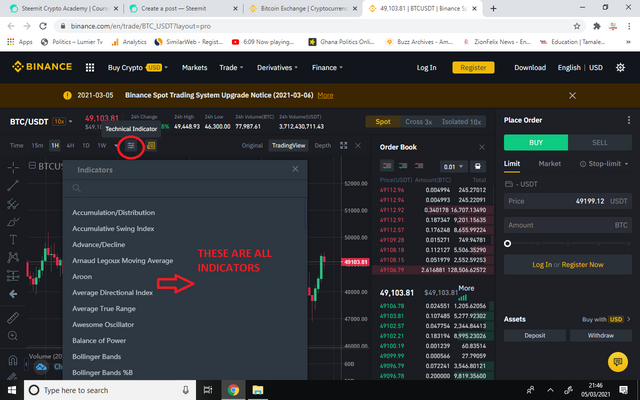
from trading view of binance chart click on the option below as shown in the image to get acess to the technical indicators
.png)
Let look at the Relative Strengh Index ( RSI) am example of indicators that can be found on the binanace exchange platform .
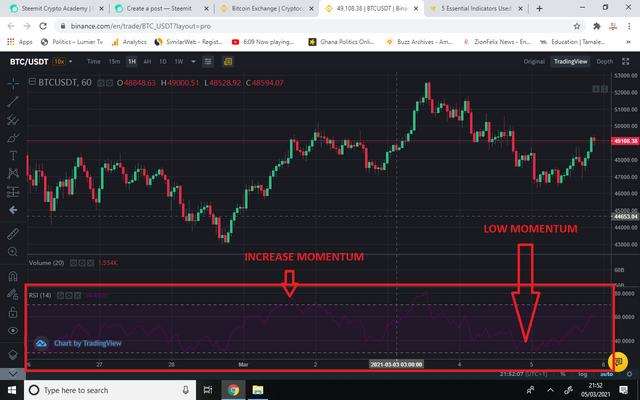
RSI is an indicator that provide information about the price of a coin , it shows whether a particular coin is over bought or over sold , i show a sign like an oscillation curve as shown in the picture bellow , RSI sometimes tells a trader to becareful , let say prise is increased an momentum is high it teall you that more buyers are coming in , when the moemntum is low is an indication that the price is high but the holders are selling it .
check it below , i have used a red rectangle on it chart :
.png)
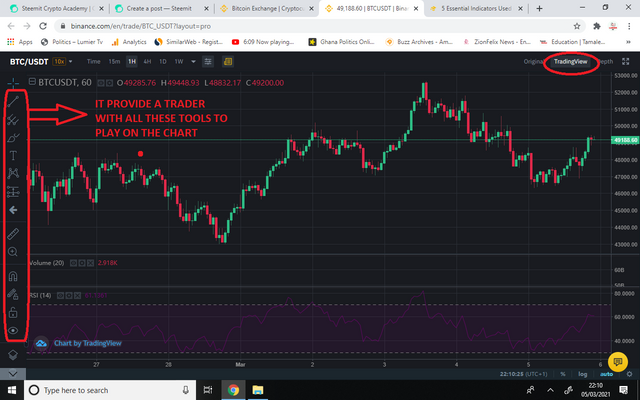
This is a for of appearance of the chart we read on our various exchange platforms , in binance on can set up the way he/she want to view the chart either original , depth or trading view .
as a young trader i prefere trading view most because it provides me with tool thatallow me to play with the chart in anyway i feel i will undersand and read my own candles .
check the image below :
.png)
The 200 hundred moving average is an indicator that show you how an sset can be profitable for a period of time , usimg binance this is not easy to ving among the indicaors list .
you have to select average movement , format it and select the 200 lenght period as shown below :
.png)
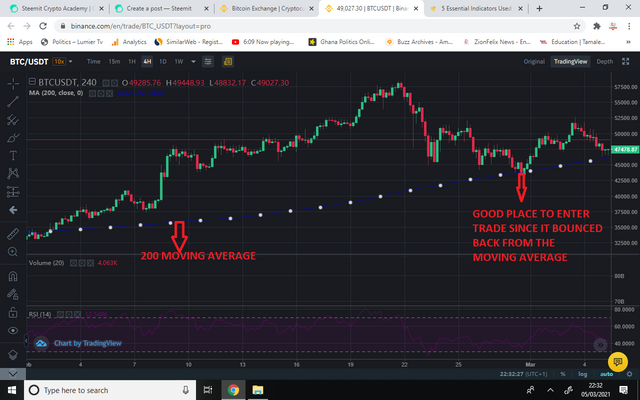
Now studying this average one should be able to know when to enter trade and when to take profit out , the average line to me sometimes is regarded as my support and resitance , and how the are broken.
study the chat below :
.png)
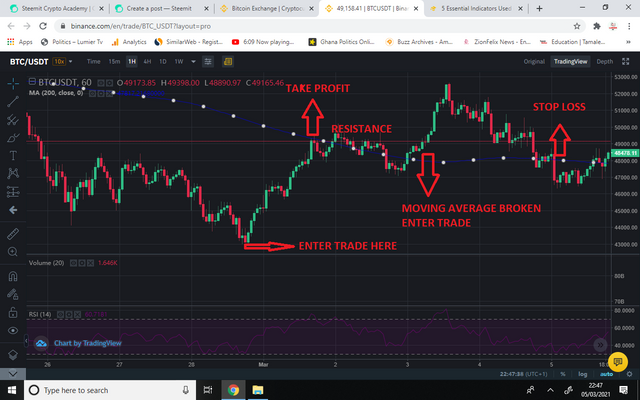
When the price is above the 200 moving average you enter the trade one it hit the line but do not cross it abd take profit at the resistance you might have set ,
Whe the price is below the moving avaerage you can enter trade bellow and take profit at the line when the price comes to hit thr moving average , in other ways one can enter trade when the price below the moving average comes to stike and break the line up. From the picture below i explain everything simple in a summary
.png)
Finaly i will like to thank my best crypto prof @stream4u , @steemitblog,@steemcurator01, @steemcurator02 for this gret oportunity.
Hi @alhajibabajnr
Thank you for joining Steemit Crypto Academy and participated in the Homework Task 4.
Your Homework task 4 verification has been done by @Stream4u.
Thank You.
@stream4u
Crypto Professors : Steemit Crypto Academy
Downvoting a post can decrease pending rewards and make it less visible. Common reasons:
Submit
guidance feed and suggestion noted with all due respect
Downvoting a post can decrease pending rewards and make it less visible. Common reasons:
Submit