
Brief introduction and history of algorand Blockchain and algo coin
Algorand supports Dapps, NFTs and smart contract computations.On the other hand algorand is also addressing the blockchain trilemma, which is scalable,secure and decentralized. Algorand is here to help business to make a smoother transition from a usual technology to Blockchain technology. Now taking about the algo it is actually the native token that is present on algorand blockchain. It has similar purpose like Ethereum token on Ethereum network and Cardano ADA token on Cardano blockchain.
Algo coin is used to pay for transaction fee which is there on the network, and also used to secure the network and for staking. Algorand uses the PPoS mechanism which is pure proof of stake consensus mechanism. Algorand work in two step process. First one is block proposal phase and number two is block final phase. Both of these are called cryptocurrency sortition.
As I open the coin market cap of Algo of algo coin, I saw a lot of information was there to see including the current price of aglo coin, market capitalization, Volume of algo coin and also total supply of the aglo coin and also the ranked among cryptocurrency.
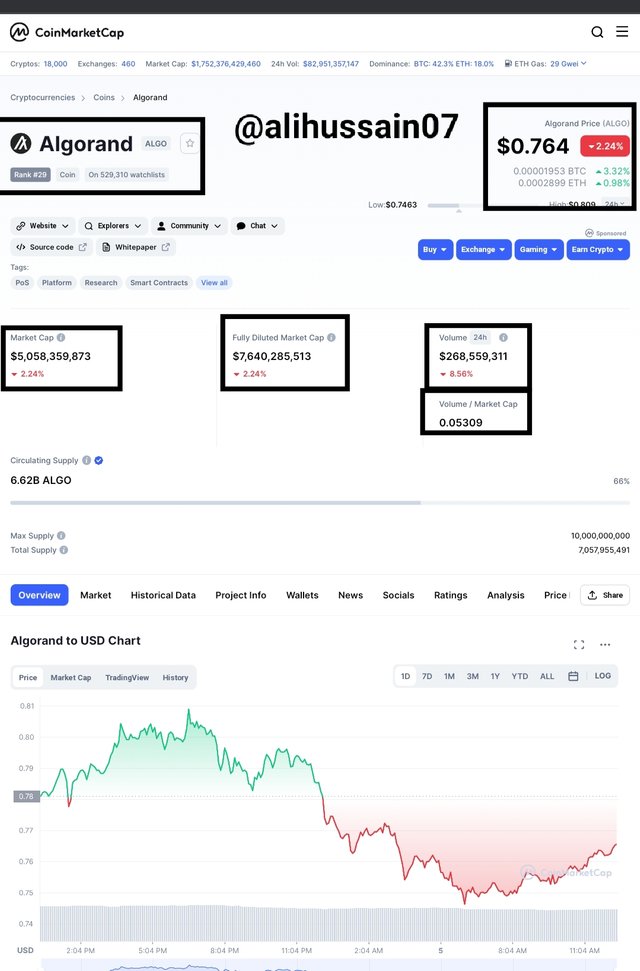
In order to see the exchange that listing algo coin open this and than click on the market and you will see the list of exchanges having aglo coin.
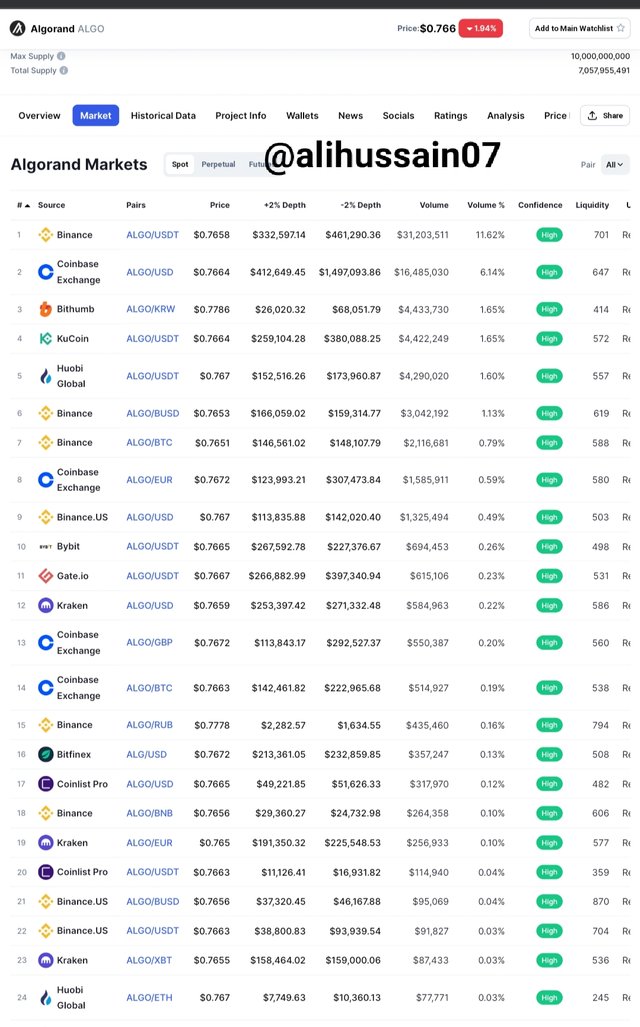
Market value of aglo coin can also be seen on the coin market cap of aglo.
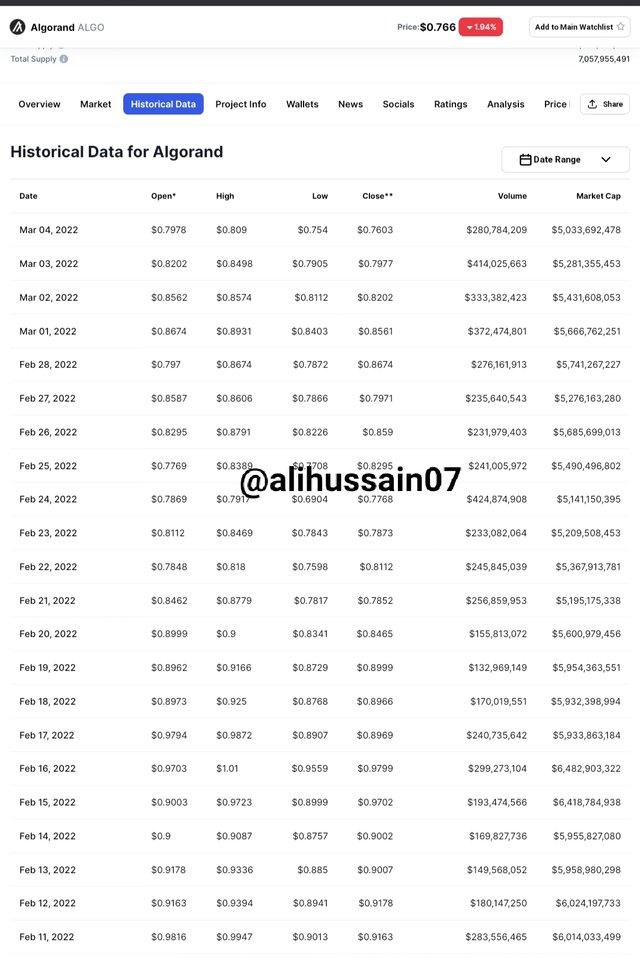
Why are you optimistic about this token today, and how long do you think it can rise?
One the most important benefit of algorand Blockchain is that it claims to be completely carbon neutral. Its totally green blockchain that has very low emission level as compared to other blockchain out in industry. It is the plus point of this blockchain because in new businesses and the government wants more greener model. So due to its greener model it will Select by most of people and government and hence make progress.
Another advantage of aglo coin blockchain is that its code can not be changed once it is done. So this also saves this blockchain from possible cyber attacks attacks and anyhow if there is a cyber attacks and blockchain os compromised, there still be no effects on the transaction which already taken.
Another reason why I am optimistic is that on this blockchain there is a capability of 1000 transaction per second which is quite good as compared to other blockchain current benchmark. There is also low transaction fee to create the basic layer 1 smart contract. Only you need to pay just 0.001aglo coin.
How to analyze the token? (using the analysis knowledge learned from professors’ courses) —- important part
Technical analysis is primarily used to identify the next trend as early as possible. This gives the trader the opportunity to ride the trend and take advantage of the potential rally. Such as price pattern as heads and shoulders, trend lines guide traders to navigate the financial markets. Others strategies of support resistance can also guides the trader to find the market trends.
Parabolic SAR
Parabolic SAR is one of thr most simple and easy technical analysis tool. It is also known as simply SAR and it is used to determine the trend reversals, as wll as, the ongoing trend of the market. This indicator is commonly used by the traders to make profitable decissions in the market by determining the market trends.
The Parabolic SAR actually consists of a dotted line that can either move above or below the price action line. The trends of the market can be determined by looking at the position of movement of the dotted line of Parabolic SAR. This indicator can also be used to determine the strength of the market trends. When the distance between the dots of Parabolic SAR is large, the trend will be considered as a strong trend, and vice versa.
The trends of the market can be determined according to the given points.
When the Parabolic SAR line is moving above the price action line then the market trend will be Bearish trend. When three or more dots are formed above the price action line, it can be considered as good sell entry.
When the Parabolic SAR line is moving below the price action line then the market trend will be Bullish trend. When three or more dots are formed below the price action line, it can be considered as good buy entry.
Let's have a look on a chart on which the Parabolic SAR is applied.
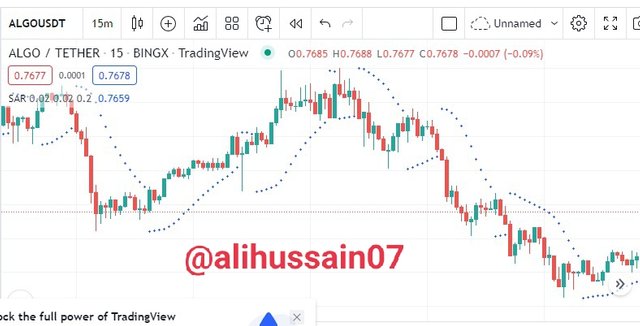
In the above image, you can observe that when the dots of Parabolic SAR were moving above the price action line, the market trend was downward (Bearish). And, when the dots of Parabolic SAR were moving below the price action line, the market trend was upward (Bullish).
Exponential Moving Averages (EMA)
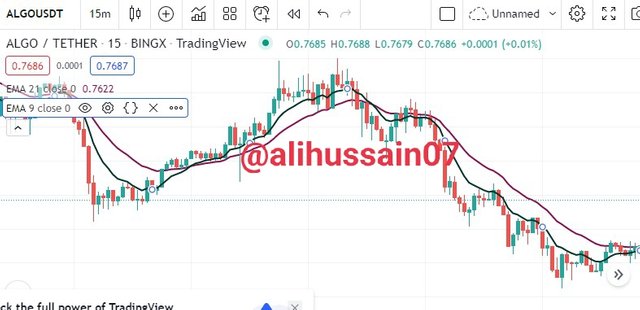
Exponential Moving Averages is also one of the most commonly used technical analysis tools. It is used by many traders to make good entries and trading decisions in the market. EMA actually consists of two lines that move above or below the price action line. Exponential Moving Averages can be used to determine the trends reversals in the market. The signals that are given by the EMA are mostly very strong and true.
There are actually two line, one of them shows the average prices of the long period of days while the othed line shows the average prices of the short period of days. The short days moving average moves faster than the long days moving average. The trend reversals can be determined by breakout of these lines over each other. We can modify the days length of each EMA line according to our trading strategy. The trading decisions can be made in the market by considering the following two points.
When the long days moving average makes breakout on the short day moving average and started moving above the short day moving average, the Bearish trend reversal signal can be noted.
When the long days moving average makes breakout on the short day moving average and started moving below the short day moving average, the Bullish trend reversal signal can be noted.
You can see these conditions of the EMA lines in the below screenshot.
Simple Moving Average (SMA)
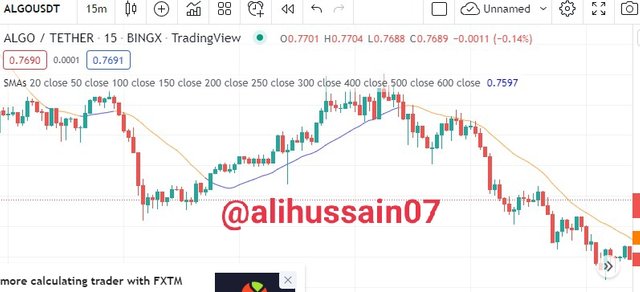
Simple Moving Average or SMA is the most simple technical indicator that is used by many traders to determine the market trends and make entry or exit decisions in the market. It simply consist of a single line that can move either above or below the price action line.
- When the SMA line makes a breakout on price action and started moving above the price action then a bearish trend reversal can be noted.
- When the SMA line makes a breakout on price action and started moving below the price action then a bullish trend reversal can be noted.
You can see in the below screenshot that how this indicator can be used to determine the market trends and making trading decisions.
Real trade on binnance
After the above explanation about different types of indicator now I will apply those indicator for my real trade on binnance.
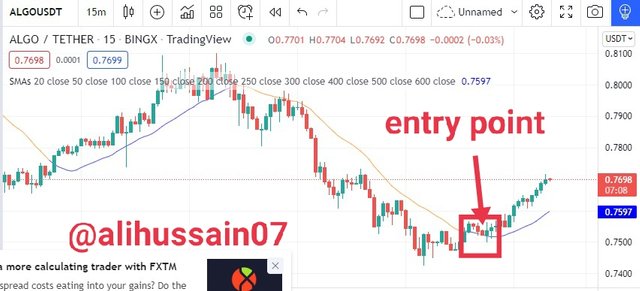
1st of all trade is confirmed with the help of simple moving average indicator. As you can see that line in simple moving average is below the candles which is a buy trade and I have circle that where crossing occurs that point is the buy point .
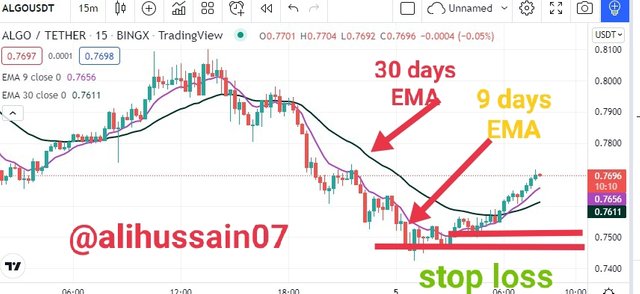
Next is the exponential moving average indicator
- Here one EMA indicator is the average of 30 days.
- Other is the average closing price of 9 days EMA indicator.
- 9 days EMA is on the top of 30 days EMA means shorter days EMA is above the long days EMA.
- This also indicate to enter buy zone.
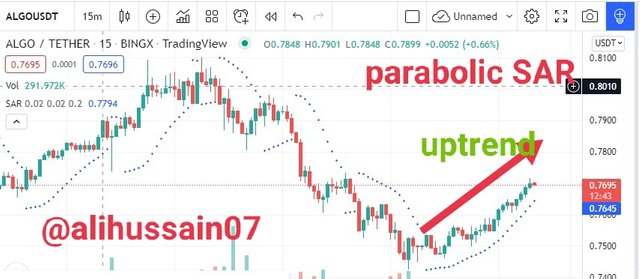
Now in third indicator parabolic SAR also gives the same trend of enter as buy.
So after That I go for future trade
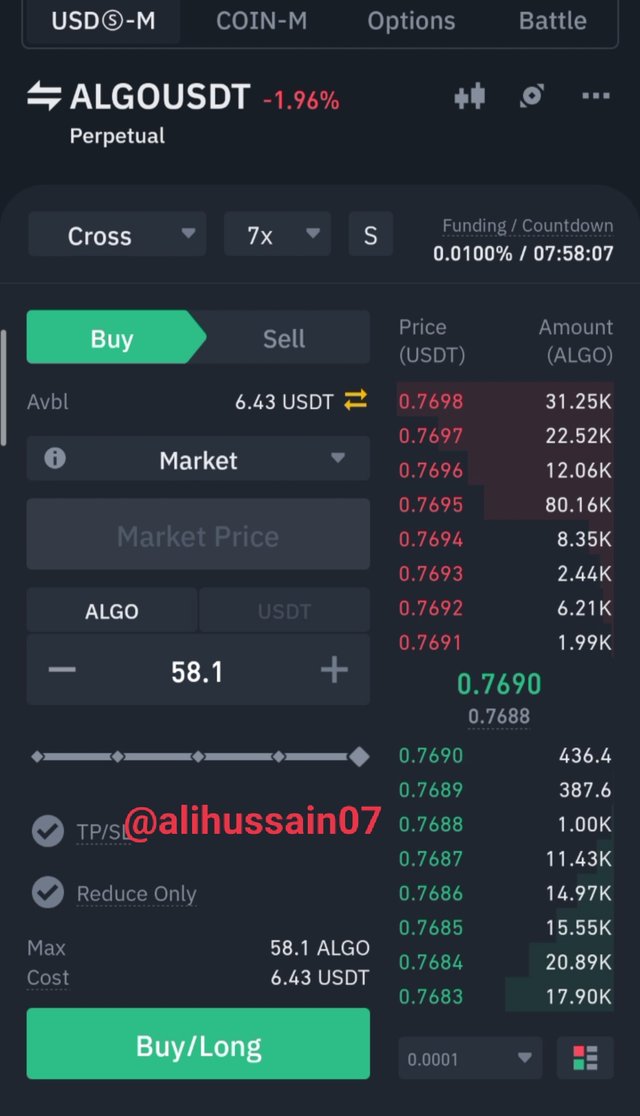
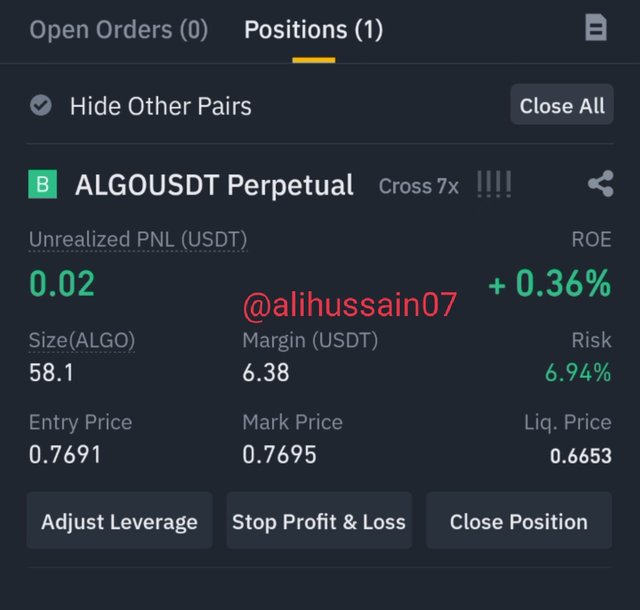
Your plan to hold it for a long time or when to sell? Recommendation to others?
My point of view about this trade is that I have set my stop loss here and also I set take profit on my binnance exchange which is at 0.7720 usdt where I will get my profit. So it means I will do trade between this period from my stop loss to take profit at my set price.
As suggestions for other is that I am not perfect trader who can suggest others for some trader because it is the case of real trade and money of others. So its for all that they must learnt about technical analysis so after that they will able to predict the market and able to make profit.
Additional information about the Algo coin

Conclusion
In this lecture of trading contests I prefer to write and trade about the algo coin on binnance exchange. At first I explained some Basic history about algo coin and its advantage such as low fee and also high rate of transaction. Then I give some my point of view about why I am so keen to write about this coin. In the next part the most important thing that is using Indicators for trading purpose. I explained simple moving average indicator, EMA indicator and also parabolic SAR indicator. After that I made a trade and than tells bout the stop loss and about taking profit. In the last I gives some additional information related to Algo coin.
Cc:-
@steemcurator02
Downvoting a post can decrease pending rewards and make it less visible. Common reasons:
Submit
No professor I ended the trade after 3 to 4 hours of filling the form and I did not know the procedure that I have to told the loss or profit.. now I have posted the prove of my trade. Kindly havea look
Downvoting a post can decrease pending rewards and make it less visible. Common reasons:
Submit