Hello friends I am Good hopefully you all are fine there is my homework task so let's Start.
Theory (no images)
1-Define in your own words what is the Stochastic Oscillator?
2-Explain and define all components of the Stochastic Oscillator (% k line,% D line + overbought and oversold limits).
% K line.
This line is considered a stochastic reference. This line shows the real value of inflation It is a fast stochastic line. This line is calculated by subtracting the lower price acquired over a period of time from the newly closed price and dividing the result by the highest difference in price and the lowest possible price. Let’s take a look at the mathematical formula below.
% K line = [RCP - LPT] / [HPT - LPT] × 100
% K = Stochastic line
RCP = Recent Closure Price
LPT = Low Price For Sale
HTP = Maximum Sold Price
% D line: -
%D = Average % K / over periods
This is the second line of the stochastic pointer. This line is not as fast as% k line. This line is based on line% k. It is a continuous moving line in the middle. It is considered a slow stochastic oscillator. This line is important because it gives traders a signal.
Traders look at the cross of both the% k line and the% D line to take a possible trade.
Oversold Limit
As mentioned earlier, the stochastic oscillator is tied. Ranges from 0 to 100. For the material to be overheated, the stochastic line will penetrate below a certain width. When the stochastic line appears below 20, the property is said to be overlooked. And this usually happens after a long bearish move so that the stochastic line reaches below 20 degrees This is used to show.
Overbought limit.
This is against the override. Assets are said to be monitored if the stochastic oscillator is visible within 80 to 100. This helps determine the market situation over time.
3-Briefly describe at least 2 ways to use the Stochastic Oscillator in a trade?
Detecting trend conversions
The Stochastic Oscillator is among others used to detect potential trend reversals. After a commodity moves to a particular trend whether it is bearish or bearish, the movement of the stochastic line at that moment helps traders know how the ongoing trend is about to return. For example if an asset progresses to a bullish trend and reaches a point where the stochastic line enters the over-bought region, a continuous trend reversal may occur in the corner.
Trading Signal
Another important stochastic oscillator is the trading signal. The two lines% k and% D are used directly to enter trades depending on the merchant experience. For example when a property enters a larger region and two stochastic lines cross the top, You can provide a good buy signal. And if the goods enter an overly purchased region and these lines meet, the trader may consider a sales order.
Support and Resistance.
Stochastic oscillators also help traders know the location of support and resistance. In addition this provides guidance on the demand and location of the goods.
4-Define in your own words what is Parabolic Sar?
Parabolic sar is another good indicator made by J. Welles Wilder. This indicator is used to determine price orientation and possible changes in an asset trend. The indicator is also known as the Stop and Reverse (SAR) indicator. This shows where the price stands and returns and that is why it is used to get price guidance and reversal. It is also used to make an entry and exit point for a merchant order. In addition this index remains effective for a leading asset. It is very powerful indicator that when combined with another indicator it gives 70 to 80% success.Unlike other indicators,this index is unique in that it is represented as a series of dots on a chart. This dot remains near the lampstand, bar or chart pattern used by the trader. And many retailers are looking at a change in the dynamics of these dots in order to position themselves in terms of possible order. The trend is considered a bullish signal when the dots appear below the current price. Otherwise it is considered a bearish signal. Compared to the middle moving indicator it is similar in that it travels much faster than normal moving. Using this guide alone is not recommended it is preferable when combined with another index.
5-Explain in detail what the price must do for the Parabolic Sar to change from bullish to bearish direction and vice versa?
With a bullish or upward trend the sar parabolic appears below the asset price. The price continues to rise while the corresponding dots continue to lie below this price. For the sar parabolic to change from a bullish direction to a bearish direction the price should affect the sar parabolic. In that case a higher rise will reverse the direction of the bearish trend.
Also in the bearish trend, the sar parabolic dot is set above the price. As long as the trend continues in the bearish direction, the dots continue to lie above the price bar. In order for the sar parabolic to change from a bearish direction to a bullish trend the price should affect the parabolic sar up and down. This would mean postponing the ongoing trend.
6-Briefly describe at least 2 ways to use Parabolic Sar in a trade?
Entry signals Generator.
The first way we can use this indicator is like an input signal generator where the dots from the upper price are below the price this gives us a potential buy option and where the dot goes from low to high price this also provides us with a potential trading opportunity.
However it is very important to note the following point we do not just go into trading every time Parabolic SAR gives us a signal. Instead we will create a trading concept for what we see on the charts first, and then we will use Parabolic SAR to validate our entry.
So let's use the trading example of this here we have a side market and we put a strong pressure to go bad when we get to the support level and double the high prices that stop here and refuse to make the market resistance and spend good time between these two levels of support and good resistance now let's add Parabolic SAR on our charts you will see that the dot goes from being above and below the price most often while marketing is attached to this list is what we talked about earlier when we were discussing false entry signals so how do we go around waiting for the price to go down without this list.
Exit signals Generator
The second way we can use Parabolic SAR as an exit signal Here we have a market that returns the second support here when we enter the trade in this area we can use Parabolic SAR as an exit signal Now there are a few ways you can do this one of the best ways to wait three consecutive dots we turned the buy trades so we would wait for three consecutive dots to rise above the price before the trade exits we see a strong rise in resistance and then continue to rise sharply eventually we have three consecutive dots above the price here so we will use this opportunity to close our trade if, instead of trading. and just wait for the opposite to happen in this case which would mean three dots in a row to appear below i price you can use even dots of parabolic acid to appear below your price n until I use PowerBolic SAR to track your weight loss stop here's how to do it.If you enter a buy trade you will set your stop loss to a lower price point at your entry point. As the dots in Parabolic SAR go up, then you will move your stop loss up next to it.
Practice only use your own images.
It shows a step by step on how to add the Stochastic Oscillator to the chart (Indicating the% k Line and the% D Line, the overbought and oversold zone?
First go to https://www.tradingview.com/

Home page.
tradingview
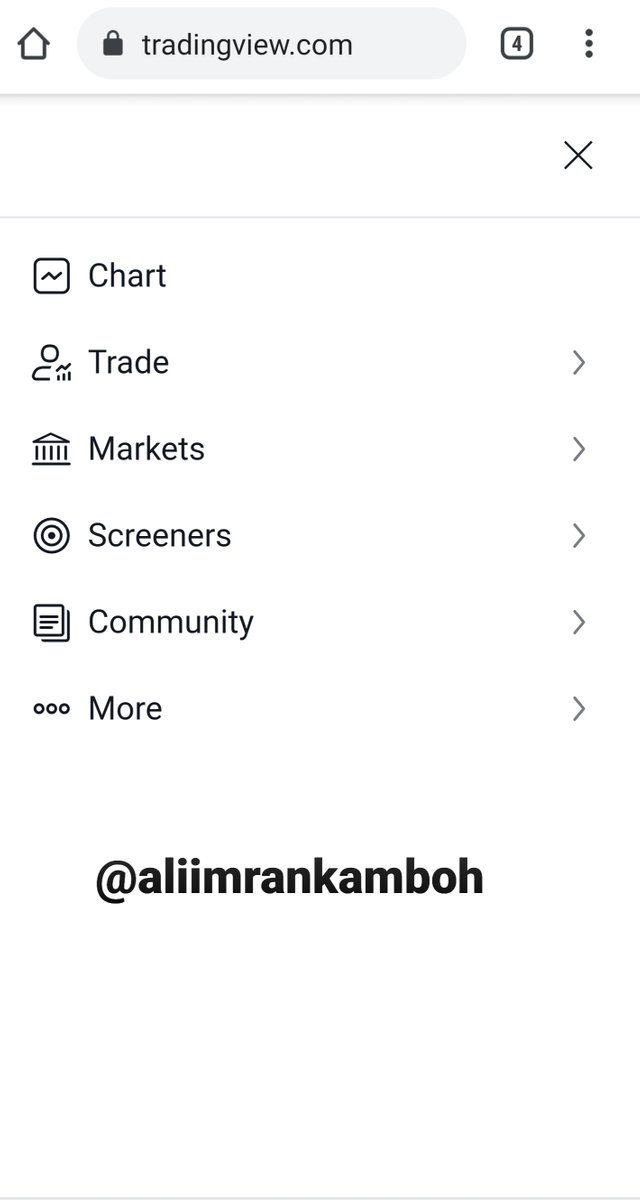
Click on the three horizontal line as indicated by a arrow sign in the screenshot below

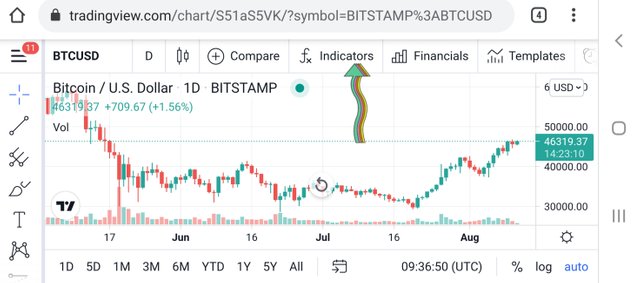
click on charts option.
At the top of the page locate an indicator icon and click here This icon is indicated by a arrow check the screenshot.
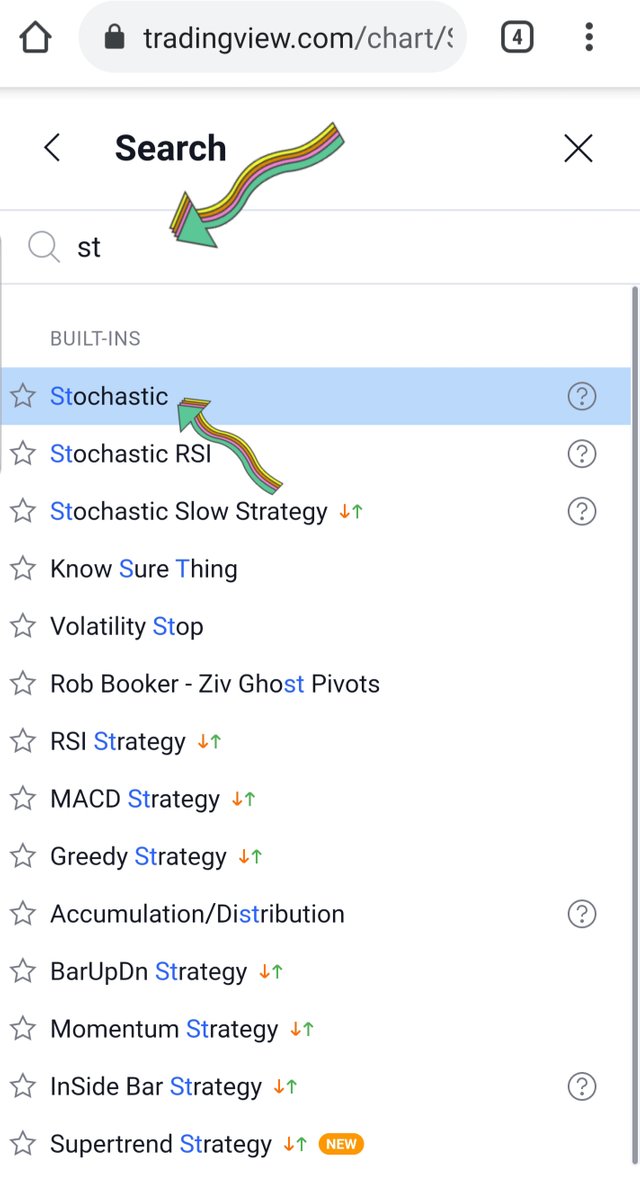
type stochastic in the search bar and click it.check screenshot below.
tradingview indicator page.
The %k line is purple line while the %D line is yellow line.
The oversold region zone starts from 20 downward and overbought zone is from 80 to 100 check below screenshot.
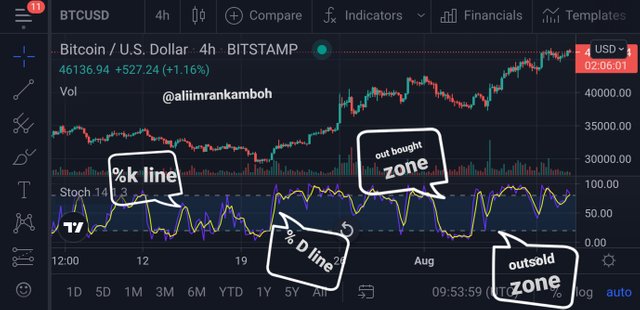
Stochastic Oscillator Chart
tradingview
Show step by step how to add Parabolic Sar to the chart and how it looks in an uptrend and in a downtrend?
again visit trading view
step 1
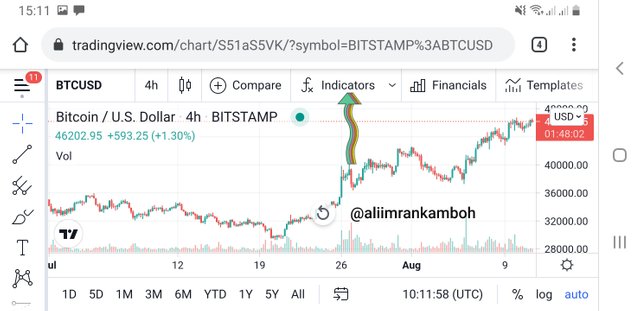
To Add Parabolic Sar Tradingview Click on Chart Indicator option.
Step 2
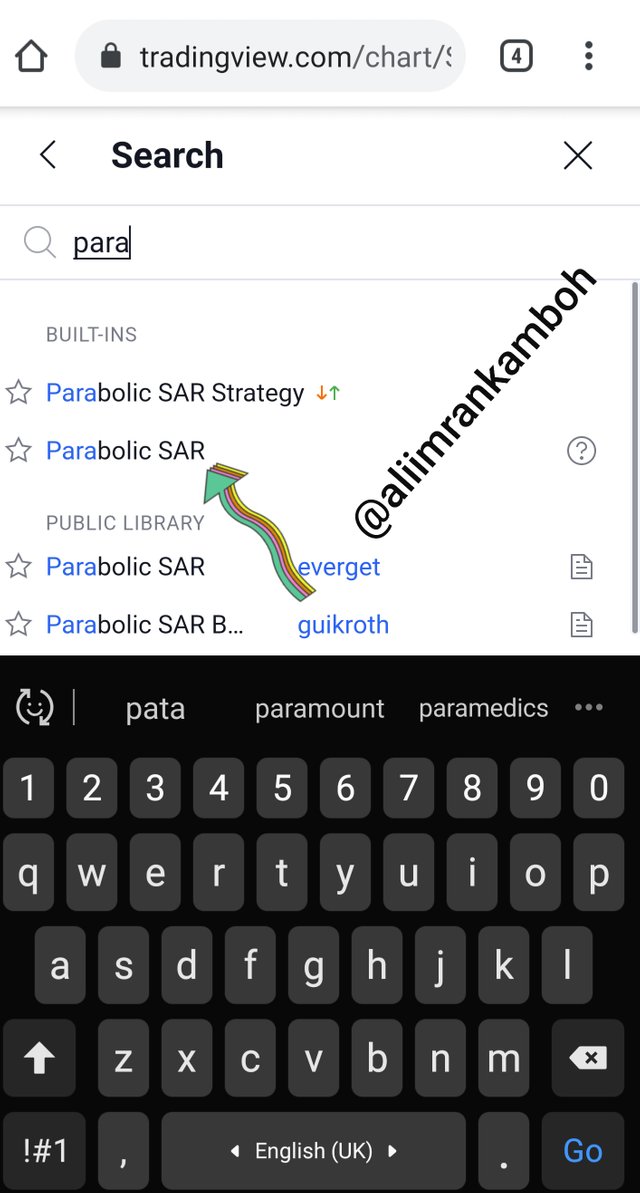
After click on the indicator search option search Parabolic SAR check below screenshot.
Step 3
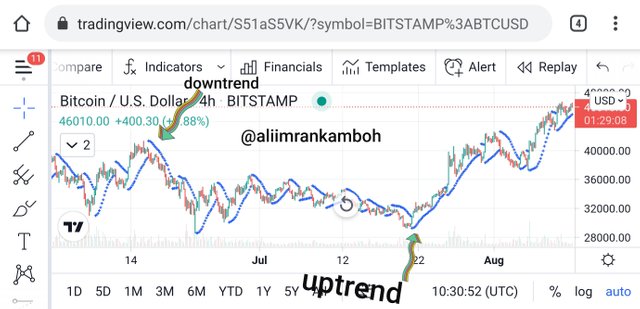
click on Parabolic SAR after clicking on Parabolic SAR here is a added chart lets see below screenshot.
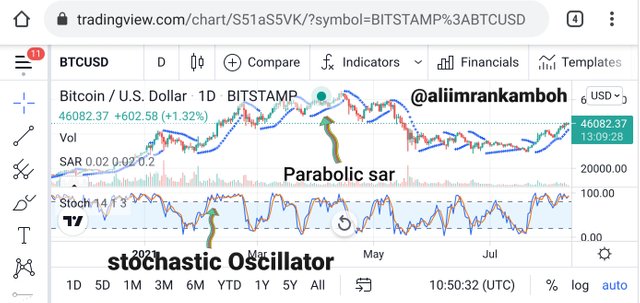
3-Add the two indicators (Stochastic Oscillator + Parabolic Sar) and simulate a trade in the same trading view, on how a trade would be taken?
tradingview
The commercial simulation I did in the picture above is for the following reasons From the screenshot above, the blue k% k line crossed the% D line in the over-buying region that showed the return signal.
In addition, the price exceeds the graphic isar originally moving below the price at a higher point near the same point the oscillator line falls.The parabolic sar changes direction from bullish to bearish.
CONCLUSION
Both the stochastic oscillator and the parabolic indicators are good when combined. This will help traders take the most likely trade. From a talk given by an acclaimed professor @lenonmc21. I was able to add two pointers to the chart successfully. In addition, I was able to simulate trading in tradingview using two indicators.
Wriiten by @aliimrankamboh
CC: @lenonmc21
