Hello again my friend @kouba01. Thanks for another class done with care and dedication. As I have said before, the technical classes are one of my favorites because they teach me tools that I can then apply to my trading. Precisely the MACD is one of the best tools I have learned so far.
Let's start.
 Image edited by me in Powerpoint. Central image taken from Source
1- Access the chart where you want to place the indicator, in my case it is ETH/USD. Then we must click on the "Indicators" icon just where the arrow indicates
2- An Indicators and Strategy window will be displayed. Then in the blank field, we must type "MACD". A list will be presented, select the first one marked with the arrow.
3- When closing the previous window we will be able to see the MACD indicator just below the price chart. To configure its parameters, click on the "settings" icon. This option will allow us to modify the characteristics of the MACD line and the signal line.
4- A window called "Inputs" will be displayed in which we will place the parameters. For the MACD line "fast length=12" and "slow length=26". For the signal line "signal smoothing=9". Finally click on the "OK" button.
Finally, the histogram is automatically configured depending on the MACD line and signal line values.
The parameters of (12, 26, and 9) were set by default since the MACD indicator was created with daily charts in mind, the most common timeframe in the 1970s. Therefore MACD under these parameters is more beneficial in a 1D timeframe chart.
The values of (12 and 26) correspond approximately to the half-month and one-month EMA. Through the union of these two parameters, we can know the behavior and the trend of the market, since the "fast" parameter 12 will follow the price closely and on the other hand, the "slow" parameter 26 complements the buy signal.
 STEEM/USD chart, image edited by me, taken from Tradingview Source, MACD main line in blue; signal line in yellow.
 STEEM/USD chart, image edited by me, taken from Tradingview Source, MACD main line in blue; EMA 12 line in magenta; EMA 26 line in cyan.
 Litecoin/USD chart, image edited by me, taken from Tradingview Source.

BTC/USD 1D chart, FALSE SIGNAL.image edited by me, taken from Tradingview Source. BTC/USD 4h chart, REAL SIGNAL.image edited by me, taken from Tradingview Source.
 Litecoin/USD 1h chart, image edited by me, taken from Tradingview Source.
 SBD/USD 1h chart, image edited by me, taken from Tradingview Source.
 Image edited by me in Powerpoint. Central image taken from Source
1.1- What is the MACD indicator simply?
1.2- Is the MACD Indicator Good for Trading Cryptocurrencies?
1.3- Which is better, MACD or RSI?
2- How to add the MACD indicator to the chart, what are its settings, and ways to benefit from them?


3.1- How to use MACD with crossing MACD line and signal line?
 STEEM/USD chart, image edited by me, taken from Tradingview Source, MACD main line in blue; signal line in yellow.
3.2- How to use the MACD with the crossing of the zero line?
 STEEM/USD chart, image edited by me, taken from Tradingview Source, MACD main line in blue; EMA 12 line in magenta; EMA 26 line in cyan.
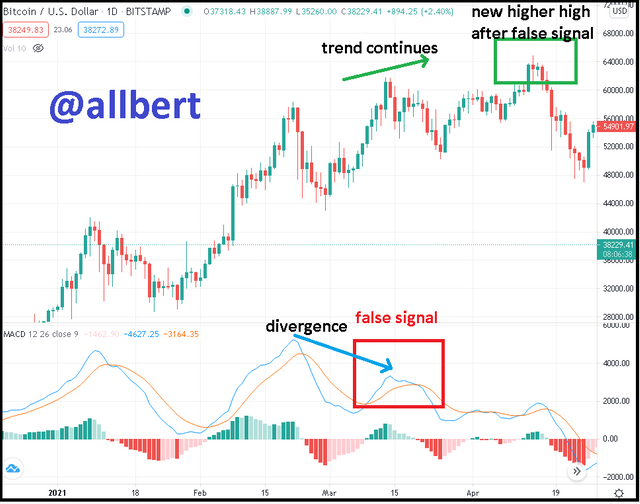
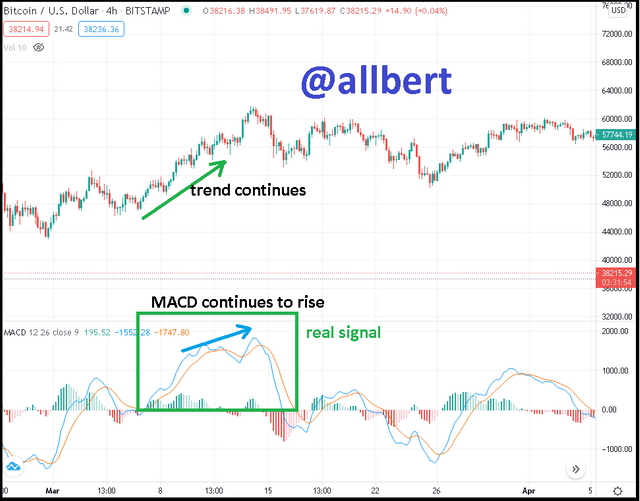
4- How to detect a trend using the MACD? And how to filter out false signals?
 Litecoin/USD chart, image edited by me, taken from Tradingview Source.
BTC/USD 1D chart, FALSE SIGNAL.image edited by me, taken from Tradingview Source.
 BTC/USD 4h chart, REAL SIGNAL.image edited by me, taken from Tradingview Source.
5- How can the MACD indicator be used to extract points or support and resistance levels on the chart? Use an example to explain the strategy.
 Litecoin/USD 1h chart, image edited by me, taken from Tradingview Source.
6- Review the chart of any pair and present the various signals from the MACD.
 SBD/USD 1h chart, image edited by me, taken from Tradingview Source.
After the selling point, the MACD declined to cross the zero line on May 21, confirming a new trend reversal.
The MACD line positioned below the zero line continues to fall and move away from the signal line, indicating that the downtrend has a lot of momentum. This signal is supported by the histogram which is falling away from zero. Finally, the downtrend is losing strength. This is confirmed by the histogram which begins to close at zero line. At the same time, the MACD line approaches the signal line until they crossed and then rises to start a new cycle.
Hi @allbert
Thanks for your participation in the Steemit Crypto Academy
Feedback
This is Excellent work done. Thanks for clearly demonstrating your understanding of the MACD trading indicator in such a detailed way. I enjoyed reading every bit of your article. Keep working hard by producing quality work in the Steemit Crypto Academy.
Homework task
10
Downvoting a post can decrease pending rewards and make it less visible. Common reasons:
Submit
Woaoo thanks Professor.. it is such an honor to me.
Downvoting a post can decrease pending rewards and make it less visible. Common reasons:
Submit