
Now we were given homework task with the following outline:
Make a Homework Task 5 Post on the below Topics.
- What Is A SuperTrend Indicator?
- Show how to set SuperTrend on Chart and what are its settings need to configure.(Screenshot Needed)
- How SuperTrend Shows Buy-Sell Indications? (Screenshot Needed)
- When We can place a Buy Trade with the help of SuperTrend Indicator? (Screenshot Needed)
- When we can place exit/square off, sell order with the help of SuperTrend Indicator? (Screenshot Needed)
- How false indications look in SuperTrend Indicator? (Screenshot Needed)
- According to your view what Stoploss you will suggest?
- Conclusion.

1. What Is A SuperTrend Indicator?
This is a tool developed by traders to read the candlestick charts and produce buy and sell signals. It's a good answer to the age-long question, "How do I join a trend that has already started and still profit from it and avoid being reversed upon?". It can be used on different timeframes by different types of traders. Day traders use lower time frames, while long term traders use the H4 or D1 chart.
Below is what the indicator looks like👇
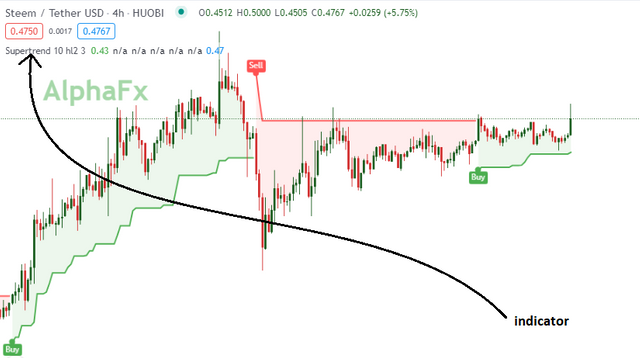
SuperTrend Indicator on STEEM/USDT, H4 timeframe [TradingView]

2. How To Set SuperTrend on Chart
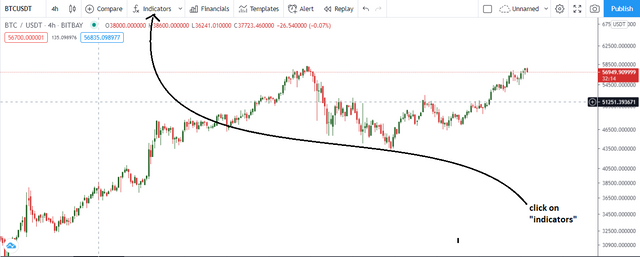
Open your chart on trading view, the select indicators, as shown in the image below.
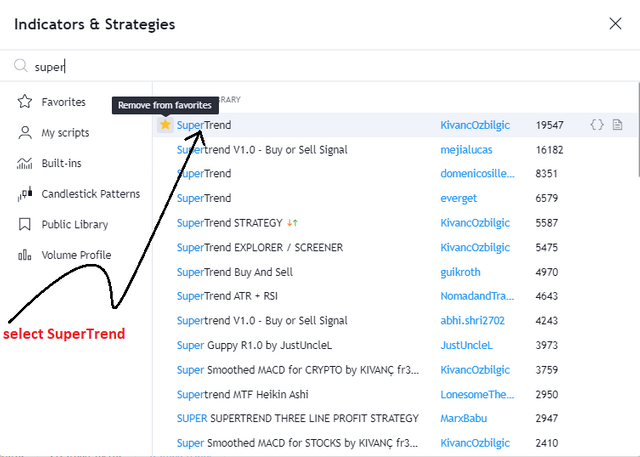
A menu will open, just like the one in the image below, type "supertrend" in the search bar, then select the one you want. I indicated the one I use in the image below.
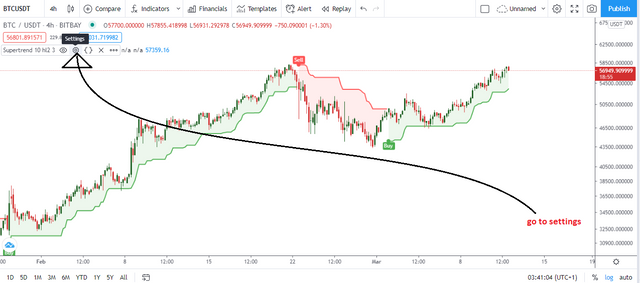
The Indicator is displayed on your chart as in image below. Now if you feel the parameters of the indicator need to be adjusted to better suit your trading style and give more accurate results, click on settings.
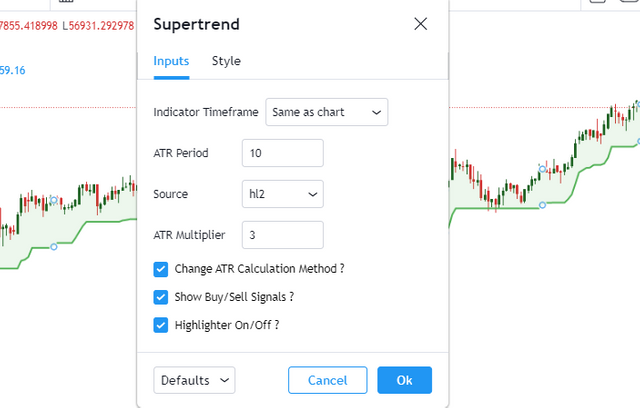
A tab opens, for you to adjust these parameters.
ATR: Average True range, otherwise called ATR is a test for market volatility. When setting this, for short term, use 2-10 as the period. For long-term traders, use 20-50 as the period.
.
Source: I use the OHLC4 for this, as it measures the open, high, low and close. Some measure only high and low.
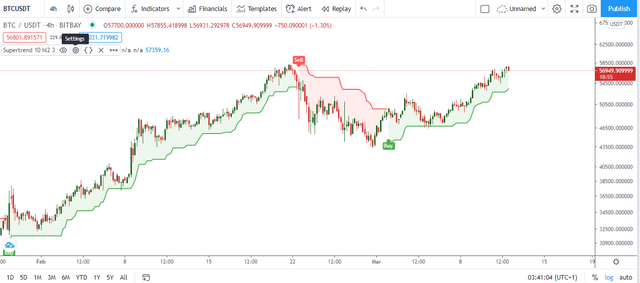
Your indicator is set to use✅

3. How SuperTrend Shows Buy-Sell Indications? (Screenshot Needed)
On the chart, the indicator prints buy or sell signals at regular intervals. These signals are sometimes false, sometimes true, and personally believe with a higher ATR you can make the signal accuracy a bit more spot on.
Below is how the signals appear on the chart:
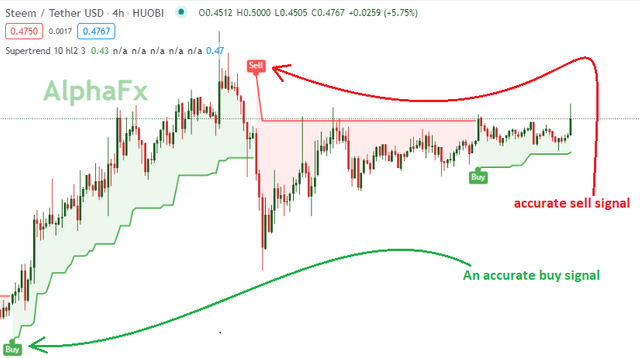
Sometimes these signals are not accurate, especially when price forms a channel. Stay with me, I will throw more light on this.

4. When can we use the SuperTrend Indicator to place a buy trade?
Like I said above, the SuperTrend indicator produces a signal, there are possibilities of it being false, so I recommend using other technicals to confirm entry. For example, if a buy signal is shown after consolidation, on a chart where price action is generally saying buy, There is a higher probability of the trade being accurate. Also, if during a buy, price hits a major resistance and the sell signal is printed, then there is a higher chance of accuracy on the trade. Another instance is when the signal comes after a bullish pattern is formed, for example, a buy signal appearing at the site of a "double bottom" or "reverse head and shoulders", "cup and handle" or "pennant flag" that's more of a double confirmation, and it's safer to enter the trade.

A buy signal after consolidation on a chart in an uptrend

5. When we can place exit/square off, sell order with the help of SuperTrend Indicator?
If the indicator detects a sell, it prints a sell signal (as shown below), there are possibilities of it being wrong, especially when price decides to consolidate. Its more advisable place a sell order if a signal appears at the site of a bearish candle stick pattern, for example, head and shoulders, or double tops. This will serve as double confirmation and stack the odds in your favour.
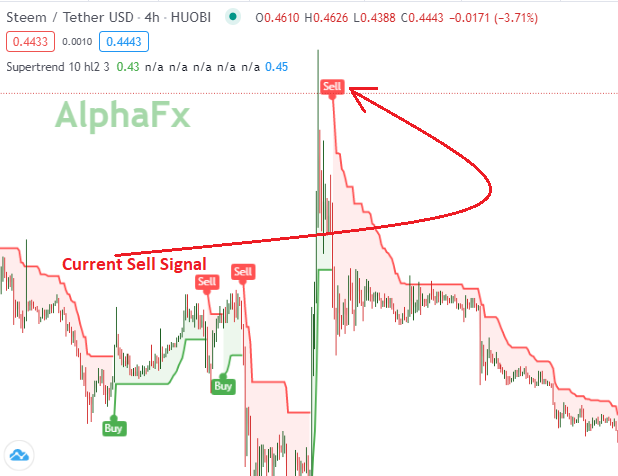
Sell signal at a major resistance

6. How false indications look in SuperTrend Indicator?
In the image below are examples of false indications. signals appeared for buys and sells, but the chart was in a sideways channel. To avoid wasting money on trades like this, allow the chart to break support (in a sell) or resistance (in a buy), before placing the trade.
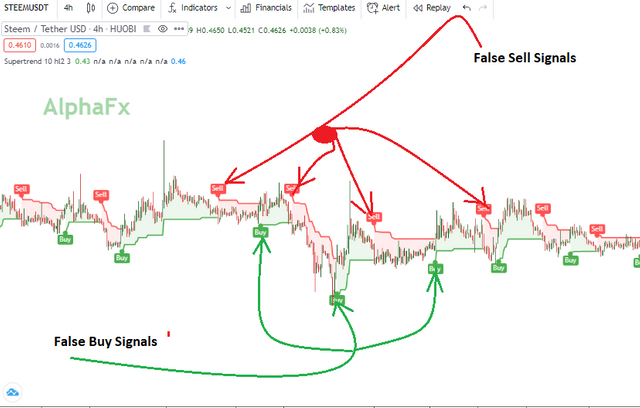
False signals

7. According to your view what Stoploss you will suggest?
Like @stream4u taught, finding the nearest two lows, or highs, to use as support or resistance respectively, depending on whether its a buy or sell, then setting your stop loss at that level should work. a trailing stoploss would also make good sense.

Conclusion
Honestly, this was a good eye-opening lesson. I'm totally going to use this to demo trade and eventually live trade when I have mastered it and seen the parameters best suited to me. I've already installed it on my binance and used for a trade, and will watch it for the next week. Thank you @stream4u
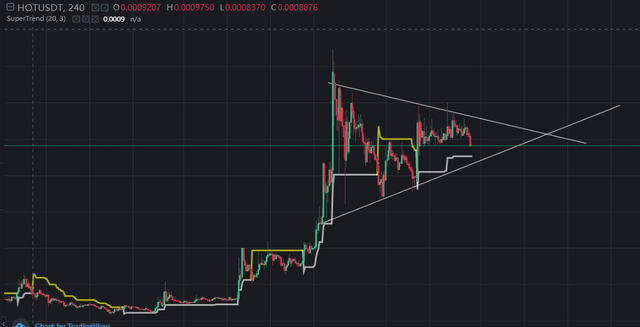
my trade
Hi @alphafx
Thank you for joining Steemit Crypto Academy and participated in the Homework Task 5.
Your Homework task 5 verification has been done by @Stream4u.
You made a great Homework Task. Still, I wanted to highlight one point again regarding BUY, which has mentioned in the course, just for the information.
We can see in this how the price tuches the line and moved up, so buy at this support line, this is for safe trade.
Thank You.
@stream4u
Crypto Professors : Steemit Crypto Academy
Downvoting a post can decrease pending rewards and make it less visible. Common reasons:
Submit
thanks prof
Downvoting a post can decrease pending rewards and make it less visible. Common reasons:
Submit