This topic is very interesting for me. i tried to explaint all the question.
Thanks @stream4u.
What is a Chart Pattern?
Inside the chart is a chart pattern or price pattern where prices are planned. In stock trading and commodity markets, chart model studies play an important role in technical analysis. When planning data, there is a pattern that occurs naturally over time. This is repeated from time to time.
In the technical view, charts are used to define the movement of an asset's current price.
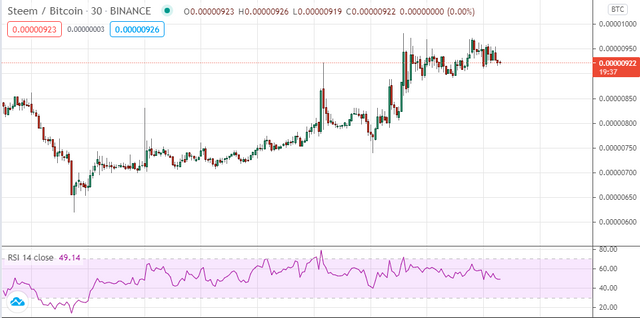
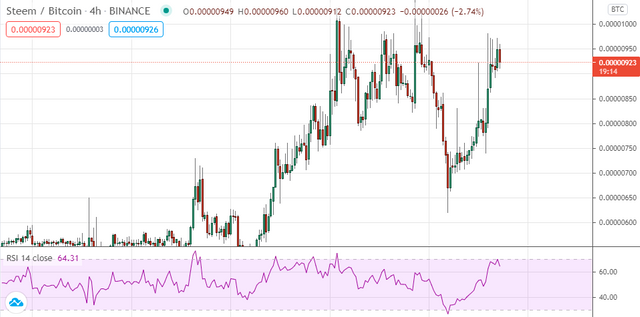
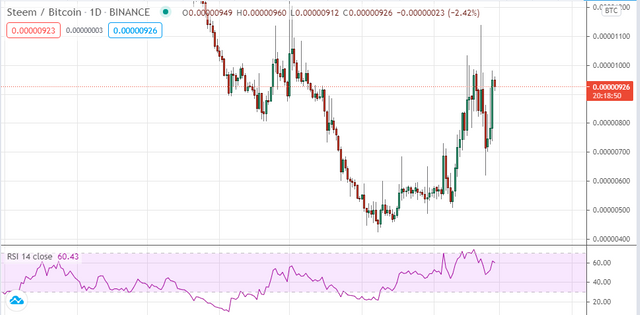
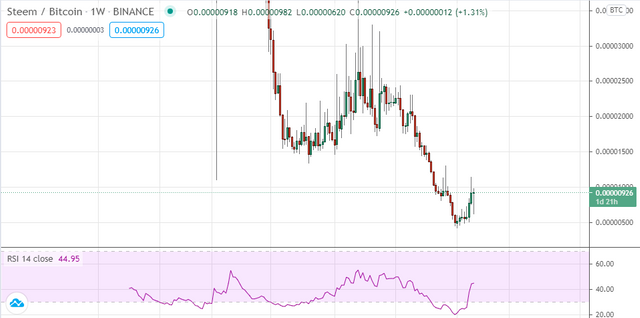
In above the screenshots from the trading view, you can see these all pictures STEEM/BTC M30, H1, Daily and Weekly Charts.
We can Analyse our charts and trade on assets.
What Is A Price Breakout?
A breakout is defined as price movement above or below a certain level. Billing for sprouts is considered more reliable on a breakout basis, when the price rises above the resistance level or falls below the support level, a trader will consider a short position.
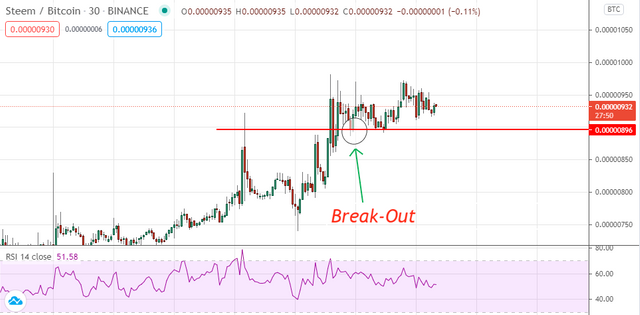
In the screenshot, we can see a clear break-out at the resistance level. Now become support level.
What Is A Continuation Pattern?
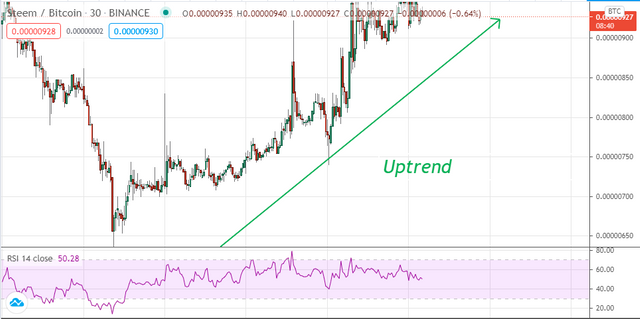
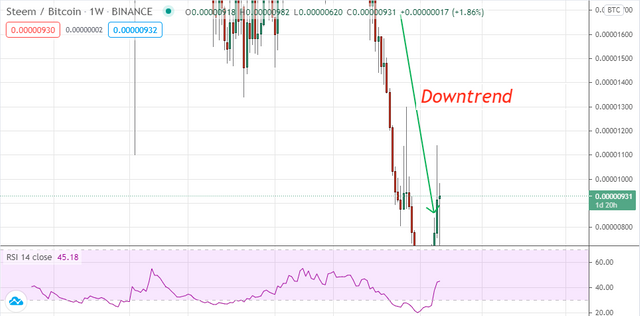
In a continuation pattern, the price moves in one direction. If its value is upward, it is constantly upward. And if its value is downward, it is constantly moving downwards. If the price is constantly going up then you can call it Uptrend and if the price is going down or moving then you can say it Downtrend
What Is A Higher High Formation?
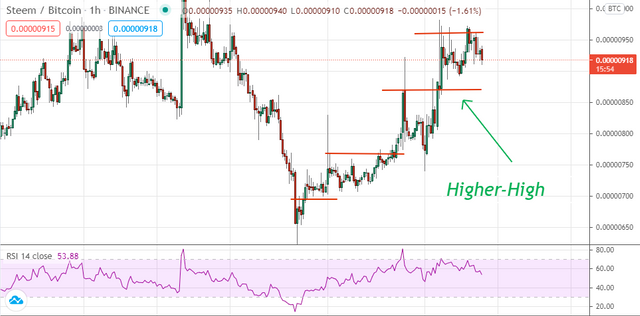
When the price makes a higher high, it breaks its previous high and moves to another new high.
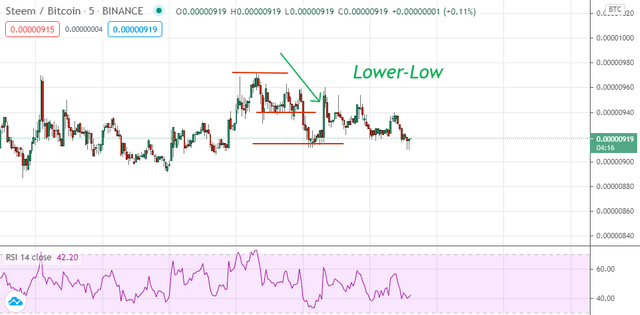
What Is A Lower Low Formation?
When the price makes a lower low, it breaks its previous low and moves to another new low.
What is a Reversal Pattern?
Reversal pattern in technical analysis, any pattern on the chart that indicates an old trend becomes a new trend. It declines the countinue pattern and change its direction.
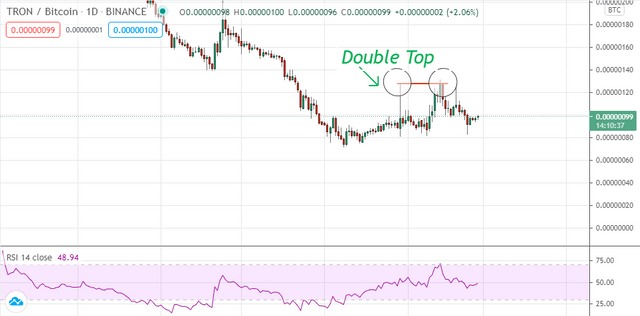
What is a Double Top Pattern?
A double top pattern is a technical pattern chart that defines the trend's reversal. The double top touched twice the high level that is considered a resistance level.
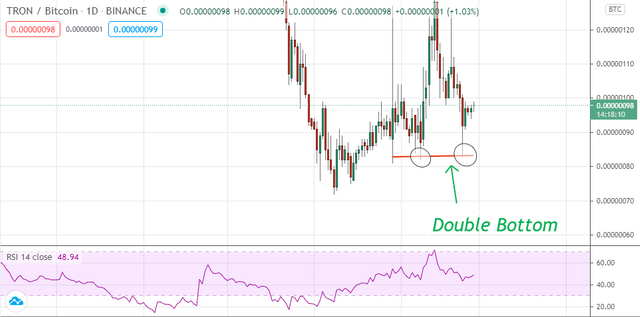
What is a Double Bottom Pattern?
A double bottom pattern is a technical pattern chart that defines the trend's reversal. The double bottom touched twice the low level that is considered a support level.
What Is The Importance of Stop Level(STOPLOSS)?
Stop loss is very important in trading. when you trade your assets, You should know that not every business of yours can be profitable so you need a stop loss. Whenever we trade our assets, we have to place our order for reasonable losses so that we can avoid huge losses.
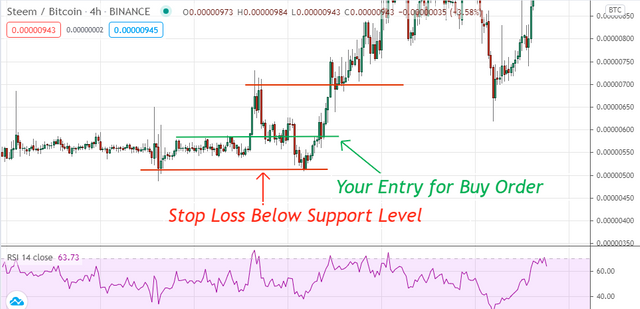
I am trading last few year and my strategy is that I recomend in the chat above. If you enter in the trade for buy order on the support level ( Previous Resistance Level ) Then your you can set your stop loss below the previous support level.
All the screenshots that i taken from trading view.
Hi @amjadsharif
Thank you for joining Steemit Crypto Academy and participated in the Homework Task 3.
Your Homework task 3 verification has been done by @Stream4u.
Thank You.
@stream4u
Crypto Professors : Steemit Crypto Academy
Downvoting a post can decrease pending rewards and make it less visible. Common reasons:
Submit
Thank you Sir @stream4u.
Downvoting a post can decrease pending rewards and make it less visible. Common reasons:
Submit