Hey all hopefully you all are good at your places and doing well here I am sharing my assignment about Stochastic oscillator by @lenonmc21


QUESTION 1
Define in your own words what is the Stochastic Oscillator?
Stochastic oscillator is a momentum indicator of a security's closing price relative to its price point in a specific period. The oscillator's sensitivity to market movements can be reduced by adjusting its duration or taking a moving average of the results. It utilizes a limited range of 0 to 100 and is used to generate trading signals that are oversold and oversold.
Notably, %K is sometimes considered a fast stochastic indicator. The "slow" stochastic indicator is considered %D = 3 period moving average of %K. The basic general theory for this indicator is that in an uptrend market the price should close near the high and in a downtrend market the price should close near the low. A trading signal is generated when %K crosses the three-period moving average, known as %D.
The difference between the slow and fast stochastic oscillator is that the slow% K combines a% K slow time of 3 to control the intrinsic smoothing of% K. Setting the smoothing interval to 1 is equivalent to drawing a set of knives. fast random movement.
Stochastic oscillator are range bound. That is, it is always between 0 and 100. Then sold too and sold too are useful indicators of status. Existing over 80 readings are considered sold too, and readings less than 20 are considered sold too. However, these are not necessarily indicative of an impending reversal. A very strong tendency to be sold-too or sold-too-too-long-term status. Instead, traders need to keep an eye on changes in the strike cassikes to get clues about future trend changes.

QUESTION 2
Explain and define all components of the stochastic oscillator (% k line,% D line + overbought and oversold limits).?
The formula to calculate Stochastic oscillator is :
%K = ( ( C - L14)/(H14-L14) ) X 100
Where
C is stand for recent closing price.
L14 is stand for lowest price of the trading session of 14 days
H14 is stand for the highest point of trading session of 14 days
%k is stand for stochastic oscillator.
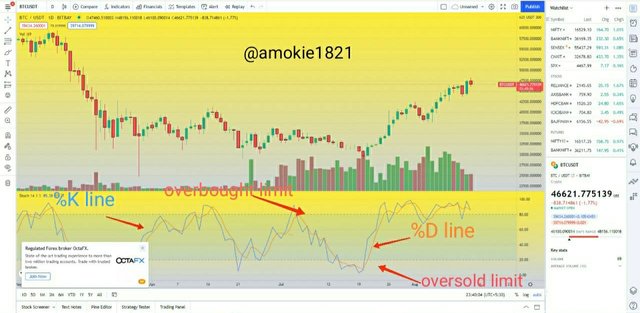
%k line
The %K line is one of the lines forming the stochastic oscillator, and the %K line is the indicator fast line generating a trading signal through the intersection of the slow line %D. The %K line measures the momentum of a price change by comparing the current closing price to the length low of the selected period, and comparing the high to the lowest of the period.
% D line
The %D line is the other line forming the full stochastic Oscillator. The %D is considered to be the slow line that integrates the %K line calculations to derive its value. The %D line generates a trading signal by crossing above or below the %K line.
Overbought
The Stochastic oscillator sold too limit is the upper limit indicating that the price uptrend has been over-extended. The upper bound starts at the 80-100 scale bound. A bearish reversal is expected if the price trades above the bounds line.
Oversold
The overly restrictive sales limit is the lower limit of the stochastic oscillator. This shows that the price decline is over-extending. The sales overly limit is at scale boundary value 0-20. Similarly, a bullish reversal is expected if the price is trading at the lower bound.

QUESTION 3
Briefly describe at least 2 ways to use the Stochastic Oscillator in a trade.?
Crossover Crossover is another best technique employed by traders. A cross is that the intersection of two lines (% K and% D) within the overbought and oversold zone. In Crossover,% K is known as fast stochastic line and% D is termed slow stochastic line. A buy signal occurs when the fast stochastic line crosses above the slow stochastic line within the oversold zone. Likewise, a sell signal occurs when the fast stochastic line crosses below the slow stochastic line within the overbought zone. Divergence this happens when the Stochastic Oscillator fails to figure out a replacement high or low price. Bullish divergence occurs when the value hits an occasional but the Stochastic Oscillator hits an occasional. From the above statement we are able to show that the bearish momentum that may herald a bullish reversal is weak. Likewise, bearish divergence occurs when price reaches a high but the Stochastic Oscillator hits a coffee. From the above statement we'll show that the bullish momentum that may herald a bearish reversal is weak. In divergence we'd prefer to secure the midline i.e. 50. For bearish divergence we wish to trade with support. When the Stochastic Oscillator drops below 50, we are going to confirm a Berish Divergence. For the bullish divergence, we would like to trade the resistance level. When the Stochastic Oscillator crosses the 50 level, we are able to confirm a bullish divergence.

QUESTION 4
Define in your own words what is Parabolic Sar?
Traders use the Parabolic SAR indicator developed by J. Wells Wilder to determine the direction of the trend and possible price reversals. Stop and reversal to determine the appropriate entry and exit points. Traders also refer to indicators as Stop Loss and Parabolic Reversal, Parabolic SAR, or PSAR. The
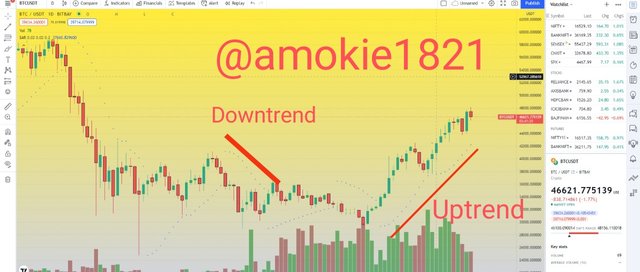
Parabolic SAR indicator depending on the direction the price is moving. When the price is in an uptrend, the point is below the price, and when it is in a downtrend, it is above the price.
How to calculate the parabolic direction indicator
There are many things to follow when using the parabolic Stop Loss and Reverse indicators. One thing to keep in mind is that if the SAR was initially increasing and the price closed below the rising SAR value, then the trend is now decreasing and the descending SAR formula will be used. If the price rises more than the falling SAR value, switch to the rising formula. Monitors prices for at least five cycles or more, and records highs and lows (EPs).
If the price goes up, use the lowest point in these five periods as the previous PSAR value in the formula. If the price falls, the highest point of these periods is used as the initial PSAR value. The initially uses an AF of 0.02 and adds 0.02 for each new high (rising) or low (falling) extreme. Maximum AF is 0.2.
Ideally, use a spreadsheet, where the highest and lowest prices, SAR, EP and AF can be tracked on a regular basis.
When the position of the point moves from one side of the asset price to the other, the parabolic indicator generates a buy or sell signal. For example, a buy signal appears when the point moves downward from above the price, and a sell signal appears when the point moves upward from below the price.
traders also use PSAR points to set stop-loss orders. For example, if the price rises and the PSAR also rises, the PSAR can be used as a possible exit for the bulls. If the price is lower than PSAR, then exit the long trade.

QUESTION 5
Explain in detail what the price must do for the Parabolic Sar to change from bullish to bearish direction and vice versa.
The Parabolic Stop and Reverse Indicator (Parabolic SAR) was developed to help traders identify buy and sell signals for current trends and determine when to enter and exit trades based on a trade's momentum. translation is active. It was created by J. Welles Wilder Jr., a talented mechanical engineer turned analyst who pioneered the variety of technical analysis tools that financial traders still rely on today. now on. His other achievements include the Relative Strength Index (RSI), Average Directional Index (ADX) and Average True Range (ATR).
The Parabolic SAR is plotted directly on the price chart and appears as a series of twisting points above and below the price bars. When the points move below the price, this is considered a bullish signal (buy). Conversely, when points move above price, this is seen as a bearish signal showing that momentum is likely to continue in the downtrend in favor of sellers.
When a change in market dynamics occurs, the dots cross across the price bar. Since changes in market dynamics often precede price changes, this change is considered an indicator of an impending trend reversal.

QUESTION 6
Briefly describe at least 2 ways to use Parabolic Sar in a trade?
Entry and exit point
Through parabolic Sar we can also know about the entry exit point the the trade is going on and all about the dotted line of the curve if it is below price line then only a trader should buy the trade and vice versa.
Trend reversal
When the first dot is apper on the chart trader will get to know that it is trend reversal situation when the dotted line is above or below price line. This is parabolic trend reversal.

PRACTISE
QUESTION 1
show a step by step on how to add the Stochastic Oscillator to the chart (Indicating the% k Line and the% D Line, the overbought and oversold zone.
Visit on tradingview website open your chart of your choice in which you want to trade I am taking BTCUSDT Go on indicator on top bar then search stochastic click on left side drop down panel on stochastic option.
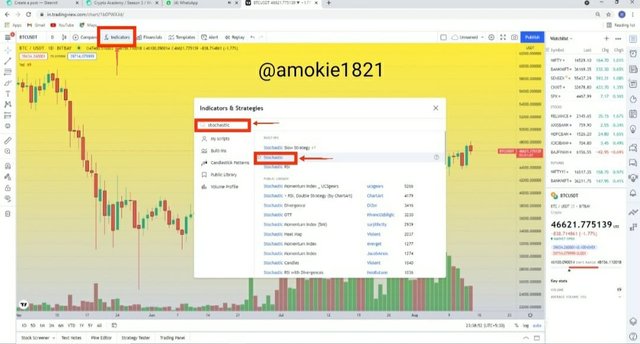
Then our oscillator is placed %k , %D , oversold and overbought.
Question 2
Show step by step how to add Parabolic Sar to the chart and how it looks in an uptrend and in a downtrend.
Same as above will set chart and do the process this time we will serch for parabolic SAR and apply.
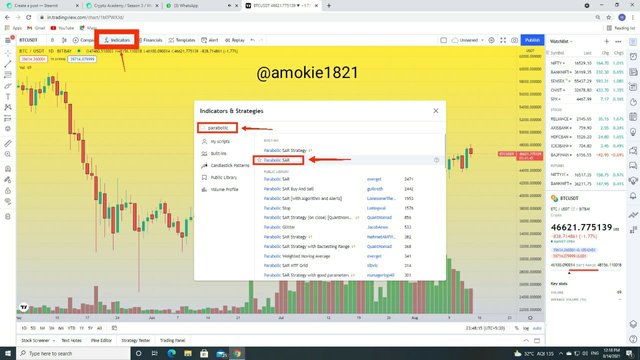
Here our Sar is placed and we can see up and down trend clearly.
QUESTION 3
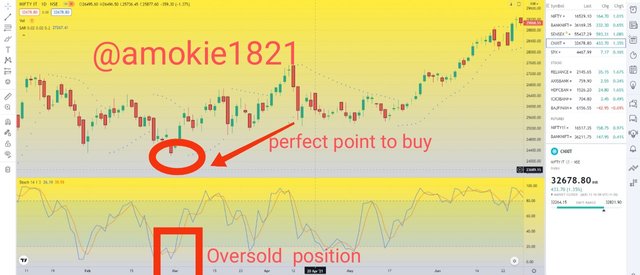
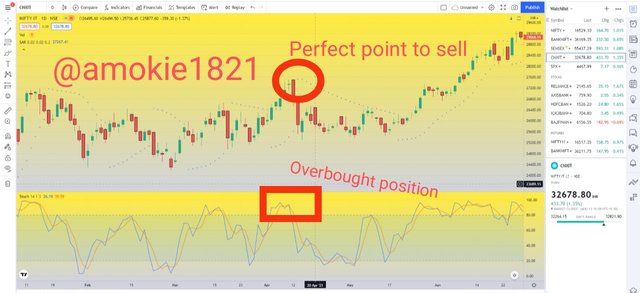
Add the two indicators (Stochastic Oscillator + Parabolic Sar) and simulate a trade in the same trading view, on how a trade would be taken.
Buying
Selling
Conclusion
We have used 2 indicators at basic level stochastic oscillator and parabolic sar from which I have learnt alot how to place a trade overbought and oversold situation and much more thank you professor @lenonmc21 for grant me the opportunity to learn.
This content appears to be plagiarised as indicated by lenonmc21
If you have not already done so, you should head to the newcomers community and complete the newcomer achievement programme. Not only will you earn money through upvotes, you will learn about content etiquette;
Notification to community administrators and moderators:
@steemcurator01 ADMIN
@steemcurator02 MOD
@sapwood MOD Professor[Advanced]
Downvoting a post can decrease pending rewards and make it less visible. Common reasons:
Submit