Am gladdened once again for yet another opportunity of this wonderful edition by the cryptoacademy. From the lecture offered by Professor @reminiscence01, reading through this lecture series have given me a better insight on Technical Indicators. To this, I will be writing based on the task given by the Professor.
1.a) In your own words, explain Technical indicators and why it is a good technical analysis tool.
Technical indicators are those indicators or signs that helps investors to make practical assumptions and predictions about the future market prices and trends of assets based on the previous market trends and prices of assets over time period. Here, the previous market prices and trends of assets are used in calculating for a possible signal for future predictions and analysis on the asset over a period of time.
Technical indicators is a good technical analysis tool because it helps an investor or trader to understand the market trends and the price volatility of a particular asset, thus a better trading decision made by a trader for an optimum outcome.
The technical indicators are good technical analysis tool because they also help traders or investors to spot a possible trading signal so as to make profit out of it as well as managing the trade so as not to risk a trading opportunity.
b) Are technical indicators good for cryptocurrency analysis? Explain your answer.
To me, I will say a YES because it helps investors or traders to identify a possible bullish trend or bearish trend movement, momentum of price, a possible reversal in the trend direction of assets, as well as making a good decision before entering a trade. This if carried out properly enables traders or investors to make profit by opening order at the right time. Although, it is not 100% reliable but it’s reliability all depends on its proper usage by a trader.
Being able to understand the working principles of the indicator and how to apply it on chart for an optimal investment lies solely on the traders trading strategy. It might work well for investors who understands the psychology behind the indicator and might not work those who does not. So it is a good analysis tool for cryptocurrency.
c) Illustrate how to add indicators on the chart and also how to configure them. (Screenshot needed).
- I will be showing a step by step way of adding indicators on the chart, for this task, I will be adding the stochastic indicator.
First, you have to visit: https://www.tradingview.com/

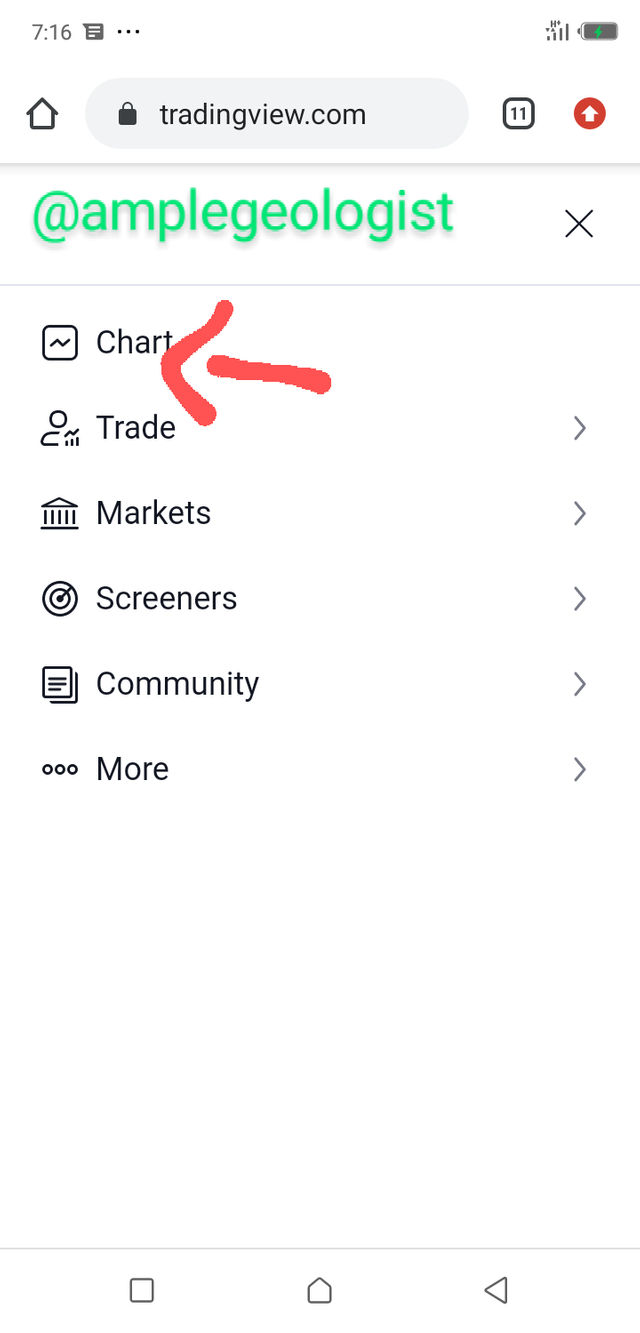
- Then I clicked on the “Menu” bar at the top left corner of the opening page, this took me to a new page where I clicked on the “Chart” option
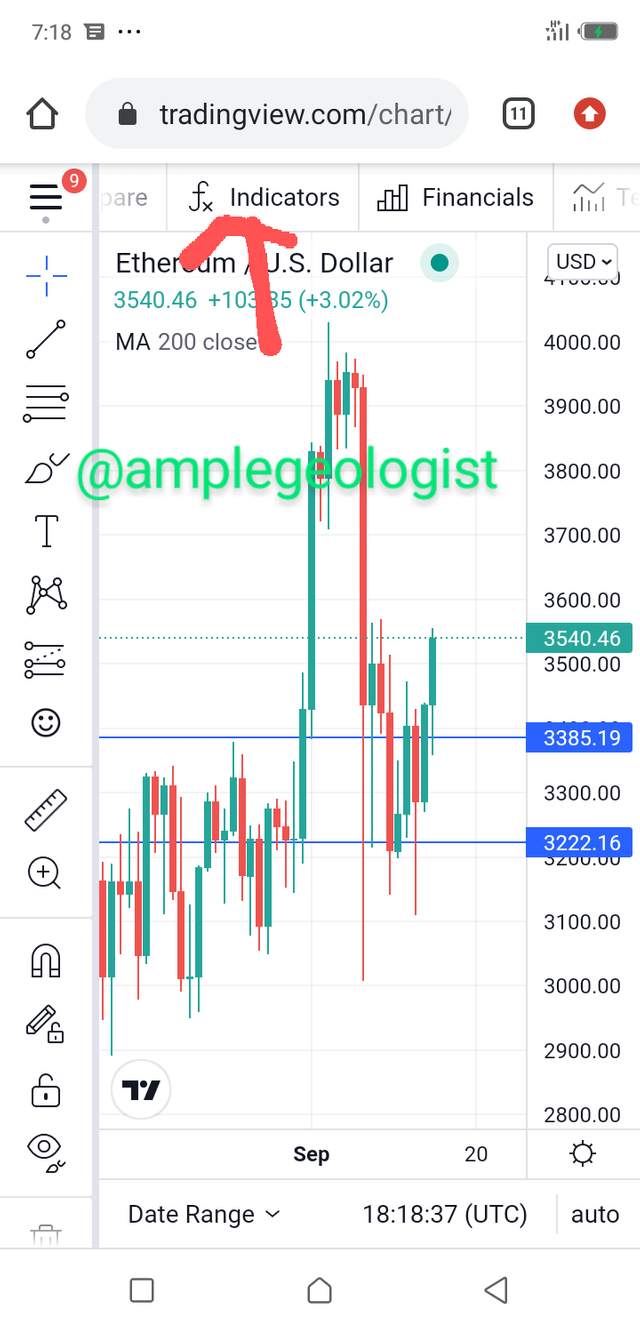
- After clicking on the chart option, it redirected me to the charting interface where I now clicked on the “indicator” icon at the top corner of the page.
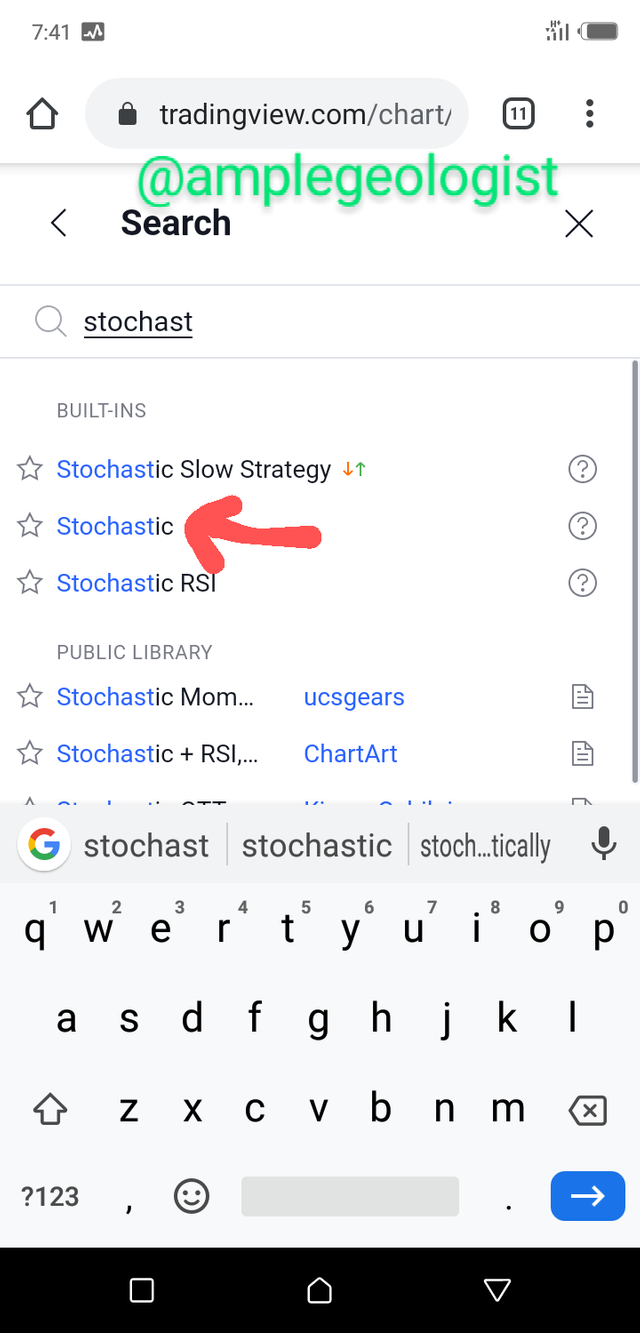
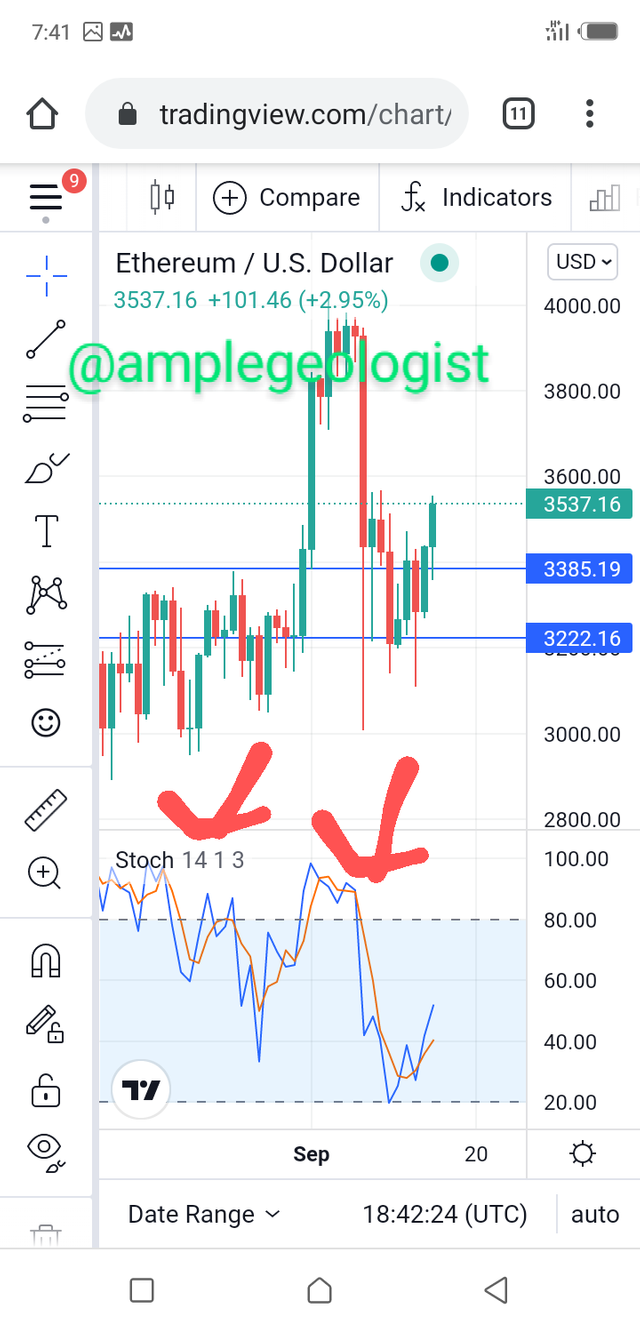
- After clicking the indicator icon, a pop out window showed where I then searched for the Stochastic Oscillator indicator and it displayed, then I clicked on it and it was added to the chart as shown below.
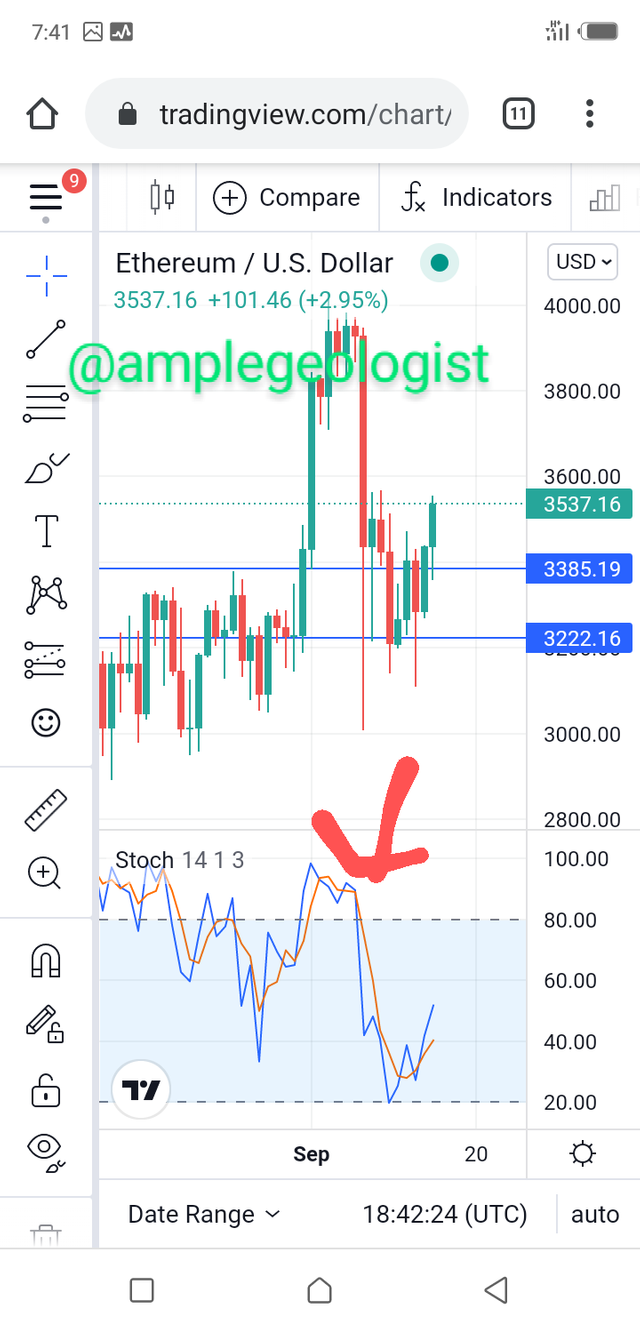
To configure the indicator added to the chart, the following steps are taken:
- First, to configure the Stochastic Oscillator indicator on the chart, I clicked on the indicator bar that I just selected and then clicked on the “setting” icon as shown below
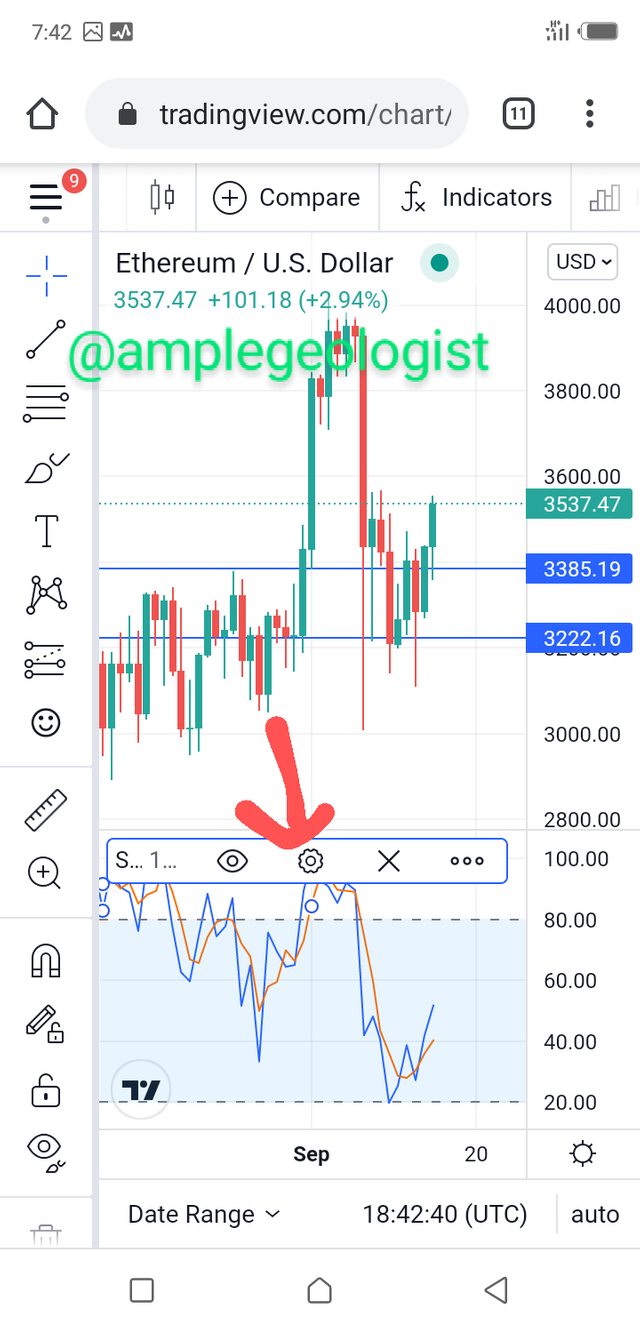
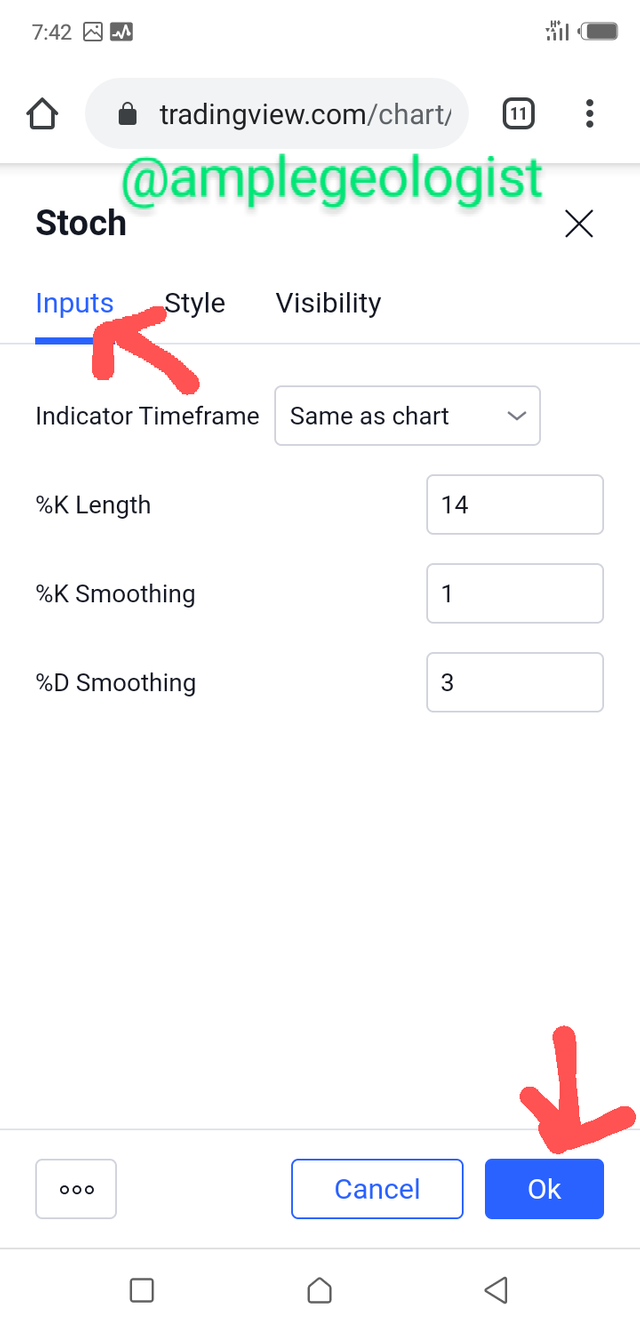
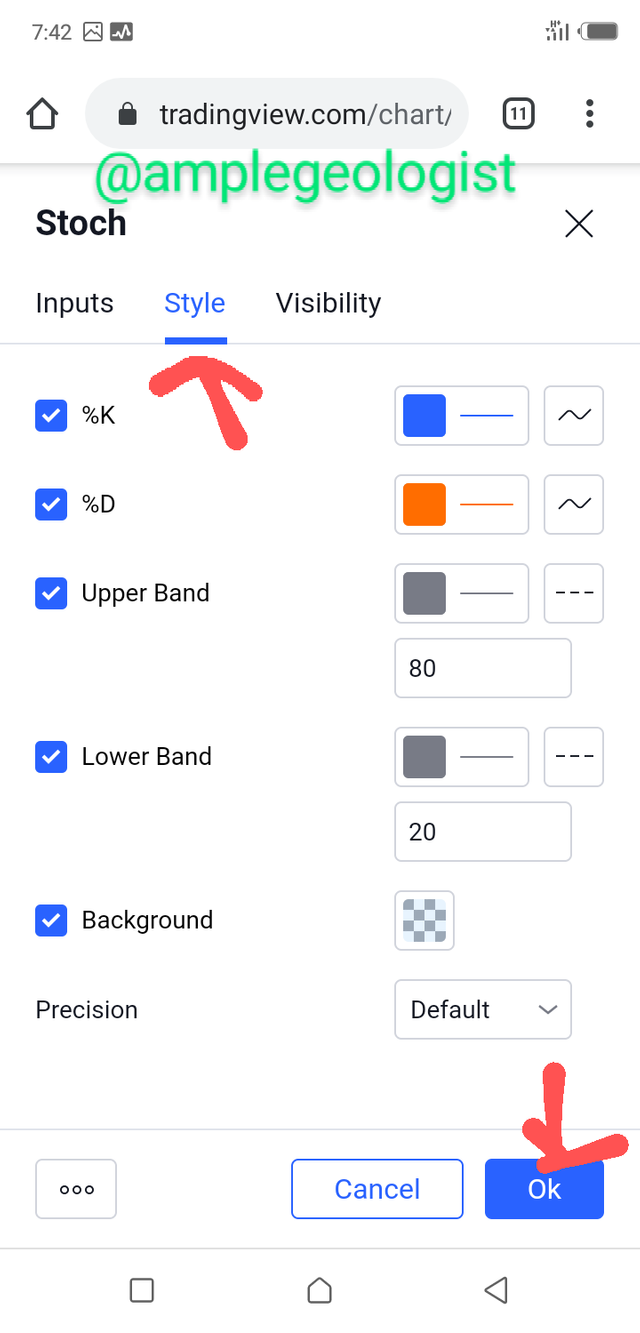
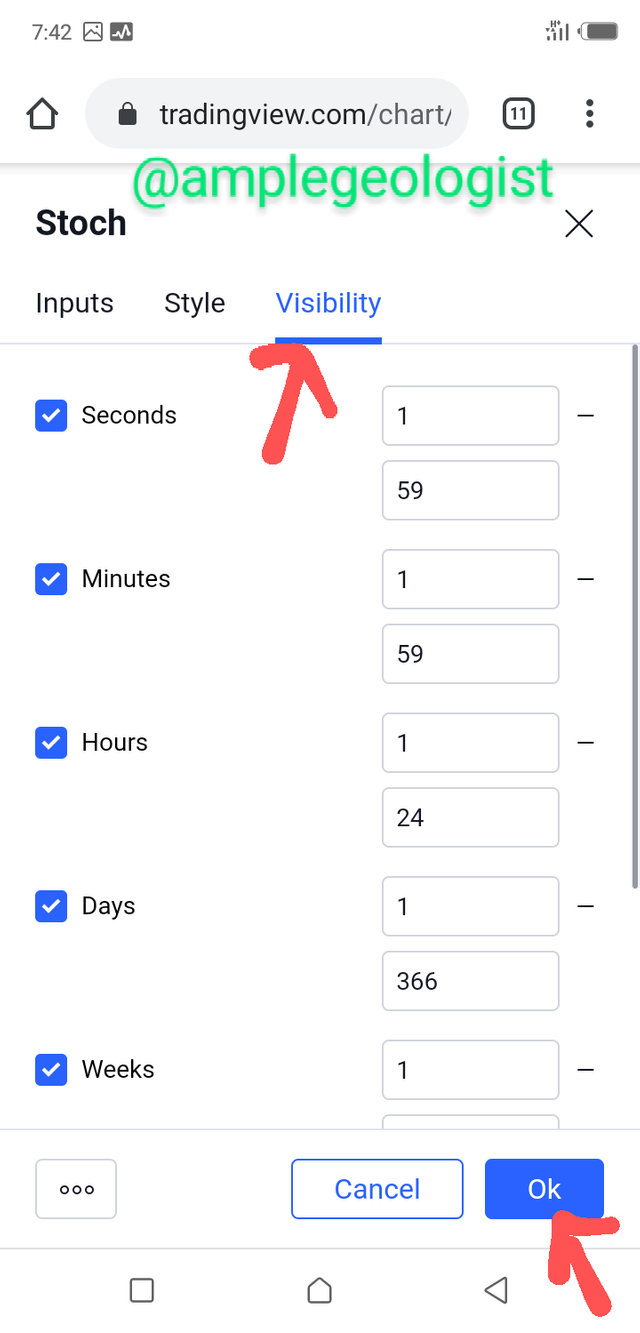
- After clicking on the setting icon, a pop out window appeared where I had to click on the “Input” option to change some parameters, and also on the “Style” option and then lastly on the “Visibility” option to change the Stochastic Oscillator indicator parameters as shown below
2.a) Explain the different categories of Technical indicators and give an example of each category. Also, show the indicators used as an example on your chart. (Screenshot needed).
Trend based Indicators
This category of indicators are those indicators that checkmates the trend of asset. It gives a signal to an investor when the trend of an asset is about experiencing a reversal in trend direction (i.e if the market trend of an asset was in the bullish direction, it gives a signal to the investor whenever the asset is about experiencing a possible reversal in the bullish trend to a bearish as well as vice versa). By the time an investor via this category of indicator is able to spot the trend thus help in making a good decision on when to enter a trade or when to exit a trade without incurring loss but rather profit.
An example of this category of Indicators is the Average Directional Index (ADX) as shown below in the chart

Momentum-based indicators
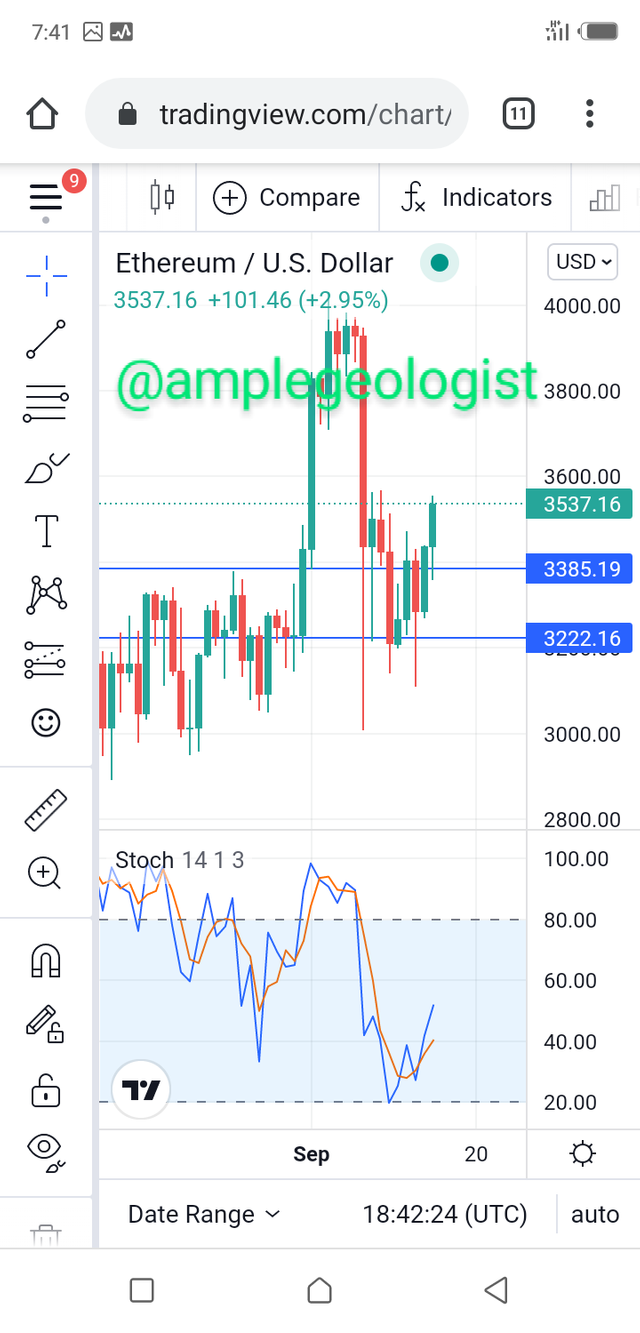
This category of indicators are those indicators that looks into oscillating strength of an asset price. It indicates the overbought or oversold period of a certain asset in a period of time. It is a category of indicators that helps investors to identify the overbought limit of an asset thus indicating a possible reverse in the bullish trend of an asset and also an oversold limit of an asset thus indicating a possible reverse in the bearish trend of an asset. Whenever the price of an asset enters the oversold region, it indicates a good buying period and when the price of an asset enters the overbought region, it identifies a good selling period to make profit.
An example of this category of indicator is the Stochastic Oscillator as shown in the chart below
Volatility Based Indicators
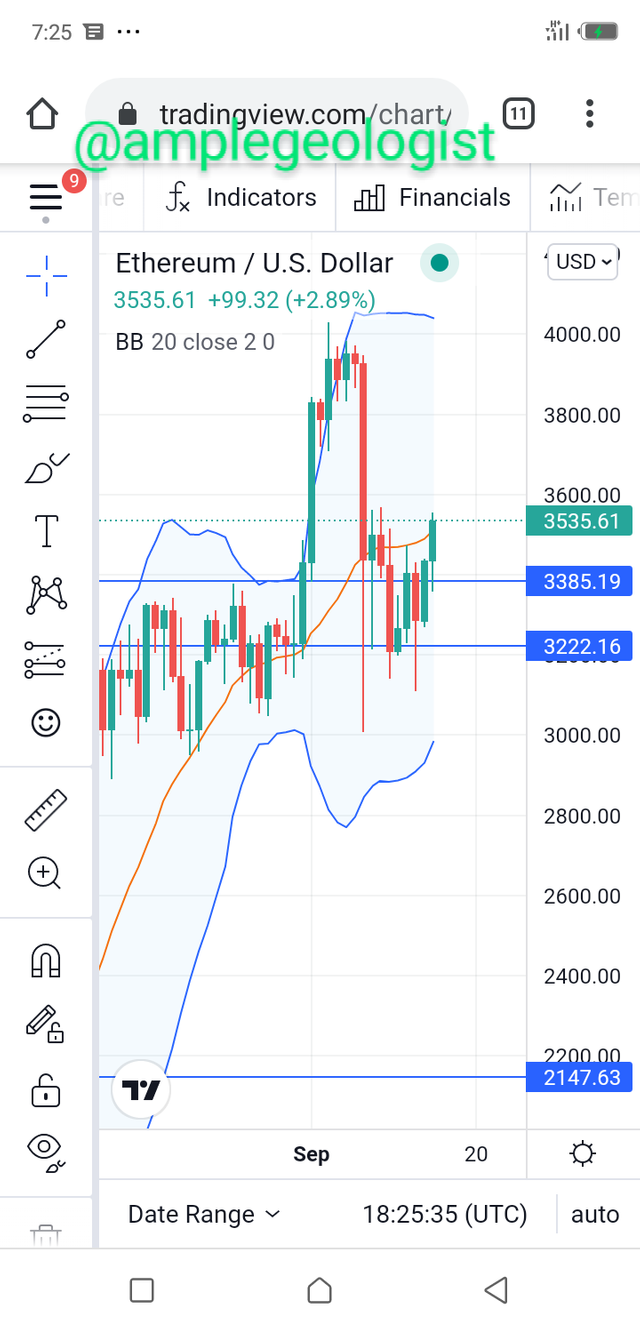
This category of indicator are those indicators that indicates the price swings of assets. At times, there is always a harmonic price fluctuations of prices of assets in the crypto market. This fluctuations where the price of an assets moves up and down due to the pressure caused by buyers and sellers is known as volatility. Whenever the price swings high, traders take the advantage of the market by selling their asset to make profit but by the time the prices of an asset swings low, they take advantage of the market by buying assets.
An example of this category of indicator is the Bollinger Bands as shown in the chart below
b) Briefly explain the reason why indicators are not advisable to be used as a standalone tool for technical analysis.
In a crypto market, the asset at some times are very volatile and this causes the trend asset to swing high and low. Owing to this fact, technical indicators at some point may move in an opposite direction to that of the trend of an asset. Apart from this, technical indicators work on the basis of past or previous occurrence of event thus giving a clue to a better projection of the future market.
The technical indicator cannot be 100% efficient when it comes to forecasting of future trends and price of an asset, it is used as a baseline to understanding how the market works. This is one of the reason why it should not be used as a standalone tool when predicting the future market of an asset but rather other tools should also be used together with the technical indicators to help in analyzing for a better investment outcome.
c) Explain how an investor can increase the success rate of a technical indicator signal.
For an investor or a trader to increase the success rate of a technical indicator signal, the investor must first understand the working principles of the indicator he/she is working with if it sooths the type or style of trade he/she is about entering. Secondly the investor must not rely solely on the indicator as there is no 100% efficiency in it. The investor must be able to also recognize the possible signals at the right time in accordance with other tools as a backup for it efficiency in investment.
Investors should be able to know the objective of their investment and also their trading style if it rhymes or is in consonant with the indicator they are to use. Sometimes, indicator signals can be seen, but it right application to the market makes the indicator not successful in an investment.
There are so many different indicators which also at the same time are used for different purpose, like for instance, some indicators are used in detecting trends, some are for momentum of prices and so on, so it is very important for a trader to know the type of indicator he/she is working with and the effect it has on an asset. This will help increase the success rate of a technical indicator signal.

Hello @amplegeologist, I’m glad you participated in the 2nd week Season 4 of the Beginner’s class at the Steemit Crypto Academy. Your grades in this task are as follows:
Recommendation / Feedback:
Thank you for participating in this homework task.
Downvoting a post can decrease pending rewards and make it less visible. Common reasons:
Submit
I can see your post has paid out without getting curated by @steemcurator01. Please kindly repost with a screenshot of my review.
Thank you.
Downvoting a post can decrease pending rewards and make it less visible. Common reasons:
Submit