HOMEWORK BEGINNER'S COURSE WEEK 4 (Candlestick Patterns)
CRYPTO PROFESSOR: @reminiscence01
INTRODUCTION

Assalamualaikum! Hello dear Professor sir @reminiscence01, sorry professor sir please consider it late to your course due to my illness. Thank you for this great and educative lecture. I am going to attend your second class. Sir I really enjoyed your first class and I had some mistakes I tried then to learn and in today's new week I will try my best to this class. Honestly I enjoy your class very much. Today I will share with you my homework Season 3 beginners' course Week 4- Candlestick Patterns. I arrive with week 4 of the beginners course. I hope the next one is a comfortable read for you and thanks to teacher @reminiscence01 for class.
QUESTIONS

In your own words, explain the psychology behind the formation of the following candlestick patterns.
Identify these candlestick patterns listed in question one on any cryptocurrency pair chart and explain how price reacted after the formation. (Screenshot your own chart for this exercise)
Using a demo account, open a trade using any of the Candlestick pattern on any cryptocurrency pair. You can use a lower timeframe for this exercise.(Screenshot your own chart for this exercise).
Source


Question 1- In your own words, explain the psychology behind the formation of the following candlestick patterns


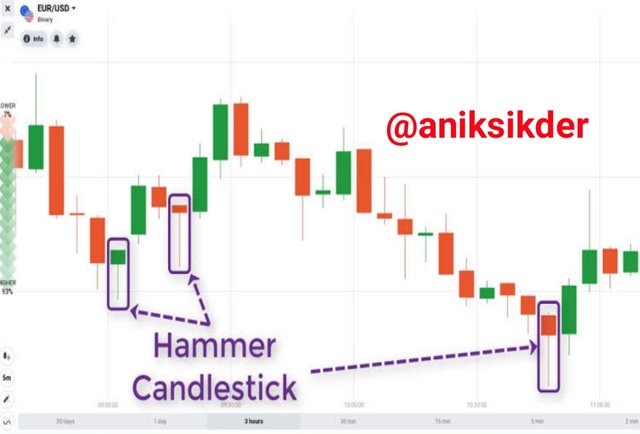
Hammer candlestick pattern
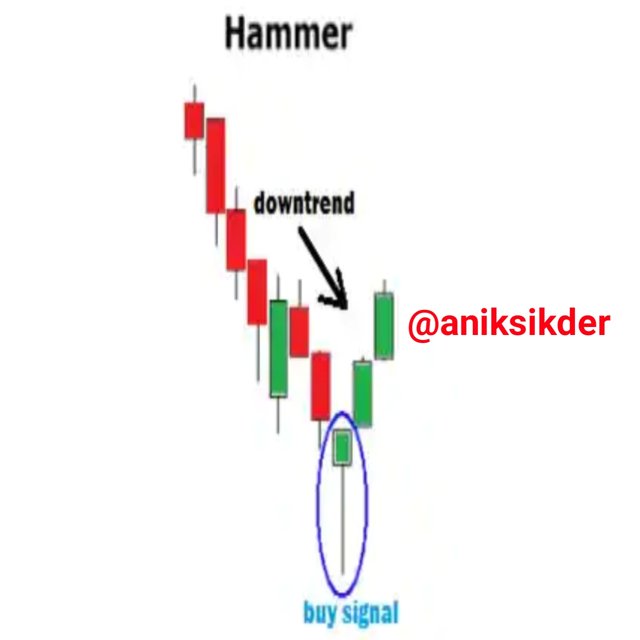
The hammer candle pattern here is the long low with which a short body is formed and a downward trend is found. This hammer show that even if there is pressure to sell during the day, it will eventually push the price back as a strong buy. So body color can vary and then the green hammer can point to a stronger bull market than the red hammer.
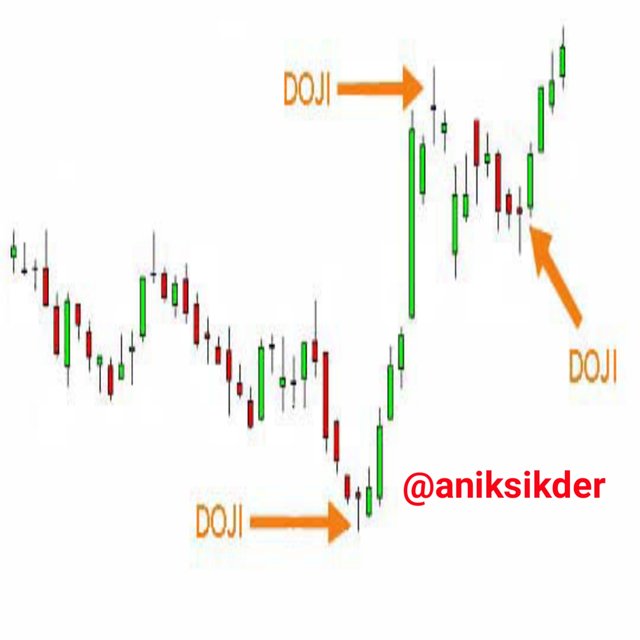
Doji Candlestick pattern
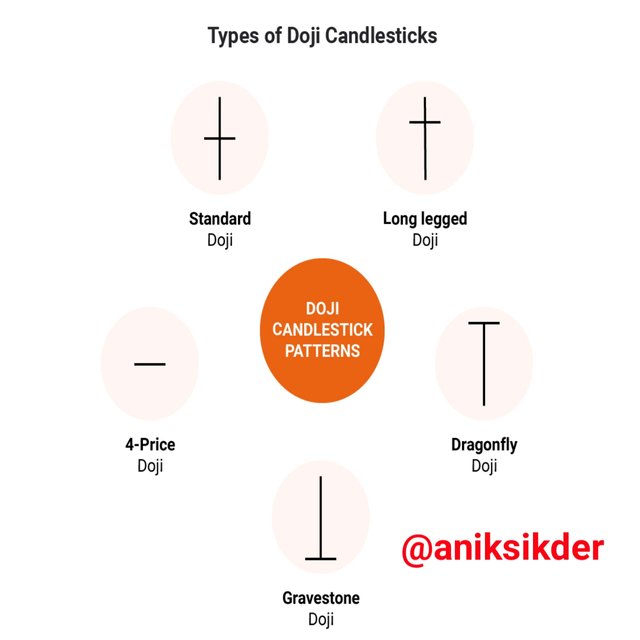
Doji is the name of a protection for which the candle has an open and close that is virtually equal and often contains elements of patterns. Doji candles look like cross, inverted cross or plus sign. Here without any kind of protection is open and virtually equal for the near term and different technical analysts usually signal a reverse pattern for them when forming a doji candlestick.
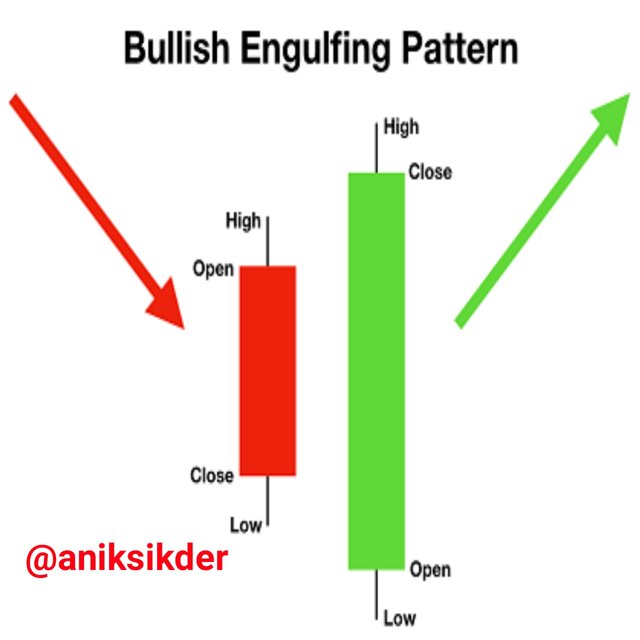
Bullish engulfing candlestick pattern
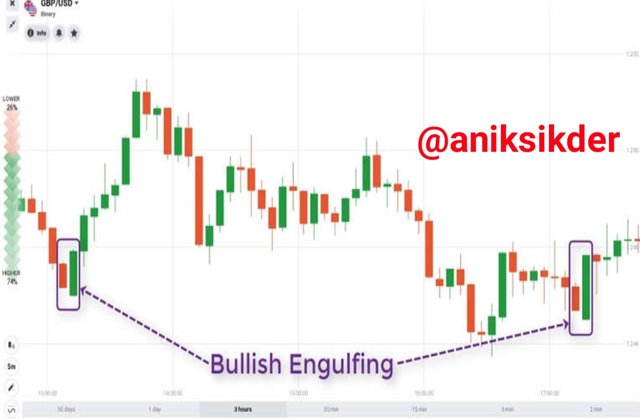
The bullish engulfing pattern consist of two candlestick strand and the candle here has a short red body that will be completely enclosed by the larger green candle here. We can see in different ways that the second day is lower than the first and even after opening the bullish market keeps pushing the price, lastly here it goes as the end of the clear victory of the buyer.
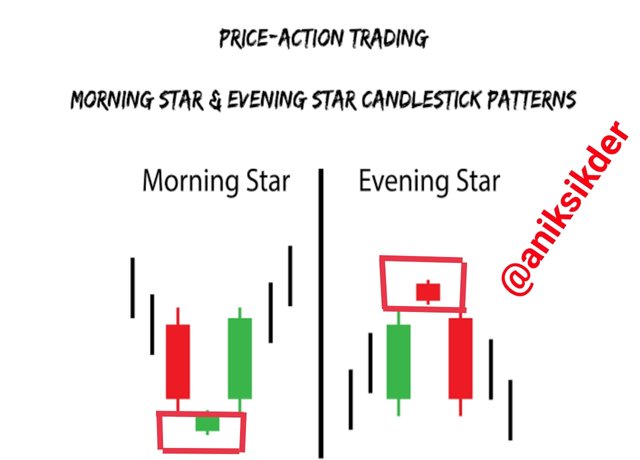
Morning and evening star candlestick pattern
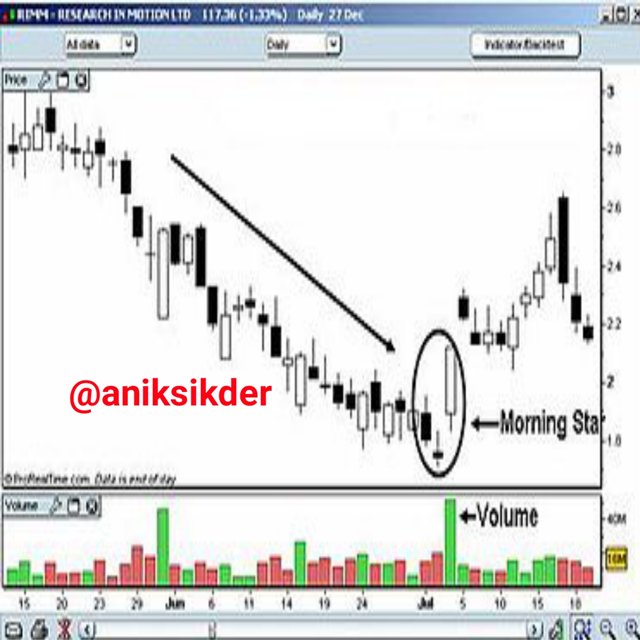
The morning star candle pattern is considered a sign of hope in the pure market downtrend and it is the stick pattern and the long red which is the short-body candle in the long green color. So there will be no problem with them as there are gaps between the two in the market. So it puts pressure on it as different aspect.
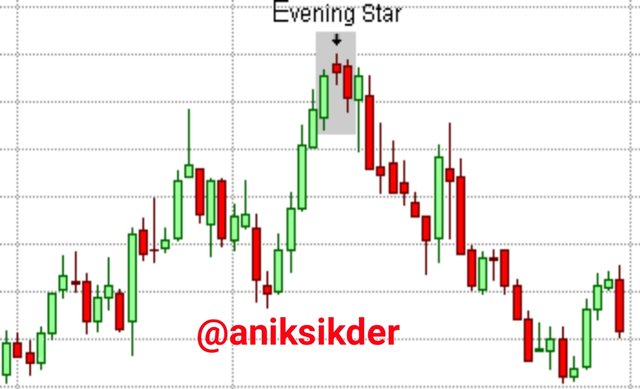
The evening star pattern is technically seen all the time as a bearish reversal pattern in our analysis. Evening stars are here all the time to raise prices. They keep an eye on whether the uptrend comes to an end and give directions in various ways.


Question 2- Identify these candlestick patterns listed in question one on any cryptocurrency pair chart and explain how price reacted after the formation. (Screenshot your own chart for this exercise)


Hammer candlestick pattern Chart
Here we can see the chart above consists of hammer candlesticks that can be moved downwards. They sell all the time and give buyers inside the market with price controlled hints. So they have different sides so they manage to grow cotton in different directions.
Doji Candlestick pattern chart
The Doji pattern we have already discussed above illustrates differently why Doji represents such a decision. Here the price is further pressured to reject prices and to be pushed less by price bears. Prices here can be made by moving first down and then higher to second place. So the last thing that can be said is where the market started and where the day started.
Bullish engulfing candlestick pattern Chart
The chart below clearly shows how the downtrend was formed. Here a bullish candle that hints at changes in different markets. So in front of their candles can in any way make the forword of various ups and down of market.
Morning and evening star candlestick pattern Chart
Morning star pattern, here the morning star is a bullish. So the downward retro pattern which is opposite to the evening star. Warns of this for weaknesses in the downtrend that could potentially lead to a trend catastrophe. The weakness here is confirmed by the third candle, which must be our transparent light and must be well closed to the body of the first candlestick. If the volume of the third candlestick is above average, the reliability is much higher.
Evening star pattern is a bearish and top trend reverse pattern that warns of the potential catastrophe of an uptrend. It is always the opposite of the Morning Star and consists of three candles like the Morning Star, and the gap between the real bodies of the two candlesticks forms a dodge.


Question 3- Using a demo account, open a trade using any of the Candlestick pattern on any cryptocurrency pair. You can use a lower timeframe for this exercise.(Screenshot your own chart for this exercise)


Now I will show, how to create a trading demo account in Meta4 trading app.
1

2
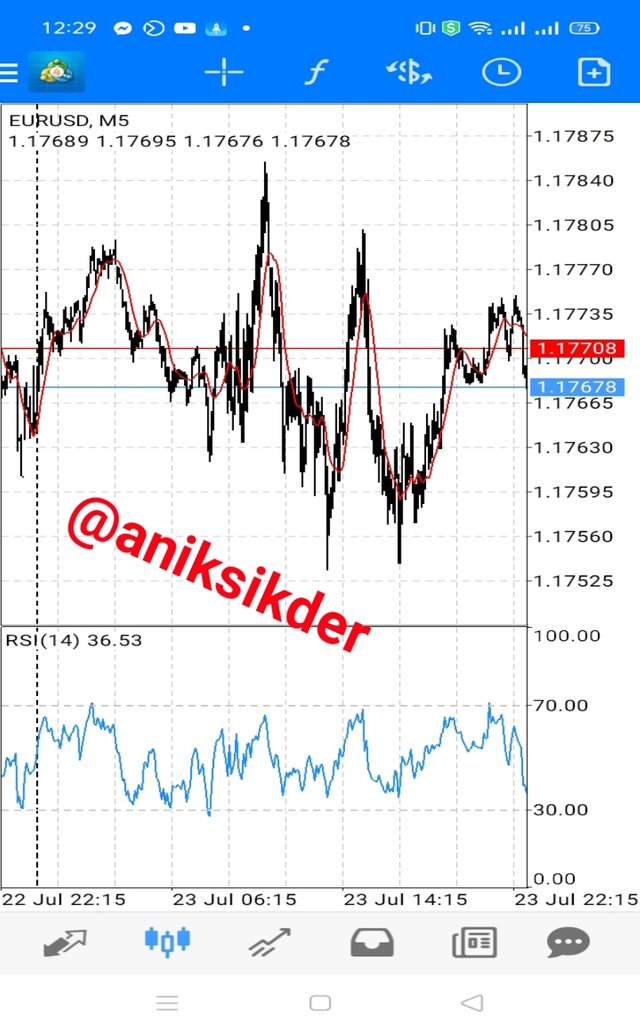
I have able to identify from this chart which shows that many buyers and sellers in the market are ahead in different ways and this chart is managed as a different direction. There is no way to tell happen in the future. Now if we have a doji candle, I have a purchase order that will prove to be a wrong market execution.

CONCLUSION

This is the end of my Homework post for session 3 and week 4. Thank you so much Professor @reminiscence01 for giving us this knowledge. I believe that all newcomers like can achieve lot by trying this post. Candlestick patterns help traders in a variety of ways and that helps identify areas of resistance.
Here’s another new thing I learned, the candlestick pattern is a very important aspect for different cryptocurrency traders. The most important aspect here is that they indicate different prices, which is a huge means of bringing capital to traders. So candles will help to trade the pattern from all side and traders are advised to use and learn them.

Regards:
@steemitblog

@aniksikder
Here My Twitter Link
Downvoting a post can decrease pending rewards and make it less visible. Common reasons:
Submit
Hello @noraiz , I’m glad you participated in the 4th Week of the Beginner’s class at the Steemit Crypto Academy. Your grades in this task are as follows:
Recommendation / Feedback:
Please pay attention to the lesson and homework guidelines before performing the tasks.
Thank you for participating in this homework task.
Downvoting a post can decrease pending rewards and make it less visible. Common reasons:
Submit
Dear professor sir thanks for your valuable feedback. I understand that, I don't have to give any source for chart, I have to make my own chart.
Downvoting a post can decrease pending rewards and make it less visible. Common reasons:
Submit