Introduction
1. What do you understand by trading? Explain your understanding in your own words.
Trading simply entails the exchange of value between two or more persons. In the concept of cryptocurrency, Trading means the buying and selling of an asset in the Crypto market. The main aim of Trading is to make a profit out of the market and solve life-related problems with your profit. In trading, you have to buy at a low price and sell at a higher price or you can sell at a low price and buy more at a lower price in the market.
You trade Cryptocurrency in exchanges. They are two types of exchanges which are decentralized and centralized. Decentralized Exchanges are those exchanges that enable their users to trade with one another without any third party being involved. Their users connect their wallet to this DEX and choose their favorite Cryptocurrency and then exchange it for the required token examples are uniswap, pancake swap, spooky swap, etc. Centralized Exchanges are those exchange that is owned by an individual who takes charge of the affairs and rules of the exchange. Users sign up for this exchange and abide by the rules and regulations laid down by the exchange to enable them to trade. Examples are Binance, Bybit, Kukoin, hotbit, 5roi, etc. Traders make use of this exchange to execute their trade after proper analysis of the asset.
Before taking a trade, traders take certain steps which includes
- Fundamental, Technical and sentimental Analysis of the asset they are investing in. Fundamental analysis involves news and information on the media that can move the direction of the market examples are political news from world powers against or for an asset, economic news from leaders of big financial institutions world like banks, trade unions, etc. It also involves checking out the owner, community, and use case of the Crypto asset that you are investing in because negative news in the above can lead to losses. This helps traders in union with Technical analysis to make a good trade move. Technical analysis involves reading charts, candlesticks, and using indicators to predict the future price movement of the market. It requires knowing the different types of candlestick which are all synonymous with important moves in the market. The traders might equally need to go and study the different indicators present in the market because they are used to understanding the movement of the market better. The trader will also need to study the uses of all the tools in www.tradingview.com which is very useful for technical analysis.
- The trader needs to develop a very good trading strategy after he minus have understood fundamental and technical analysis.
- The trader will have to also develop good trading psychology. This is very important because this determines the profitability of the trader. Good Trading Psychology eliminates greed, fear(FUD & FOMO), revenge, etc. It helps the trader to develop the right mindset and patience to trade the Crypto market
- The trader needs to develop a good risk management strategy. The best advice ratio is Take Profit 2:1 Stop Loss to avoid loss of trading capital.
- The trader will also create a long-term goal for his trading plan because trading is not a get-rich-quick scheme but a means of earning a lifetime living. And every trader must learn to obey their trading strategy.
2. What are the strong and weak hands in the market? Be graphic and provide a full explanation.
Strong hands in the Market.
They are the big players in the market who control the movement of the market to their chosen direction because there has the required capital to control the law of the supply and demand in the market. They include hedge funds, financial institutions like banks, insurance companies, etc, big companies. They are called whales. They have the privilege of getting information from the right sources and then moving the market in their chosen direction.
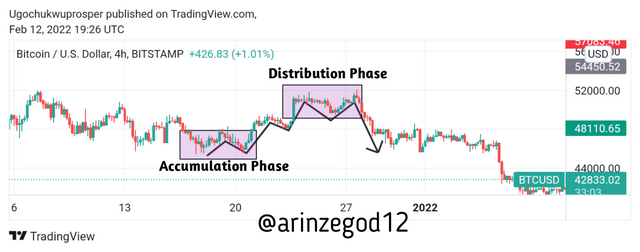
The strong hands in the market move the market by accumulating a lot of the asset when the price is low till their money can contain, then they buy up most of the remaining to reduce the supply drastically. Then finally when the price and demand become high, they start selling their assets and this gives them lots of profit while the market starts reversing downward.
Below is the screenshot:
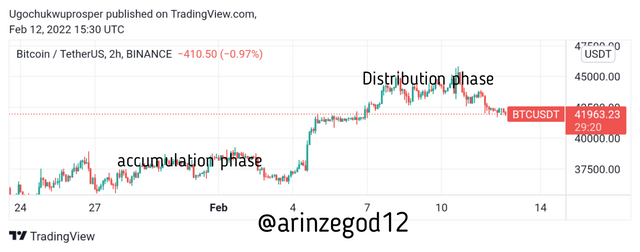
Source: Tradingview
Weak hands in the market.
They are the retail traders in the market that trades with small money and always bear the loss in the market because they don't understand the ways of the whales. They usually sell when the price is going down(FUD) which is when the strong hands are buying and they buy when the price is already high(FOMO) thinking that it will continue going higher while it's then that the whales dump on them and they lose their money.
3. Which do you think is the better idea: think like the pack or as a pro?
I think it's better to think like a pro. Haven understood the way the movement in the market occurs, I think every trader whether the strong or weak hands should begin to think and act like professionals will help you to be able to make enough profit from the market although you are a normal retail trader against the whales. Thinking like a pro always gives you an edge ahead of the whales when they are making a move because you have positioned yourself to think and act ahead of their actions.
4. Demonstrate your understanding of trend trading. (Use cryptocurrency chart screenshots.)
Elliot's wave theory depends on the point that markets might have duplicative patterns, it usually occurs that the emotions of traders in the market are often the same and it reproduces market cycles causing it to reoccur again in view. With this established, we are to find uptrend tendencies that are the ascending waves and drawdown that is the descending waves in the crypto market.
Bullish Stage: The uptrend will be created by 5 waves which are 1,2,3,4 and 5.
Bearish Stage: The downtrend will be set by 3 waves which are a,b and c.
In the bullish stage, we see the bullish tendencies in three waves which are 1,3,5, and two correction waves which are 2 and 4.
Wave 5 of the bullish stage begins the bearish stage which has waves A and C as bearish, then wave B which is the correction wave,
Having understood this, let's see an example:
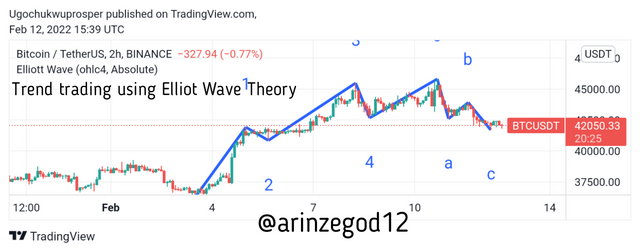
Source: Tradingview
5. Show how to identify the first and last impulse waves in a trend, plus explain the importance of this. (Use cryptocurrency chart screenshots)
For you to identify the first impulse, you have to take into consideration the Elliot wave theory. When it's inputted into your candlestick chart, the first impulse is formed at the point between wave 5 and corrective wave A and the corrective wave B and C. The corrective wave C will always form a higher peak that corrective wave A which introduces the beginning of a new trend from bearish to bullish and this is regarded as the First Impulse Wave. The importance of this First impulse wave is to give the trader a clear entry point for either a buy or sell opportunity.
The screenshot below shows a clear description of the First Impulse Wave.
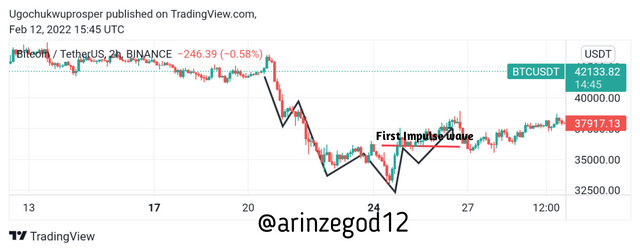
Source: Tradingview
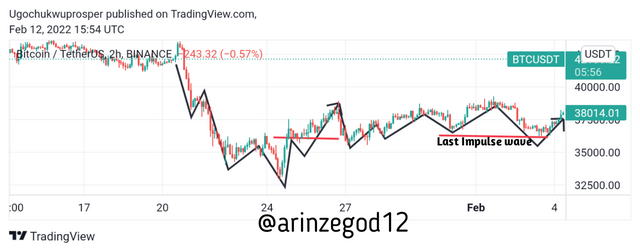
For the Last impulse wave, we have to consider the Elliot wave theory again and check through the current trend of the market till we get up-to wave 5 and the three corrective waves(A,B & C). You identify the last impulse between corrective wave A and B. This last impulse wave helps you to know when the exit the market with your profit before the trend reverses.
Below is the screenshot of the last impulse wave.
Source: Tradingview
6. Show how to identify a good point to set a buy and sell order. (Use cryptocurrency chart screenshots)
To place your buy and sell order you have to still use the Elliot wave which we have discussed in the questions above. So for that reason, I will have to go straight to the point here.
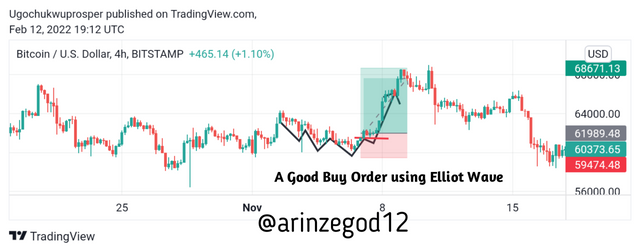
To identify a good point to set a buy order, it has to be little above the trend line drawn between the corrective wave B and C in the First impulse wave. Once the corrective wave C breaks the resistance zone, then we will open the buy position a little above the line in order to be safe. You have to input your take profit to be at the top of the wave 2 which will forms a higher peak than the corrective wave C and stop loss will be at the support level between the corrective wave B and C.
Source: Tradingview
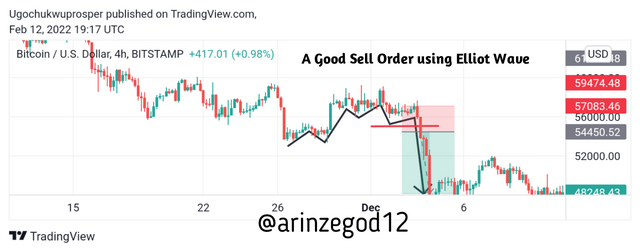
To identify a good point to set a sell order, it's best seen in the last impulse wave and you place your sell order in the line drawn between the corrective wave A and B in the chart. The take profit is at the lower peak of the corrective wave C formed and stop loss is the support between the wave 5 and corrective wave A.
Source: Tradingview
7. Explain the relationship of Elliott Wave Theory with the explained method. Be graphic when explaining.
Elliot wave is virtually involved in everything being discussed in this series. It is related to both the technical, fundamental and sentimental analysis as the Elliot wave always plays out in the long run after every analysis. Even the strong hands in the market also makes moves in accordance to the Elliot waves. They watch out for the 5 waves and the corrective waves as well before making decisions. If we look at the chart of BTCUSDT below we will watch out all this things play out as if they are all planned.
Source: Tradingview
Conclusion
Thanks prof @nane15 for the wonderful lecture. I have really learnt a lot concerning the directions of the price in the market and how to think and act like the pro's. I hope for more beautiful lectures in the upcoming weeks. Thanks.